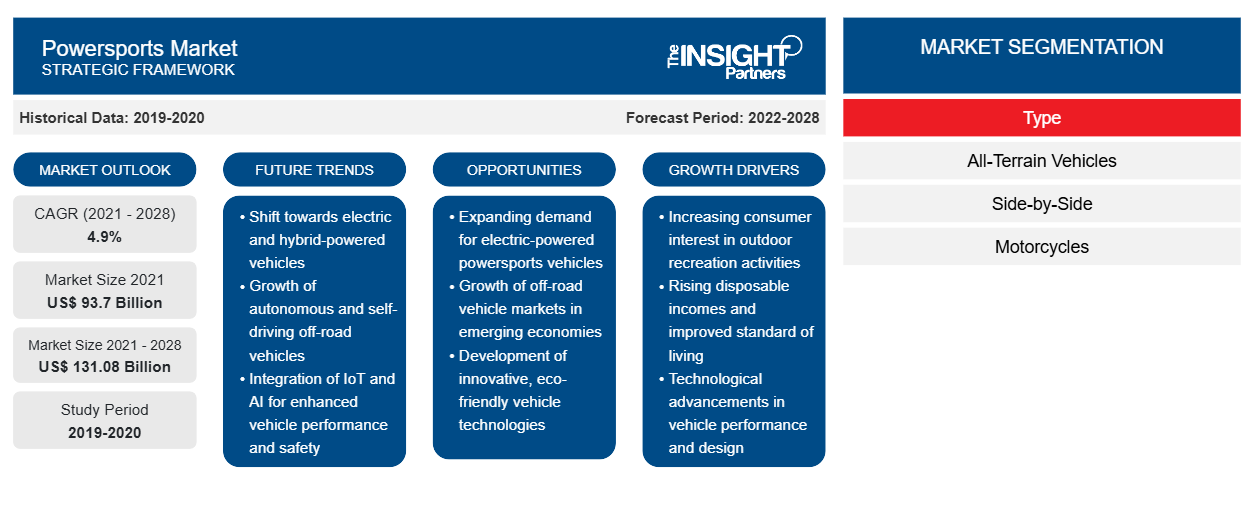
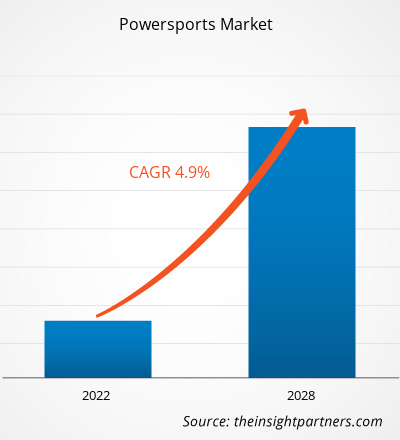
[تقرير بحثي] من المتوقع أن ينمو سوق الرياضات الآلية من 93,703.64 مليون دولار أمريكي في عام 2021 إلى 131,083.20 مليون دولار أمريكي بحلول عام 2028؛ ومن المتوقع أن ينمو بمعدل نمو سنوي مركب قدره 4.9٪ خلال الفترة 2021-2028.
تتضمن سياحة المغامرات السفر إلى أماكن جديدة لاكتساب خبرات جديدة، مع عناصر مخاطرة خاضعة للرقابة وتحديات شخصية في بيئات برية وغريبة. ويساهم زيادة عدد الزوار المهتمين بالقيادة على الطرق الوعرة في النمو الاقتصادي للبلد المعني.
تولد رياضة السيارات أكثر من 1.15 مليار دولار أمريكي من الإيرادات في ماليزيا كل عام من خلال الإسكان والخدمات اللوجستية ونفقات السياحة. تشمل أحداث السباق التي تستضيفها ماليزيا سباق الجائزة الكبرى للدراجات النارية (MotoGP) وبطولة آسيا لسباقات الطرق (ARRC) وجائزة الأشبال الماليزية. تجلب هذه الأحداث فوائد اجتماعية واقتصادية كبيرة. إن الوعي الواسع النطاق بين سياح الرياضة فيما يتعلق بمثل هذه الأحداث هو قلب سياحة رياضة السيارات. إن المدة الطويلة للأحداث والرؤية والتغطية من قبل وسائل الإعلام المطبوعة والإلكترونية والرعاية من الشركات المحلية والعالمية والفرص الاقتصادية المفرطة للسكان المحليين كلها مزايا لوجهات سياحة رياضة السيارات. عوامل مثل مستويات الطاقة العالية والدافع والرغبة في السفر بين الناس هي العوامل الرئيسية التي تدفع دافع السفر. بالنسبة للكثيرين، فإن الرغبة في مقابلة أشخاص جدد ومتشابهين في التفكير ولديهم اهتمامات اجتماعية مماثلة هي القوة الدافعة للطرق الوعرة. تؤدي هذه الميزات إلى نمو سوق رياضة السيارات.
قم بتخصيص هذا التقرير ليناسب متطلباتك
ستحصل على تخصيص لأي تقرير - مجانًا - بما في ذلك أجزاء من هذا التقرير، أو تحليل على مستوى الدولة، وحزمة بيانات Excel، بالإضافة إلى الاستفادة من العروض والخصومات الرائعة للشركات الناشئة والجامعات
- احصل على أهم اتجاهات السوق الرئيسية لهذا التقرير.ستتضمن هذه العينة المجانية تحليلاً للبيانات، بدءًا من اتجاهات السوق وحتى التقديرات والتوقعات.
تأثير جائحة كوفيد-19 على سوق الرياضات الآلية العالمية
قبل جائحة كوفيد-19، كان سوق الرياضات الآلية ينمو بسبب زيادة حركة تجار المركبات ذات التضاريس الوعرة. على سبيل المثال، ارتفع اهتمام المستهلكين بالمركبات ذات التضاريس الوعرة ومركبات التضاريس المتعددة ووحدات الرياضات الآلية المتخصصة بنسبة 35% في الأشهر السبعة الأولى من عام 2019، بناءً على عمليات البحث على أساس سنوي في سوق تجار المركبات ذات التضاريس الوعرة التابع لشركة Trader Interactive. تنمو حركة تجار المركبات ذات التضاريس الوعرة بشكل أسرع شهريًا، مما يعكس تحولًا في السوق يمكن أن يساعد تجار الرياضات الآلية في تعويض مبيعات الدراجات النارية المستقرة. دعمت قفزة حركة تجار المركبات ذات التضاريس الوعرة نمو سوق الرياضات الآلية في عام 2019.
في عام 2020، أثر جائحة كوفيد-19 سلبًا على سوق الرياضات الآلية بسبب تراجع صناعة السيارات العالمية. تسبب تفشي المرض في حدوث اضطرابات كبيرة في تصنيع المنتجات، بما في ذلك السيارات. أثر الانخفاض الحاد في تصنيع السيارات على نمو سوق الرياضات الآلية العالمية. علاوة على ذلك، أظهرت البيانات التي تم جمعها من المنظمة الدولية لصانعي السيارات (OICA) انخفاضًا بنسبة 16٪ في إجمالي عدد إنتاج المركبات في عام 2020 إلى أقل من 78 مليون مركبة. علاوة على ذلك، لمكافحة واحتواء تفشي المرض، تم فرض إغلاق المصانع وحظر السفر وحظر التجارة وإغلاق الحدود؛ أثرت هذه القيود سلبًا على تصنيع وتوريد وبيع مكونات السيارات المختلفة المطلوبة لتصنيع السيارات. لذلك، كان التأثير الإجمالي لـ COVID-19 على سوق الرياضات الآلية سلبيًا في عام 2020.
في عامي 2021 و2022، يدعم تخفيف إجراءات الإغلاق وزيادة إنتاج مركبات الرياضة الآلية نمو السوق. ووفقًا لمقال نشرته شركة Babcox Media Inc. في يوليو 2021، زادت مبيعات الطرازات الجديدة للعلامات التجارية الرائدة بأكثر من 37.2% في الربع الأول من عام 2021.
قبل جائحة كوفيد-19، في عام 2019، بلغ حجم سوق الرياضات الآلية 95,728.13 مليون دولار أمريكي. وبلغ حجم السوق أثناء الجائحة 91,324.63 مليون دولار أمريكي في عام 2020. وعلاوة على ذلك، في عام 2021، بلغ حجم سوق الرياضات الآلية 93,703.64 مليون دولار أمريكي. وبالتالي، كان التأثير الإجمالي لجائحة كوفيد-19 على سوق الرياضات الآلية سلبيًا في عام 2020.
رؤى سوق الرياضات الآلية
زيادة في شعبية المركبات متعددة التضاريس ومناطق التجربة
نظرًا لأدائها الأفضل على التضاريس الصعبة وغير المستوية، فإن المركبات الرباعية الدفع ذات التضاريس الوعرة تحظى بطلب كبير بين المستهلكين. وهذا يدفع مصنعي المركبات الرباعية الدفع إلى تضمين نظام الدفع الرباعي كميزة اختيارية أو كخيار بدوام كامل. تتعرف وصلات الألياف الدقيقة على متطلبات نظام الدفع الرباعي في الوقت الفعلي. تزداد شعبية مثل هذه المركبات الرباعية الدفع الجديدة في بلدان مختلفة. على سبيل المثال، يعقد المجلس الكندي لمنظمة الدراجات النارية الثلجية مسابقات رياضية كل عام. بالإضافة إلى ذلك، تستضيف العديد من الشركات المصنعة الرئيسية للمركبات الرباعية الدفع والمركبات متعددة الاستخدامات بطولات سباق، ومن المتوقع أن يعزز الطلب على هذه المركبات الخدمية. شهدت الولايات المتحدة زيادة في المتنزهات الترفيهية لركوب المركبات الرباعية الدفع. تم إنشاء خيارات ترفيهية على الأراضي العامة في البلاد من خلال إضافة أميال إلى أكثر من 19 طريقًا ترفيهيًا وطنيًا. تُستخدم المركبات الرباعية الدفع أيضًا على نطاق واسع في الخدمات المسلحة، بما في ذلك الوكالات العسكرية والشرطية، حيث تُستخدم بكثافة للنقل في الأماكن المعزولة. ونتيجة لذلك، فإن الطلب المتزايد على مركبات الدفع الرباعي في التطبيقات الترفيهية والرياضية والعسكرية هو أحد العوامل الأساسية التي تدفع نمو سوق الرياضات الآلية.
في المناطق المتقدمة مثل أمريكا الشمالية وأوروبا، تعد مناطق تجربة مركبات الدفع الرباعي شائعة. وعلاوة على ذلك، هناك تركيز متزايد على زيادة عدد هذه المناطق في الأسواق الناشئة، مثل الهند ودول جنوب شرق آسيا، لزيادة الوعي والطلب على المركبات الخدمية. يمكن للعملاء ركوب مركبات الدفع الرباعي على ساحات الطرق الوعرة الاصطناعية في هذه المواقع. على سبيل المثال، قامت شركة بولاريس ببناء منطقة تجربة في بنغالورو بالهند في عام 2018 لتعزيز قاعدة عملائها.
رؤى السوق القائمة على النوع
بناءً على النوع، يتم تقسيم سوق الرياضات الآلية إلى مركبات لجميع التضاريس، ومركبات جنبًا إلى جنب، ودراجات نارية . تصدرت فئة الدراجات النارية السوق بأكبر حصة في عام 2020.
يتبنى اللاعبون العاملون في سوق الرياضات الآلية استراتيجيات مثل عمليات الدمج والاستحواذ ومبادرات السوق للحفاظ على مواقعهم في السوق. وفيما يلي قائمة ببعض التطورات التي قام بها اللاعبون الرئيسيون:
- في مارس 2022، أطلقت شركة BRP دراجات نارية كهربائية ذات عجلتين في الذكرى الخمسين لعلامة Can-Am التجارية. عادت علامة Can-Am التجارية إلى جذورها في مجال الدراجات النارية مع خط إنتاج كامل قائم على الكهرباء. مع الدراجات النارية الكهربائية، تأتي فرصة عظيمة للازدهار في سوق الدراجات النارية.
- في مارس 2021، أطلقت شركة American Landmaster مركبة جنبًا إلى جنب تعمل بالليثيوم تسمى Landmaster EV. دخلت شركة American Landmaster في شراكة مع اثنين من أفضل رواد الصناعة في تكنولوجيا الليثيوم ومحركات التيار المتردد.
رؤى إقليمية حول سوق الرياضات الآلية
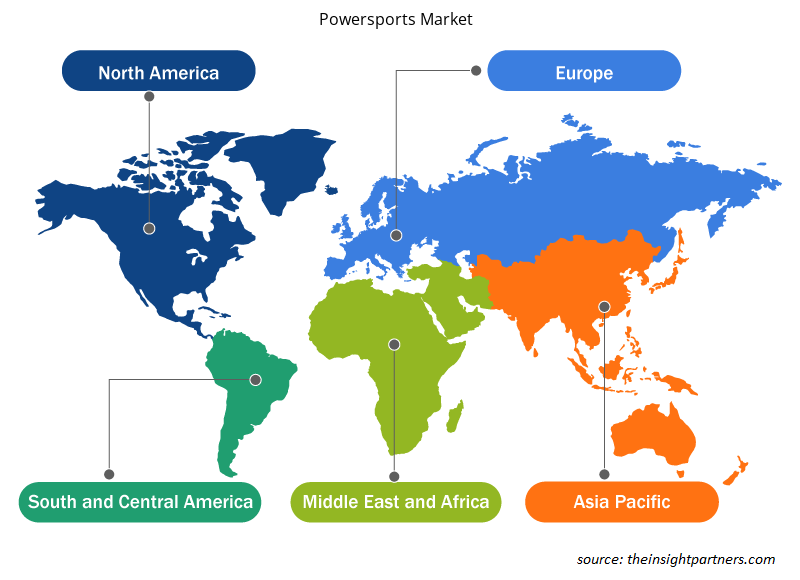
لقد قام المحللون في Insight Partners بشرح الاتجاهات والعوامل الإقليمية المؤثرة على سوق Powersports طوال فترة التوقعات بشكل شامل. يناقش هذا القسم أيضًا قطاعات سوق Powersports والجغرافيا في جميع أنحاء أمريكا الشمالية وأوروبا ومنطقة آسيا والمحيط الهادئ والشرق الأوسط وأفريقيا وأمريكا الجنوبية والوسطى.

- احصل على البيانات الإقليمية المحددة لسوق الرياضات الآلية
نطاق تقرير سوق الرياضات الآلية
| سمة التقرير | تفاصيل |
|---|---|
| حجم السوق في عام 2021 | 93.7 مليار دولار أمريكي |
| حجم السوق بحلول عام 2028 | 131.08 مليار دولار أمريكي |
| معدل النمو السنوي المركب العالمي (2021 - 2028) | 4.9% |
| البيانات التاريخية | 2019-2020 |
| فترة التنبؤ | 2022-2028 |
| القطاعات المغطاة | حسب النوع
|
| المناطق والدول المغطاة | أمريكا الشمالية
|
| قادة السوق وملفات تعريف الشركات الرئيسية |
|
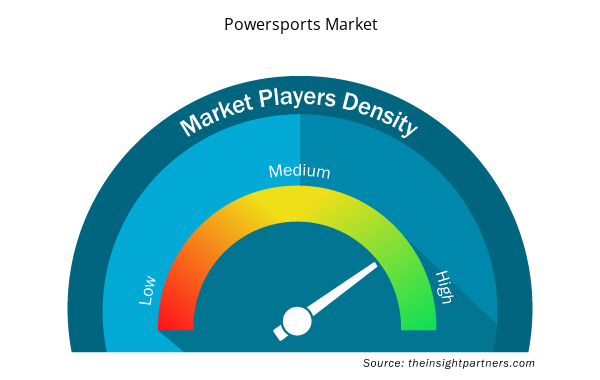
كثافة اللاعبين في السوق: فهم تأثيرها على ديناميكيات الأعمال
يشهد سوق الرياضات الآلية نموًا سريعًا، مدفوعًا بالطلب المتزايد من جانب المستخدم النهائي بسبب عوامل مثل تفضيلات المستهلكين المتطورة والتقدم التكنولوجي والوعي المتزايد بفوائد المنتج. ومع ارتفاع الطلب، تعمل الشركات على توسيع عروضها والابتكار لتلبية احتياجات المستهلكين والاستفادة من الاتجاهات الناشئة، مما يؤدي إلى زيادة نمو السوق.
تشير كثافة اللاعبين في السوق إلى توزيع الشركات أو المؤسسات العاملة في سوق أو صناعة معينة. وهي تشير إلى عدد المنافسين (اللاعبين في السوق) الموجودين في مساحة سوق معينة نسبة إلى حجمها أو قيمتها السوقية الإجمالية.
الشركات الرئيسية العاملة في سوق الرياضات الآلية هي:
- أمريكان لاند ماستر
- قطة القطب الشمالي
- بي ار بي
- شركة هيسون موتورز، الولايات المتحدة الأمريكية
- شركة كاواساكي موتورز
إخلاء المسؤولية : الشركات المذكورة أعلاه ليست مرتبة بأي ترتيب معين.

- احصل على نظرة عامة على أفضل اللاعبين الرئيسيين في سوق Powersports
نبذة عن الشركة
- أمريكان لاند ماستر
- قطة القطب الشمالي
- بي ار بي
- شركة هيسون موتورز، الولايات المتحدة الأمريكية
- شركة كاواساكي موتورز
- شركة بولاريس
- شركة ياماها موتور
- سوزوكي موتور الولايات المتحدة الأمريكية
- فولكون للرياضات الإلكترونية
- شركة هوندا موتور الأمريكية المحدودة
- التحليل التاريخي (سنتان)، السنة الأساسية، التوقعات (7 سنوات) مع معدل النمو السنوي المركب
- تحليل PEST و SWOT
- حجم السوق والقيمة / الحجم - عالميًا وإقليميًا وقطريًا
- الصناعة والمنافسة
- مجموعة بيانات Excel


Report Coverage
Revenue forecast, Company Analysis, Industry landscape, Growth factors, and Trends

Segment Covered
This text is related
to segments covered.

Regional Scope
North America, Europe, Asia Pacific, Middle East & Africa, South & Central America

Country Scope
This text is related
to country scope.
الأسئلة الشائعة
Based on motorcycles, powersports market is segmented into street, cruiser, sports, dual sports, adventure, and others. In 2020, the street segment led the market and accounted for the largest market share.
The major five companies in powersports includes Arctic Cat Inc; American Honda Motor Co., Inc; Polaris Inc.; Suzuki Motor Corporation; and Yamaha Motor Co., Ltd.
In 2021, APAC led the market with a substantial revenue share, followed by North America and Europe. APAC is a prospective market for powersports manufacturers.
Based on type, the powersports market is segmented into all-terrain vehicles, side-by-side, and motorcycles. The motorcycles segment led the powersports market with the largest share in 2020.
Increase in all-terrain vehicle popularity and experience zones and rise in use of powersports to boost adventure tourism are driving the growth of the powersports market.
The market opportunity lies in developing countries. Developing countries have become a hub of opportunity for various markets, including powersports market. Further, innovations in powersports products is presenting significant potential for the future growth of the powersports market players.
Trends and growth analysis reports related to Automotive and Transportation : READ MORE..
The List of Companies - Powersports Market
- American Landmaster
- ARCTIC CAT
- BRP
- Hisun Motors Corp., USA
- Kawasaki Motors Corp
- Polaris Inc.
- Yamaha Motor Corporation
- Suzuki Motor USA
- Volcon ePowersports
- American Honda Motor Company, Inc.
The Insight Partners performs research in 4 major stages: Data Collection & Secondary Research, Primary Research, Data Analysis and Data Triangulation & Final Review.
- Data Collection and Secondary Research:
As a market research and consulting firm operating from a decade, we have published and advised several client across the globe. First step for any study will start with an assessment of currently available data and insights from existing reports. Further, historical and current market information is collected from Investor Presentations, Annual Reports, SEC Filings, etc., and other information related to company’s performance and market positioning are gathered from Paid Databases (Factiva, Hoovers, and Reuters) and various other publications available in public domain.
Several associations trade associates, technical forums, institutes, societies and organization are accessed to gain technical as well as market related insights through their publications such as research papers, blogs and press releases related to the studies are referred to get cues about the market. Further, white papers, journals, magazines, and other news articles published in last 3 years are scrutinized and analyzed to understand the current market trends.
- Primary Research:
The primarily interview analysis comprise of data obtained from industry participants interview and answers to survey questions gathered by in-house primary team.
For primary research, interviews are conducted with industry experts/CEOs/Marketing Managers/VPs/Subject Matter Experts from both demand and supply side to get a 360-degree view of the market. The primary team conducts several interviews based on the complexity of the markets to understand the various market trends and dynamics which makes research more credible and precise.
A typical research interview fulfils the following functions:
- Provides first-hand information on the market size, market trends, growth trends, competitive landscape, and outlook
- Validates and strengthens in-house secondary research findings
- Develops the analysis team’s expertise and market understanding
Primary research involves email interactions and telephone interviews for each market, category, segment, and sub-segment across geographies. The participants who typically take part in such a process include, but are not limited to:
- Industry participants: VPs, business development managers, market intelligence managers and national sales managers
- Outside experts: Valuation experts, research analysts and key opinion leaders specializing in the electronics and semiconductor industry.
Below is the breakup of our primary respondents by company, designation, and region:

Once we receive the confirmation from primary research sources or primary respondents, we finalize the base year market estimation and forecast the data as per the macroeconomic and microeconomic factors assessed during data collection.
- Data Analysis:
Once data is validated through both secondary as well as primary respondents, we finalize the market estimations by hypothesis formulation and factor analysis at regional and country level.
- Macro-Economic Factor Analysis:
We analyse macroeconomic indicators such the gross domestic product (GDP), increase in the demand for goods and services across industries, technological advancement, regional economic growth, governmental policies, the influence of COVID-19, PEST analysis, and other aspects. This analysis aids in setting benchmarks for various nations/regions and approximating market splits. Additionally, the general trend of the aforementioned components aid in determining the market's development possibilities.
- Country Level Data:
Various factors that are especially aligned to the country are taken into account to determine the market size for a certain area and country, including the presence of vendors, such as headquarters and offices, the country's GDP, demand patterns, and industry growth. To comprehend the market dynamics for the nation, a number of growth variables, inhibitors, application areas, and current market trends are researched. The aforementioned elements aid in determining the country's overall market's growth potential.
- Company Profile:
The “Table of Contents” is formulated by listing and analyzing more than 25 - 30 companies operating in the market ecosystem across geographies. However, we profile only 10 companies as a standard practice in our syndicate reports. These 10 companies comprise leading, emerging, and regional players. Nonetheless, our analysis is not restricted to the 10 listed companies, we also analyze other companies present in the market to develop a holistic view and understand the prevailing trends. The “Company Profiles” section in the report covers key facts, business description, products & services, financial information, SWOT analysis, and key developments. The financial information presented is extracted from the annual reports and official documents of the publicly listed companies. Upon collecting the information for the sections of respective companies, we verify them via various primary sources and then compile the data in respective company profiles. The company level information helps us in deriving the base number as well as in forecasting the market size.
- Developing Base Number:
Aggregation of sales statistics (2020-2022) and macro-economic factor, and other secondary and primary research insights are utilized to arrive at base number and related market shares for 2022. The data gaps are identified in this step and relevant market data is analyzed, collected from paid primary interviews or databases. On finalizing the base year market size, forecasts are developed on the basis of macro-economic, industry and market growth factors and company level analysis.
- Data Triangulation and Final Review:
The market findings and base year market size calculations are validated from supply as well as demand side. Demand side validations are based on macro-economic factor analysis and benchmarks for respective regions and countries. In case of supply side validations, revenues of major companies are estimated (in case not available) based on industry benchmark, approximate number of employees, product portfolio, and primary interviews revenues are gathered. Further revenue from target product/service segment is assessed to avoid overshooting of market statistics. In case of heavy deviations between supply and demand side values, all thes steps are repeated to achieve synchronization.
We follow an iterative model, wherein we share our research findings with Subject Matter Experts (SME’s) and Key Opinion Leaders (KOLs) until consensus view of the market is not formulated – this model negates any drastic deviation in the opinions of experts. Only validated and universally acceptable research findings are quoted in our reports.
We have important check points that we use to validate our research findings – which we call – data triangulation, where we validate the information, we generate from secondary sources with primary interviews and then we re-validate with our internal data bases and Subject matter experts. This comprehensive model enables us to deliver high quality, reliable data in shortest possible time.


 احصل على عينة مجانية لهذا التقرير