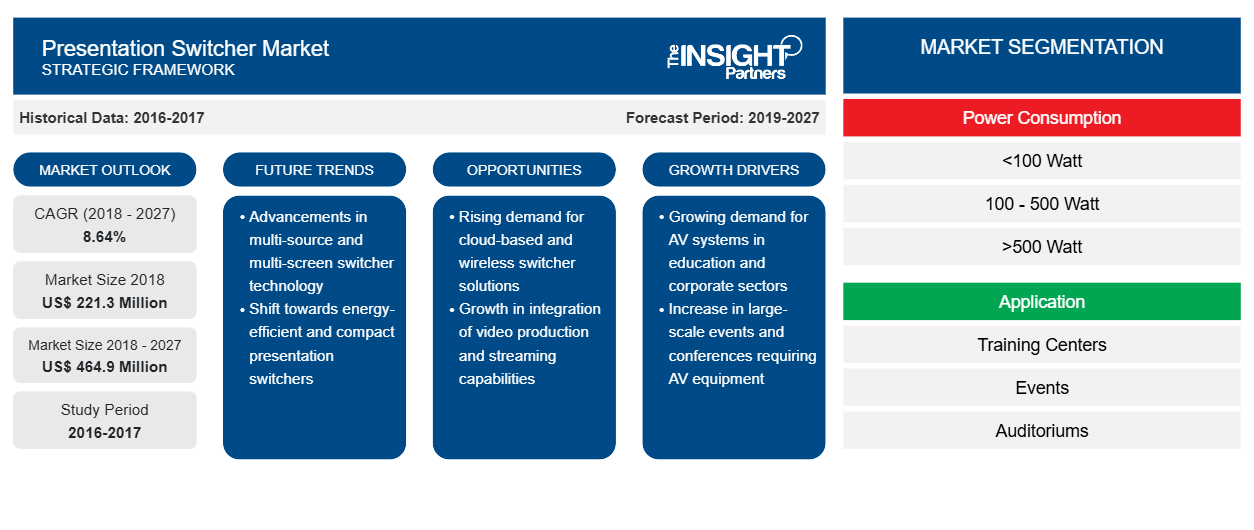
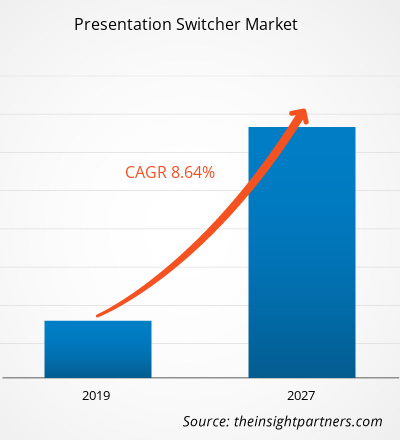
بلغت قيمة سوق محول العرض 221.3 مليون دولار أمريكي في عام 2018؛ ومن المتوقع أن ينمو بمعدل نمو سنوي مركب قدره 8.64٪ خلال الفترة المتوقعة، ليصل إلى 464.9 مليون دولار أمريكي بحلول عام 2027.
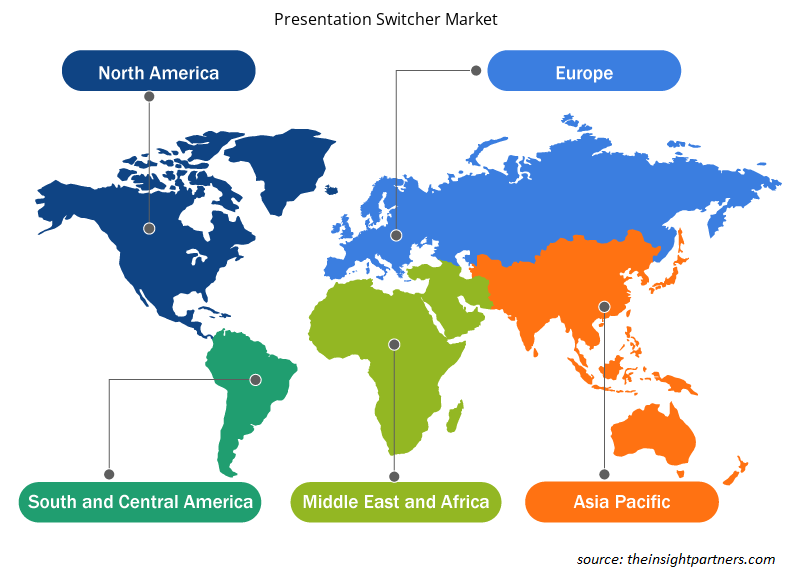
تساهم منطقة آسيا والمحيط الهادئ بأعلى حصة في هذا السوق، تليها أوروبا ثم أمريكا الشمالية. تتصدر منطقة آسيا والمحيط الهادئ سوق محولات العرض، نظرًا لصناعة الأحداث المتنامية في منطقة آسيا والمحيط الهادئ، يبحث المسوقون عن المعدات المناسبة لبرامج الأحداث الخاصة بهم. في الوقت الحاضر، مع زيادة الاستثمار في مركز التدريب والأحداث والملاعب والساحات، وتطوير التكنولوجيا والبيانات، تركز الشركات بشكل كبير على تبني محولات العرض لتقديم تأثيرات صوتية وفيديو متقدمة. كما يُقدر أن تكتسب منطقة آسيا والمحيط الهادئ حصة كبيرة من الإيرادات في السوق الإجمالية نتيجة للاقتصاد المتنامي ومبادرات التحول الرقمي المتزايدة في المنطقة.
قم بتخصيص هذا التقرير ليناسب متطلباتك
ستحصل على تخصيص لأي تقرير - مجانًا - بما في ذلك أجزاء من هذا التقرير، أو تحليل على مستوى الدولة، وحزمة بيانات Excel، بالإضافة إلى الاستفادة من العروض والخصومات الرائعة للشركات الناشئة والجامعات
سوق أجهزة تبديل العروض التقديمية:
- احصل على أهم اتجاهات السوق الرئيسية لهذا التقرير.ستتضمن هذه العينة المجانية تحليلاً للبيانات، بدءًا من اتجاهات السوق وحتى التقديرات والتوقعات.
رؤى السوق
إن العدد المتزايد من الملاعب والصالات الرياضية على مستوى العالم يعزز الطلب على سوق محولات العرض
يتزايد عدد الملاعب على مستوى العالم مع تزايد أهمية صناعة الرياضة من حيث عدد الأحداث. ويعزز العدد المتزايد من الملاعب والصالات في جميع أنحاء العالم سوق محولات العرض حيث تسعى كل الملاعب والصالات إلى الحصول على تقنيات بث فعالة. توفر محولات العرض مدخلات ومخرجات متعددة من خلال جهاز واحد. يتضمن البث المباشر للأحداث الرياضية نقل الإشارات على مدى بعيد لسهولة الوصول إلى المشاهدين البعيدين، وتلعب محولات العرض دورًا مهمًا في تقنيات البث التقليدية. وبالتالي، فإن الزيادة العالمية في عدد الملاعب والصالات تعزز سوق محولات العرض.
إن الوعي المتزايد فيما يتعلق بمحول العرض في البلدان النامية يوفر فرصة مزدهرة لسوق محول العرض
لقد نضج سوق محولات العرض في الدول المتقدمة في أمريكا الشمالية وأوروبا ومنطقة آسيا والمحيط الهادئ. ومع ذلك، فإن العديد من الدول النامية في منطقة آسيا والمحيط الهادئ والشرق الأوسط وأفريقيا وأمريكا الجنوبية تكتسب وعيًا فيما يتعلق بتكنولوجيا محولات العرض. هذا العامل هو فرصة رئيسية للاعبين في سوق محولات العرض لتوسيع بصماتهم العالمية وتعزيز إيراداتهم السنوية عامًا بعد عام.
رؤى استهلاك الطاقة
يتم تصنيف سوق محولات العرض العالمية من حيث استهلاك الطاقة إلى <100 واط، و100-500 واط، و>500 واط. ومن المتوقع أن تهيمن شريحة <100 واط على سوق محولات العرض في عام 2018، في حين ينمو نشر 101-500 واط بأعلى معدل نمو سنوي مركب. ومن المتوقع أن يرتفع الطلب على محولات العرض التي تستهلك طاقة تتراوح بين 100 و500 واط في السنوات القادمة بسبب الحاجة المتزايدة إلى محولات العرض في الملاعب والصالات. تستثمر العديد من البلدان مبالغ كبيرة في توسيع الملاعب الرياضية، وهو ما من المتوقع أن يحفز الطلب على محولات العرض التي تتراوح بين 100 و500 واط.
رؤى التطبيق
يتم تقسيم سوق محولات العرض العالمية حسب التطبيق إلى مراكز التدريب والأحداث والقاعات والملاعب والساحات والمتاحف والقباب السماوية وغيرها. من المتوقع أن تهيمن شريحة مراكز التدريب على سوق محولات العرض طوال فترة التنبؤ. تشمل المراكز التي تنطوي على تدريب الفصول الدراسية أجهزة تسجيل الفيديو (أي مسجلات أشرطة الفيديو) وأجهزة الكمبيوتر القديمة القائمة على VGA (أي القائمة على مجموعة رسومات الفيديو) وأجهزة الكمبيوتر المجهزة بواجهة HDMI (أي المجهزة بواجهة الوسائط المتعددة عالية الدقة) وأجهزة iPad واللوحات التفاعلية، والتي يجب دمجها بسعر منخفض. بالإضافة إلى ذلك، تم بناء غرف المؤتمرات لتلبية مجموعة واسعة من مقدمي العروض في جميع أنحاء العالم.
ومن المتوقع أيضًا أن يساهم النمو في أنشطة البحث والتطوير التي يقوم بها بائعو محولات العرض لتقديم التقنيات المستقبلية في سوق محولات العرض العالمية في السنوات القادمة. وفيما يلي بعض التطورات الأخيرة:
2019: بدأت شركة Atlona في شحن محول العرض المصفوفي 6×2 كجزء من العروض الاستراتيجية الجديدة في سلسلة Omega سريعة النمو.
2018: أعلنت شركة Analog Way عن اتفاقية التوزيع الجديدة مع شركة LANG BARANDAY AG في سويسرا.
2017: أطلقت شركة Presentation Switchers Inc. جهاز PS105، وهو الأول في سلسلة AV+IoT الخاصة بها من محولات العرض الرقمية المدمجة التي تستهدف التعاون ومساحات غرف المؤتمرات الصغيرة.
رؤى إقليمية حول سوق محولات العرض التقديمي
لقد قام المحللون في Insight Partners بشرح الاتجاهات والعوامل الإقليمية المؤثرة على سوق Presentation Switcher طوال فترة التوقعات بشكل شامل. يناقش هذا القسم أيضًا قطاعات سوق Presentation Switcher والجغرافيا في جميع أنحاء أمريكا الشمالية وأوروبا ومنطقة آسيا والمحيط الهادئ والشرق الأوسط وأفريقيا وأمريكا الجنوبية والوسطى.
- احصل على البيانات الإقليمية المحددة لسوق محول العرض
نطاق تقرير سوق محول العرض التقديمي
| سمة التقرير | تفاصيل |
|---|---|
| حجم السوق في عام 2018 | 221.3 مليون دولار أمريكي |
| حجم السوق بحلول عام 2027 | 464.9 مليون دولار أمريكي |
| معدل النمو السنوي المركب العالمي (2018 - 2027) | 8.64% |
| البيانات التاريخية | 2016-2017 |
| فترة التنبؤ | 2019-2027 |
| القطاعات المغطاة | حسب استهلاك الطاقة
|
| المناطق والدول المغطاة | أمريكا الشمالية
|
| قادة السوق وملفات تعريف الشركات الرئيسية |
|
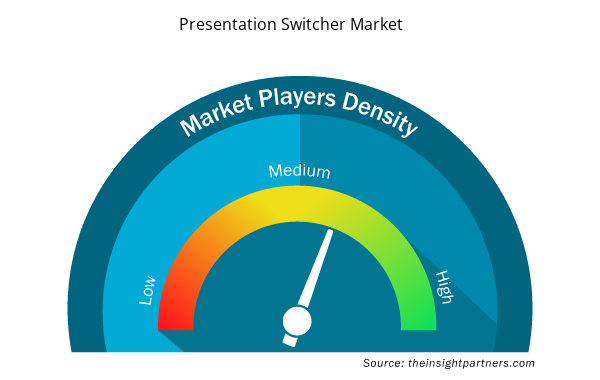
كثافة اللاعبين في السوق: فهم تأثيرها على ديناميكيات الأعمال
يشهد سوق محولات العرض نموًا سريعًا، مدفوعًا بالطلب المتزايد من المستخدم النهائي بسبب عوامل مثل تفضيلات المستهلك المتطورة والتقدم التكنولوجي والوعي المتزايد بفوائد المنتج. ومع ارتفاع الطلب، تعمل الشركات على توسيع عروضها والابتكار لتلبية احتياجات المستهلكين والاستفادة من الاتجاهات الناشئة، مما يؤدي إلى زيادة نمو السوق.
تشير كثافة اللاعبين في السوق إلى توزيع الشركات أو المؤسسات العاملة في سوق أو صناعة معينة. وهي تشير إلى عدد المنافسين (اللاعبين في السوق) الموجودين في مساحة سوق معينة نسبة إلى حجمها أو قيمتها السوقية الإجمالية.
الشركات الرئيسية العاملة في سوق محول العرض هي:
- شركة اتلونا (باندويت)
- طريقة SAS التناظرية
- باركو إن في
- شركة كريسترون للإلكترونيات
- كريستي ديجيتال سيستمز، المحدودة
إخلاء المسؤولية : الشركات المذكورة أعلاه ليست مرتبة بأي ترتيب معين.
- احصل على نظرة عامة على أهم اللاعبين الرئيسيين في سوق Presentation Switcher
محول العرض التقديمي العالمي – تقسيم السوق
حسب استهلاك الطاقة
- <100 واط
- 100 – 500 واط
- >500 واط
حسب الطلب
- مركز تدريب
- الأحداث
- القاعات
- الملاعب والحلبات
- المتاحف والقباب السماوية
- آحرون
حسب الجغرافيا
أمريكا الشمالية
- نحن
- كندا
- المكسيك
أوروبا
- فرنسا
- ألمانيا
- المملكة المتحدة
- إيطاليا
- روسيا
- بقية أوروبا
آسيا والمحيط الهادئ (APAC)
- أستراليا
- الصين
- الهند
- اليابان
- كوريا الجنوبية
- بقية منطقة آسيا والمحيط الهادئ
الشرق الأوسط وأفريقيا
- المملكة العربية السعودية
- جنوب أفريقيا
- الامارات العربية المتحدة
- باقي منطقة الشرق الأوسط وأفريقيا
أمريكا الجنوبية (SAM)
- البرازيل
- بقية سام
نبذة عن الشركة
- شركة اتلونا (باندويت)
- طريقة SAS التناظرية
- باركو إن في
- شركة كريسترون للإلكترونيات
- كريستي ديجيتال سيستمز، المحدودة
- شركة CYP (المملكة المتحدة) المحدودة
- شركة اف اس ار
- شركة هارمان الدولية للصناعات
- لوجيك ايه في
- شركة تبديل العروض التقديمية
اللاعبون الآخرون في السوق من سلسلة القيمة:
تعد شركة Kramer Electronics Ltd.، وExtron، وATEN، وDVIGear, Inc.، وBlack Box Corporation من بين عدد قليل من اللاعبين الآخرين في السوق من سلسلة القيمة الذين لم يتم ذكرهم في التقرير ولكن يمكن تضمينهم بناءً على الطلب.
- التحليل التاريخي (سنتان)، السنة الأساسية، التوقعات (7 سنوات) مع معدل النمو السنوي المركب
- تحليل PEST و SWOT
- حجم السوق والقيمة / الحجم - عالميًا وإقليميًا وقطريًا
- الصناعة والمنافسة
- مجموعة بيانات Excel


Report Coverage
Revenue forecast, Company Analysis, Industry landscape, Growth factors, and Trends

Segment Covered
This text is related
to segments covered.

Regional Scope
North America, Europe, Asia Pacific, Middle East & Africa, South & Central America

Country Scope
This text is related
to country scope.
الأسئلة الشائعة
The presentation switchers consuming <100 Watt are the most attractive presentation switchers across end-used worldwide. The <100 Watt presentation switchers are used in larger spaces, including training centers, events, auditoriums, stadium and arenas, and museums and planetariums. The demand for less power consumption appliances is strongly growing among the end-users, and owing to this, the demand for <100 Watt presentation switchers is expected to remain high throughout the forecast period.
The awareness related to presentation switcher has matured in developed countries and in a few developing nations. However, the consciousness about the benefits of presentation switcher is growing among various other developing countries including, Australia, Singapore, Malaysia, Thailand, Taiwan, UAE, Qatar, Saudi Arabia, South Africa, and Brazil, which is expected to catalyze the market revenue size of presentation switcher market in the future.
Asia-Pacific is the fastest-growing region in various technologies. The region witnessed significant growth in the commercial sector and the industrial sector. The growth in the sectors mentioned above is playing a crucial role in propelling the presentation switcher market.
Continuous rise in the number of auditoriums and training centers in different countries in Asia-Pacific has positively impacted on the growth of the presentation switcher market, and increase in live events, and construction or up-gradation of stadiums across the region is expected to create lucrative business opportunities for presentation switcher market players.
Trends and growth analysis reports related to Electronics and Semiconductor : READ MORE..
The List of Companies
- Atlona Inc. (Panduit)
- Analog Way SAS
- Barco NV
- Crestron Electronics, Inc.
- Christie Digital Systems, Inc.
- CYP (UK) Ltd.
- FSR, Inc.
- Harman International Industries
- LogicAV
- Presentation Switchers, Inc.
The Insight Partners performs research in 4 major stages: Data Collection & Secondary Research, Primary Research, Data Analysis and Data Triangulation & Final Review.
- Data Collection and Secondary Research:
As a market research and consulting firm operating from a decade, we have published and advised several client across the globe. First step for any study will start with an assessment of currently available data and insights from existing reports. Further, historical and current market information is collected from Investor Presentations, Annual Reports, SEC Filings, etc., and other information related to company’s performance and market positioning are gathered from Paid Databases (Factiva, Hoovers, and Reuters) and various other publications available in public domain.
Several associations trade associates, technical forums, institutes, societies and organization are accessed to gain technical as well as market related insights through their publications such as research papers, blogs and press releases related to the studies are referred to get cues about the market. Further, white papers, journals, magazines, and other news articles published in last 3 years are scrutinized and analyzed to understand the current market trends.
- Primary Research:
The primarily interview analysis comprise of data obtained from industry participants interview and answers to survey questions gathered by in-house primary team.
For primary research, interviews are conducted with industry experts/CEOs/Marketing Managers/VPs/Subject Matter Experts from both demand and supply side to get a 360-degree view of the market. The primary team conducts several interviews based on the complexity of the markets to understand the various market trends and dynamics which makes research more credible and precise.
A typical research interview fulfils the following functions:
- Provides first-hand information on the market size, market trends, growth trends, competitive landscape, and outlook
- Validates and strengthens in-house secondary research findings
- Develops the analysis team’s expertise and market understanding
Primary research involves email interactions and telephone interviews for each market, category, segment, and sub-segment across geographies. The participants who typically take part in such a process include, but are not limited to:
- Industry participants: VPs, business development managers, market intelligence managers and national sales managers
- Outside experts: Valuation experts, research analysts and key opinion leaders specializing in the electronics and semiconductor industry.
Below is the breakup of our primary respondents by company, designation, and region:

Once we receive the confirmation from primary research sources or primary respondents, we finalize the base year market estimation and forecast the data as per the macroeconomic and microeconomic factors assessed during data collection.
- Data Analysis:
Once data is validated through both secondary as well as primary respondents, we finalize the market estimations by hypothesis formulation and factor analysis at regional and country level.
- Macro-Economic Factor Analysis:
We analyse macroeconomic indicators such the gross domestic product (GDP), increase in the demand for goods and services across industries, technological advancement, regional economic growth, governmental policies, the influence of COVID-19, PEST analysis, and other aspects. This analysis aids in setting benchmarks for various nations/regions and approximating market splits. Additionally, the general trend of the aforementioned components aid in determining the market's development possibilities.
- Country Level Data:
Various factors that are especially aligned to the country are taken into account to determine the market size for a certain area and country, including the presence of vendors, such as headquarters and offices, the country's GDP, demand patterns, and industry growth. To comprehend the market dynamics for the nation, a number of growth variables, inhibitors, application areas, and current market trends are researched. The aforementioned elements aid in determining the country's overall market's growth potential.
- Company Profile:
The “Table of Contents” is formulated by listing and analyzing more than 25 - 30 companies operating in the market ecosystem across geographies. However, we profile only 10 companies as a standard practice in our syndicate reports. These 10 companies comprise leading, emerging, and regional players. Nonetheless, our analysis is not restricted to the 10 listed companies, we also analyze other companies present in the market to develop a holistic view and understand the prevailing trends. The “Company Profiles” section in the report covers key facts, business description, products & services, financial information, SWOT analysis, and key developments. The financial information presented is extracted from the annual reports and official documents of the publicly listed companies. Upon collecting the information for the sections of respective companies, we verify them via various primary sources and then compile the data in respective company profiles. The company level information helps us in deriving the base number as well as in forecasting the market size.
- Developing Base Number:
Aggregation of sales statistics (2020-2022) and macro-economic factor, and other secondary and primary research insights are utilized to arrive at base number and related market shares for 2022. The data gaps are identified in this step and relevant market data is analyzed, collected from paid primary interviews or databases. On finalizing the base year market size, forecasts are developed on the basis of macro-economic, industry and market growth factors and company level analysis.
- Data Triangulation and Final Review:
The market findings and base year market size calculations are validated from supply as well as demand side. Demand side validations are based on macro-economic factor analysis and benchmarks for respective regions and countries. In case of supply side validations, revenues of major companies are estimated (in case not available) based on industry benchmark, approximate number of employees, product portfolio, and primary interviews revenues are gathered. Further revenue from target product/service segment is assessed to avoid overshooting of market statistics. In case of heavy deviations between supply and demand side values, all thes steps are repeated to achieve synchronization.
We follow an iterative model, wherein we share our research findings with Subject Matter Experts (SME’s) and Key Opinion Leaders (KOLs) until consensus view of the market is not formulated – this model negates any drastic deviation in the opinions of experts. Only validated and universally acceptable research findings are quoted in our reports.
We have important check points that we use to validate our research findings – which we call – data triangulation, where we validate the information, we generate from secondary sources with primary interviews and then we re-validate with our internal data bases and Subject matter experts. This comprehensive model enables us to deliver high quality, reliable data in shortest possible time.
 احصل على عينة مجانية لهذا التقرير