استراتيجيات سوق المستحضرات الصيدلانية الإشعاعية العلاجية، وأفضل اللاعبين، وفرص النمو، والتحليل والتنبؤ بحلول عام 2028
البيانات التاريخية : 2020-2021 | سنة الأساس : 2022 | فترة التنبؤ : 2023-2028توقعات سوق التشخيص العلاجي الصيدلاني الإشعاعي حتى عام ٢٠٢٨ - تأثير جائحة كوفيد-١٩ والتحليل العالمي حسب نوع المنتج [مُصدرات ألفا، مُصدرات بيتا، ومُتتبعات التصوير المقطعي بالإصدار البوزيتروني (PET))، والنظائر المشعة [تكنيتيوم-٩٩، غاليوم-٦٨، يود-١٣١، يود-١٢٣، 18F، Y-٩٠، لوتيتيوم (Lu) ١٧٧، نحاس (Cu) ٦٧، نحاس (Cu) ٦٤، وغيرها]، والمصدر (المفاعلات النووية والسيكلوترونات)، والتطبيق [العلاج المُستهدف (Rx) والتشخيص المُصاحب (DX)]، والمؤشر (علم الأورام، أمراض القلب، طب الأعصاب، وغيرها)، والمستخدم النهائي (المستشفيات، مراكز التصوير التشخيصي، المعاهد الأكاديمية والبحثية، وغيرها).
- تاريخ التقرير : Mar 2023
- رمز التقرير : TIPRE00024328
- الفئة : علوم الحياة
- الحالة : نُشرت
- تنسيقات التقارير المتاحة :


- عدد الصفحات : 185
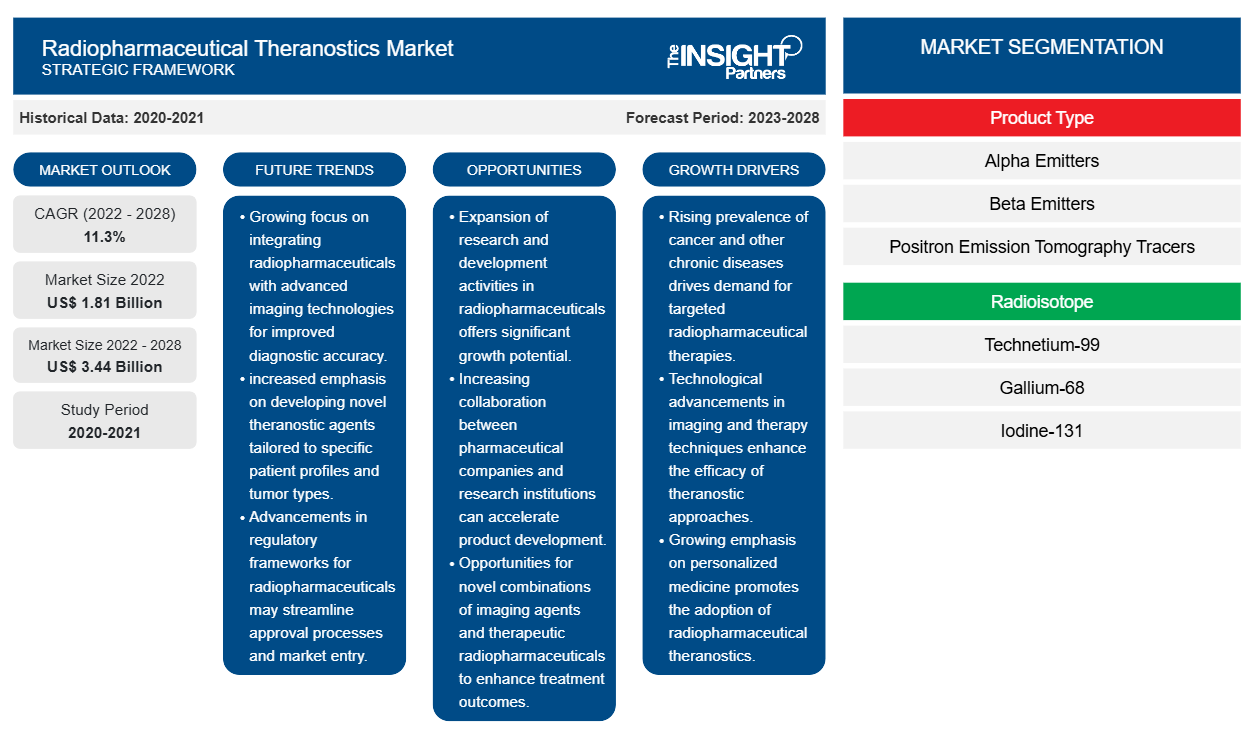
[تقرير بحثي] من المتوقع أن ينمو حجم سوق التشخيص العلاجي بالأدوية الإشعاعية من 1،814.58 مليون دولار أمريكي في عام 2022 إلى 3،441.97 مليون دولار أمريكي بحلول عام 2028؛ ومن المتوقع أن يسجل معدل نمو سنوي مركب بنسبة 11.3٪ من عام 2022 إلى عام 2028.
يتم تقسيم سوق التشخيص العلاجي بالأدوية الإشعاعية على أساس نوع المنتج والنظائر المشعة والمصدر والتطبيق والمؤشر والمستخدم النهائي والموقع الجغرافي. يقدم التقرير رؤى وتحليلات متعمقة للسوق، مع التركيز على معايير مثل الديناميكيات والاتجاهات والفرص السائدة في سوق التشخيص العلاجي بالأدوية الإشعاعية. كما يوفر تحليلًا للمنافسة بين كبار اللاعبين في السوق العالمية للتشخيص العلاجي بالأدوية الإشعاعية.
رؤى السوق
ارتفاع الطلب على علاج اضطرابات القلب والأوعية الدموية يدفع نمو سوق التشخيص العلاجي الإشعاعي العالمي
تُعد أمراض القلب والأوعية الدموية من أكثر الأمراض المزمنة انتشارًا في القرن الحادي والعشرين، مع ارتفاع معدل الوفيات. وبسبب نمط حياتهم المستقر، تُعَد أمراض القلب والأوعية الدموية السبب الرئيسي للوفاة والمرض في البلدان المتقدمة. بالإضافة إلى ذلك، ترتبط السمنة والسكري والأمراض ذات الصلة بأمراض القلب والأوعية الدموية وتصبح أمراضًا مصاحبة. بالإضافة إلى ذلك، فإن المضاعفات مثل انسداد الشريان التاجي هي أحد الأسباب الرئيسية للوفاة لدى البالغين، مما يؤدي إلى تكوين لويحات خثرية في بطانة جدار الشرايين، وخاصة في الشريان السباتي. ووفقًا لبيانات المركز الوطني للتكنولوجيا الحيوية، توفي حوالي 17.7 مليون شخص في جميع أنحاء العالم في عام 2015 بسبب أمراض القلب والأوعية الدموية. وفي هذا الصدد، من المتوقع أن يرتفع معدل الوفيات الناجمة عن أمراض القلب والأوعية الدموية إلى 22 مليونًا بحلول عام 2030. وتشمل التطبيقات العلاجية لأمراض القلب والأوعية الدموية الطب النانوي في الذبحة الصدرية والتهاب عضلة القلب واحتشاء عضلة القلب وأمراض التامور والجلطات وتصلب الشرايين وفرط شحميات الدم وارتفاع ضغط الدم وارتفاع ضغط الدم الشرياني الرئوي والسكتة الدماغية. ويمكن للطب النانوي التشخيصي العلاجي إطالة الدورة الدموية الجهازية والتهرب من أنظمة دفاع المضيف وتوصيل عوامل التشخيص العلاجي إلى موقع الهدف للتصوير والعلاج على المستويين الخلوي والجزيئي.
قم بتخصيص هذا التقرير ليناسب متطلباتك
ستحصل على تخصيص لأي تقرير - مجانًا - بما في ذلك أجزاء من هذا التقرير، أو تحليل على مستوى الدولة، وحزمة بيانات Excel، بالإضافة إلى الاستفادة من العروض والخصومات الرائعة للشركات الناشئة والجامعات
سوق التشخيص العلاجي الإشعاعي: رؤى استراتيجية
- احصل على أهم اتجاهات السوق الرئيسية لهذا التقرير.ستتضمن هذه العينة المجانية تحليلاً للبيانات، بدءًا من اتجاهات السوق وحتى التقديرات والتوقعات.
وفقًا لتقرير عام 2022 الصادر عن مراكز السيطرة على الأمراض والوقاية منها (CDC)، فإن أمراض القلب هي السبب الرئيسي للوفاة بين الرجال والنساء في الولايات المتحدة. كان مرض القلب سببًا في وفاة حوالي 697000 شخص، أي 1 من كل 5 وفيات، في الولايات المتحدة في عام 2020. يذكر تقرير المعهد الوطني للصحة (NIH) أن الجسيمات النانوية العلاجية التشخيصية اكتسبت اهتمامًا كبيرًا في المجال الطبي، حيث تساعد التقنيات في التغلب على التعقيدات والمضاعفات المرضية المرتبطة بأمراض القلب والأوعية الدموية. يوفر التصوير القلبي الوعائي لمرضى تصلب الشرايين أدلة مرضية يمكن أن تساعد في علاج أمراض القلب والأوعية الدموية. علاوة على ذلك، يمكن دمج الجسيمات النانوية العلاجية التشخيصية مع مجموعة من تقنيات التصوير، مثل التصوير بالرنين المغناطيسي (MRI) والتصوير المقطعي بالإصدار البوزيتروني (PET) والتصوير المقطعي المحوسب (CT). وقد أجريت دراسات بحثية سريرية مختلفة في المختبرات السريرية حتى الآن. تم إنشاء مركب علاجي ثلاثي في واحد، من خلال الجمع بين مسبار ضوئي صوتي بوليمري مع جسيمات نانوية - PLCDP@PMH. تكشف التقييمات السريرية الحية أن PLCDP@PMH يوفر مزايا مربحة لنهج التشخيص العلاجي للكشف عن تصلب الشرايين في مرحلة مبكرة لدى المرضى.
رؤى تعتمد على نوع المنتج
بناءً على نوع المنتج، يتم تقسيم سوق التشخيص العلاجي بالأدوية الإشعاعية إلى متتبعات التصوير المقطعي بالإصدار البوزيتروني (PET)، ومتتبعات بيتا، ومتتبعات ألفا. في عام 2022، استحوذت شريحة متتبعات التصوير المقطعي بالإصدار البوزيتروني (PET) على أكبر حصة من سوق التشخيص العلاجي بالأدوية الإشعاعية العالمية، ومن المتوقع أن تسجل أعلى معدل نمو سنوي مركب خلال فترة التنبؤ.
رؤى تعتمد على النظائر المشعة
بناءً على النظائر المشعة، ينقسم سوق التشخيص العلاجي بالأدوية المشعة إلى لوتيتيوم (Lu) 177، وغاليوم-68، ويودين-131، ويودين-123، وتكنيشيوم-99، وإيتريوم-90 (Y-90)، والنحاس (Cu) 64، و18F، والنحاس (Cu) 67، وغيرها. في عام 2022، احتل قطاع اللوتيتيوم (Lu) 177 أكبر حصة سوقية في سوق التشخيص العلاجي بالأدوية المشعة العالمية ومن المتوقع أن يسجل أعلى معدل نمو سنوي مركب خلال فترة التنبؤ.
رؤى مستندة إلى المصدر
استنادًا إلى المصدر، ينقسم سوق التشخيص العلاجي بالأدوية الإشعاعية إلى السيكلوترونات والمفاعلات النووية. استحوذ قطاع السيكلوترونات على حصة أكبر من السوق في عام 2022، ومن المتوقع أن يسجل معدل نمو سنوي مركب أعلى خلال فترة التوقعات.
رؤى قائمة على التطبيق
بناءً على التطبيق، ينقسم سوق التشخيص العلاجي الإشعاعي إلى العلاج المستهدف (Rx) والتشخيص المرافق (CDx). في عام 2022، استحوذ قطاع العلاج المستهدف (Rx) على حصة أكبر من السوق، ومن المتوقع أن يسجل معدل نمو سنوي مركب أعلى خلال فترة التنبؤ.
رؤى مبنية على المؤشرات
بناءً على المؤشرات، يتم تقسيم سوق التشخيص العلاجي الإشعاعي إلى علم الأورام، وعلم الأعصاب، وأمراض القلب، وغيرها. احتل قطاع علم الأورام الحصة الأكبر من السوق في عام 2022، ومن المتوقع أن يسجل أعلى معدل نمو سنوي مركب خلال الفترة المتوقعة.
رؤى تعتمد على المستخدم النهائي
بناءً على المستخدم النهائي، يتم تقسيم سوق التشخيص العلاجي الإشعاعي إلى مستشفيات ومراكز التصوير التشخيصي والمعاهد الأكاديمية والبحثية وغيرها. احتل قطاع المستشفيات أكبر حصة سوقية في عام 2022. ومع ذلك، من المتوقع أن يسجل قطاع المعاهد الأكاديمية والبحثية أعلى معدل نمو سنوي مركب خلال فترة التوقعات. تستخدم المستشفيات أنظمة متقدمة تقنيًا لعلاج تمدد الأوعية الدموية القلبية وتمدد الأوعية الدموية العصبية والأورام السرطانية وغيرها من الحالات المماثلة. يساهم الانتشار المتزايد للأمراض المختلفة والعدد المتزايد من المستشفيات في نمو سوق قطاع المستشفيات.
يتبنى اللاعبون في سوق التشخيص العلاجي بالأدوية الإشعاعية استراتيجيات عضوية، مثل إطلاق المنتجات والتوسع، لتوسيع نطاق وجودهم ومحفظة منتجاتهم وتلبية الطلبات المتزايدة. وتتمثل استراتيجيات النمو غير العضوية التي شهدها السوق في الشراكات والتعاون. وقد سمحت استراتيجيات النمو هذه للاعبين في السوق بتوسيع أعمالهم وتعزيز حضورهم الجغرافي. بالإضافة إلى ذلك، تساعدهم عمليات الاستحواذ والشراكات واستراتيجيات النمو الأخرى في تعزيز قاعدة عملائهم.
- في أكتوبر 2022، حصلت شركة Telix على موافقة وزارة الصحة الكندية على منتجها Illuccix، وهو عبارة عن مجموعة لتحضير حقنة الغوزيتوتيد بالغاليوم (68Ga). يمكن استخدام المنتج في تحديد مرحلة سرطان البروستاتا المتوسط والعالي الخطورة وإعادة تحديد مرحلة سرطان البروستاتا وتحديد موقع أنسجة الورم في سرطان البروستاتا المتكرر. كان Illuccix أول عامل تصوير PET PSMA يحصل على موافقة تنظيمية في كندا. كانت وزارة الصحة الكندية هي الهيئة التنظيمية الثالثة على مستوى العالم التي توافق على منتج Illuccix، والذي يتوفر تجاريًا في أستراليا والولايات المتحدة.
- في ديسمبر 2021، دخلت شركة GE Healthcare وشركة Minerva Imaging في شراكة استراتيجية لتسريع الإطلاق التجاري للعلاجات الموجهة بالنظائر المشعة (العلاجات التشخيصية). العلاج بالنظائر المشعة هو شكل من أشكال الطب الدقيق حيث يتم إعطاء مادة مشعة عبر مجرى الدم لاستهداف الخلايا السرطانية وتعريضها للإشعاع على وجه التحديد. يساعد هذا في تقليل الآثار الجانبية المحتملة مقارنة بالعلاجات التقليدية للسرطان.
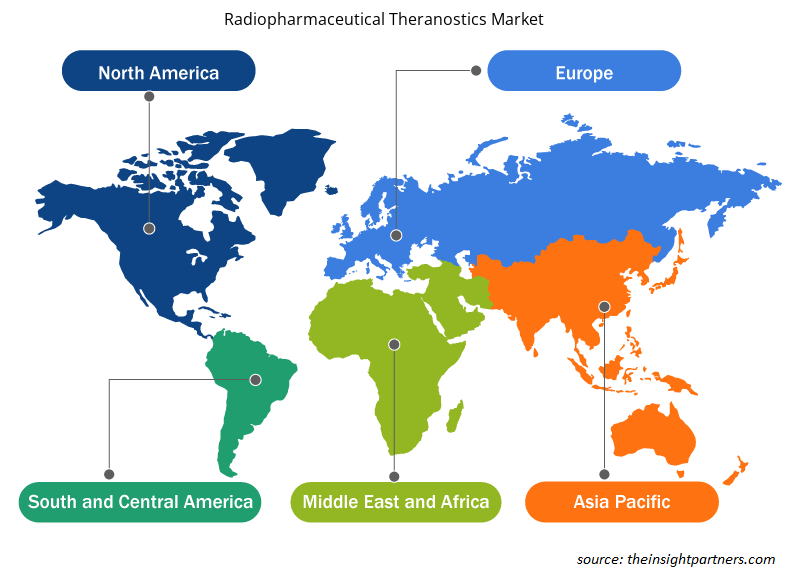
رؤى إقليمية حول سوق التشخيص العلاجي بالأدوية الإشعاعية
لقد قام المحللون في Insight Partners بشرح الاتجاهات والعوامل الإقليمية المؤثرة على سوق التشخيص العلاجي بالأدوية الإشعاعية طوال فترة التوقعات بشكل شامل. يناقش هذا القسم أيضًا قطاعات سوق التشخيص العلاجي بالأدوية الإشعاعية والجغرافيا في جميع أنحاء أمريكا الشمالية وأوروبا ومنطقة آسيا والمحيط الهادئ والشرق الأوسط وأفريقيا وأمريكا الجنوبية والوسطى.
- احصل على البيانات الإقليمية المحددة لسوق التشخيص العلاجي بالأدوية الإشعاعية
نطاق تقرير سوق التشخيص العلاجي بالأدوية الإشعاعية
| سمة التقرير | تفاصيل |
|---|---|
| حجم السوق في عام 2022 | 1.81 مليار دولار أمريكي |
| حجم السوق بحلول عام 2028 | 3.44 مليار دولار أمريكي |
| معدل النمو السنوي المركب العالمي (2022 - 2028) | 11.3% |
| البيانات التاريخية | 2020-2021 |
| فترة التنبؤ | 2023-2028 |
| القطاعات المغطاة | حسب نوع المنتج
|
| المناطق والدول المغطاة | أمريكا الشمالية
|
| قادة السوق وملفات تعريف الشركات الرئيسية |
|
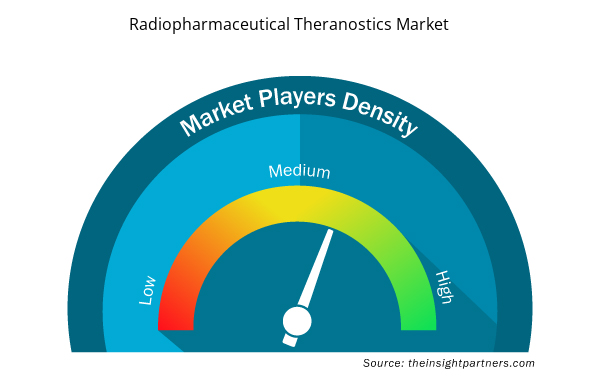
كثافة اللاعبين في سوق التشخيص العلاجي بالأدوية الإشعاعية: فهم تأثيرها على ديناميكيات الأعمال
يشهد سوق التشخيص العلاجي الإشعاعي نموًا سريعًا، مدفوعًا بالطلب المتزايد من المستخدم النهائي بسبب عوامل مثل تفضيلات المستهلك المتطورة والتقدم التكنولوجي والوعي المتزايد بفوائد المنتج. ومع ارتفاع الطلب، تعمل الشركات على توسيع عروضها والابتكار لتلبية احتياجات المستهلكين والاستفادة من الاتجاهات الناشئة، مما يؤدي إلى زيادة نمو السوق.
تشير كثافة اللاعبين في السوق إلى توزيع الشركات أو المؤسسات العاملة في سوق أو صناعة معينة. وهي تشير إلى عدد المنافسين (اللاعبين في السوق) الموجودين في مساحة سوق معينة نسبة إلى حجمها أو قيمتها السوقية الإجمالية.
الشركات الرئيسية العاملة في سوق التشخيص العلاجي الإشعاعي هي:
- شركة باير ايه جي
- شركة جي إي لتقنيات الرعاية الصحية
- كوريوم
- لانثيوس للتصوير الطبي، المحدودة.
- شركة تيليكس للادوية المحدودة
إخلاء المسؤولية : الشركات المذكورة أعلاه ليست مرتبة بأي ترتيب معين.
- احصل على نظرة عامة على أهم اللاعبين الرئيسيين في سوق التشخيص العلاجي بالأدوية الإشعاعية
نبذة عن الشركة - سوق التشخيص العلاجي بالأدوية الإشعاعية
- شركة باير ايه جي
- شركة جي إي لتقنيات الرعاية الصحية
- كوريوم
- لانثيوس للتصوير الطبي، المحدودة.
- شركة تيليكس للادوية المحدودة
- شركة كاردينال هيلث
- تطبيقات مسرعات متقدمة في جنوب أفريقيا
- جوبيلانت راديوفارما
- العلاج المعرفي
- نيوفيو للعلوم الحياتية

مرينال محللة أبحاث مخضرمة، تتمتع بخبرة تزيد عن 8 سنوات في مجال استخبارات واستشارات سوق علوم الحياة. بفضل عقليتها الاستراتيجية والتزامها الراسخ بالتميز، اكتسبت خبرة واسعة في التنبؤ بالصناعات الدوائية، وتقييم فرص السوق، وتطوير معايير الصناعة. يرتكز عملها على تقديم رؤى عملية تُمكّن العملاء من اتخاذ قرارات استراتيجية مدروسة.
تكمن قوة مرينال الأساسية في ترجمة مجموعات البيانات الكمية المعقدة إلى معلومات استخباراتية قيّمة. وتُعدّ براعتها التحليلية ركيزةً أساسيةً في صياغة استراتيجيات دخول السوق (GTM) واكتشاف فرص النمو في قطاعي الأدوية والأجهزة الطبية. وبصفتها مستشارةً موثوقةً، تُركز مرينال باستمرار على تبسيط إجراءات سير العمل وترسيخ أفضل الممارسات، مما يُعزز الابتكار والكفاءة التشغيلية لعملائها.
- التحليل التاريخي (سنتان)، سنة الأساس، التوقعات (7 سنوات) مع معدل النمو السنوي المركب
- تحليل PEST و SWOT
- حجم السوق والقيمة / الحجم - عالمي، إقليمي، بلد
- الصناعة والمنافسة
- مجموعة بيانات إكسل
التقارير الحديثة
تقارير ذات صلة
شهادات العملاء
تقرير سوق أنظمة SCADA من Insight Partners شامل، ويقدم رؤى قيّمة حول الاتجاهات الحالية والتوقعات المستقبلية. تميّز الفريق باحترافية عالية وسرعة في الاستجابة ودعم مستمر طوال الوقت. نحن راضون جدًا ونوصي بشدة بخدماتهم.
ران كيديم شريك, شركة ريالي تكنولوجيز المحدودةطلبتُ تقريرًا عن سوق برمجيات محدد، وأعدّه الفريق في غضون أيام قليلة. كانت المعلومات ذات صلة وثيقة وعرضها جيد. ثم طلبتُ بعض التعديلات والإضافات على التقرير. وكان الفريق متجاوبًا للغاية، وحصلتُ على التقرير النهائي في أقل من أسبوع.
جان هيرفيه جين رئيس مجلس الإدارة, فيوتشر أناليتيكاعملنا مع شركة "إنسايت بارتنرز" لإجراء دراسة سوقية وتوقعات مهمة. زودونا برؤى واضحة حول الفرص والمخاطر، مما ساعدنا في صياغة خططنا. كانت أبحاثهم سهلة الاستخدام ومبنية على بيانات دقيقة، مما ساعدنا على اتخاذ قرارات ذكية وواثقة. نوصي بهم بشدة.
بيوش ناجبال نائب الرئيس الأول, شعاع عالي عالميقدّمت شركة Insight Partners أبحاثًا سوقية ثاقبة ومنظمة جيدًا بخبرة واسعة في هذا المجال. تميّز فريقهم بالاحترافية وسرعة الاستجابة طوال الوقت. وسهّل موقعهم الإلكتروني سهل الاستخدام الوصول إلى تقارير القطاع. نوصي بهم بشدة لخدمات بحثية موثوقة وعالية الجودة.
يوكيهيكو أداتشي المدير التنفيذي, ديب بلو، ذ.م.م.هذه أول مرة أشتري فيها تقرير سوق من The Insight Partners. رغم أنني كنت مترددًا في البداية، إلا أنني زرت موقعهم الإلكتروني وشعرت براحة أكبر للمخاطرة وشراء تقرير السوق. أنا راضٍ تمامًا عن جودة التقرير وخدمة العملاء. كانت لديّ عدة أسئلة وتعليقات حول التقرير الأولي، ولكن بعد بضع محادثات عبر البريد الإلكتروني مع محللهم، أعتقد أن لديّ تقريرًا يمكنني استخدامه كمدخل لعملية التخطيط الاستراتيجي لدينا. شكرًا جزيلاً لكم على تخصيص وقتكم الإضافي وجعل هذه التجربة إيجابية. سأوصي بخدماتكم للآخرين بالتأكيد، وستكونون أول من ألجأ إليه عندما نحتاج إلى المزيد من بيانات السوق.
جون سوزوكي الرئيس والرئيس التنفيذي وعضو مجلس الإدارة, بي كيه تكنولوجيزأود أن أقدّر دعمكم واحترافيتكم في الاستجابة لطلبي للحصول على معلومات بشأن سوق التشخيص المخبري للأمراض المعدية في نيجيريا. كما أُقدّر صبركم وتوجيهكم، واستعدادكم لتقديم خصم، مما مكّننا في النهاية من إتمام الصفقة. أتطلع إلى التعامل مع "ذا إنسايت بارتنرز" مستقبلًا، كل ذلك بفضل الانطباع الذي تركتموه لديّ نتيجةً لهذا اللقاء الأول.
الدكتور تشيجيوك أونيا المدير الإداري, شركة باينكريست للرعاية الصحية المحدودةسبب الشراء
- اتخاذ قرارات مدروسة
- فهم ديناميكيات السوق
- تحليل المنافسة
- رؤى العملاء
- توقعات السوق
- تخفيف المخاطر
- التخطيط الاستراتيجي
- مبررات الاستثمار
- تحديد الأسواق الناشئة
- تحسين استراتيجيات التسويق
- تعزيز الكفاءة التشغيلية
- مواكبة التوجهات التنظيمية


 احصل على عينة مجانية ل - سوق التشخيص العلاجي الإشعاعي