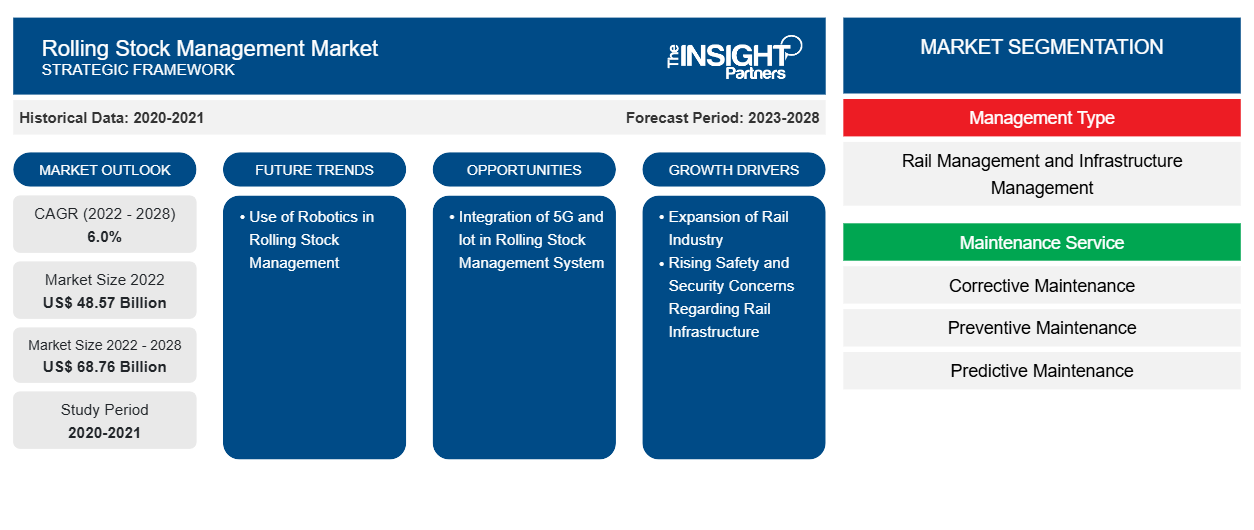
[تقرير بحثي] تم تقييم سوق إدارة المركبات المتحركة بـ 48،571.46 مليون دولار أمريكي في عام 2022 ومن المتوقع أن يصل إلى 68،761.96 مليون دولار أمريكي بحلول عام 2028؛ ومن المتوقع أن يسجل معدل نمو سنوي مركب بنسبة 6.0٪ من عام 2022 إلى عام 2028.
وجهة نظر المحلل:
يشير مصطلح المركبات المتحركة إلى المركبات التي تعمل بالسكك الحديدية والتي تشمل المركبات التي تعمل بالطاقة وغير العاملة بالطاقة . ويشار إليها بأي مركبة سكك حديدية يمكنها التحرك على مسارات السكك الحديدية. تعد صيانة المركبات المتحركة وتتبع المعلومات وإدارتها من السمات الرئيسية لنظام إدارة المركبات المتحركة. فهو يحتفظ بالمعلومات المتعلقة بسجلات التشغيل وكذلك الأعطال والتفتيش الخاصة بالمركبات المتحركة . كما يخزن سجلات المركبات المتحركة من تصنيعها إلى المعلومات المتعلقة بتجهيزاتها الرئيسية. تساعد إدارة سجل تاريخ المركبات المتحركة العمال، أثناء فحصها وتعطلها، على إدارة عملهم بكفاءة. بالإضافة إلى ذلك، يساعد هذا النظام في ربط هذه المعلومات بشكل جماعي بأنظمة إدارة المرور وأنظمة المواد والمحاسبة وخطط النقل وما إلى ذلك. لذلك، يعد نظام إدارة المركبات المتحركة ضروريًا لتحديد الأداء الأمثل للمركبات المتحركة وصناعة السكك الحديدية.
نظرة عامة على السوق: سوق إدارة المركبات المتحركة
يعد نمو صناعة السكك الحديدية أحد العوامل الرئيسية المساهمة في سوق إدارة المركبات المتحركة . إن العدد المتزايد من إطلاق محطات السكك الحديدية الجديدة وتوسيع شبكة السكك الحديدية يولد الحاجة إلى نظام فعال لإدارة المركبات المتحركة لإدارة المركبات المتحركة ومسارها وصيانتها.
وفيما يلي بعض المحطات الرئيسية ومشاريع توسيع السكك الحديدية:
- في مارس 2022، افتتحت المؤسسة العامة للخطوط الحديدية ( سار ) محطة قطارات الركاب بالقريات ضمن خطة المؤسسة لإطلاق قطارات الركاب المتجهة شمالاً.
- في مارس 2023، أعلنت هيئة السكك الحديدية المركزية الهندية عن خطتها لبناء ست محطات سكك حديدية ضواحي جديدة لتلبية احتياجات القطارات المحلية في مومباي. تضم هيئة السكك الحديدية المركزية الهندية 80 محطة، ومع إضافة هذه المحطات الست، ستصل القيمة إلى 86.
قم بتخصيص هذا التقرير ليناسب متطلباتك
ستحصل على تخصيص لأي تقرير - مجانًا - بما في ذلك أجزاء من هذا التقرير، أو تحليل على مستوى الدولة، وحزمة بيانات Excel، بالإضافة إلى الاستفادة من العروض والخصومات الرائعة للشركات الناشئة والجامعات
- احصل على أهم اتجاهات السوق الرئيسية لهذا التقرير.ستتضمن هذه العينة المجانية تحليلاً للبيانات، بدءًا من اتجاهات السوق وحتى التقديرات والتوقعات.
محرك السوق: سوق إدارة المركبات المتحركة
توسع صناعة السكك الحديدية
الطلب على خدمات النقل المحسنة ينمو بسرعة في جميع أنحاء العالم. وفقًا لوكالة الطاقة الدولية ( IEA )، مقارنة بعام 2019، من المتوقع أن تتضاعف أنشطة الركاب والبضائع بحلول عام 2050. وفقًا لمجموعة البنك الدولي، تعتبر السكك الحديدية من أكثر الطرق كفاءة لنقل الركاب والبضائع. نظرًا لأنشطة النقل المتنامية، تستثمر مجموعة البنك الدولي في تطوير صناعة السكك الحديدية لجعلها أكثر كفاءة. تقدم العديد من المنظمات دعمها لحكومات البلدان النامية المختلفة في إصلاح البنية التحتية للسكك الحديدية ودمج السكك الحديدية في شبكة النقل في البلاد. بالإضافة إلى ذلك، تستثمر حكومات البلدان النامية لتعزيز صناعة السكك الحديدية لديها. وفقًا لمؤسسة India Brand Equity Foundation، بحلول عام 2030، ستستثمر الدولة حوالي 715.41 مليار دولار أمريكي في البنية التحتية للسكك الحديدية وتطويرها. لإدارة حركة الركاب والبضائع المتزايدة، تعمل البلدان على توسيع بنيتها التحتية للسكك الحديدية. على سبيل المثال، في سبتمبر 2022، افتتحت وزارة النقل في ولاية كونيتيكت ( CTDOT ) محطة قطار جديدة في مقاطعة هارتفورد، الولايات المتحدة. بالإضافة إلى ذلك، أعلن وزير الاستثمار السعودي في يناير 2022 عن هدف البلاد لتوسيع شبكة السكك الحديدية بمقدار 8000 كيلومتر. يساعد نظام إدارة المركبات المتحركة على تحسين الأداء الأمثل للمركبة المتحركة. يؤدي الارتفاع في توسع وتطوير صناعة السكك الحديدية إلى خلق طلب على المركبات المتحركة مثل القاطرات وعربات الشحن وقطارات الركاب، مما يعزز الطلب على نظام إدارة فعّال للمركبة المتحركة.
التحليل القطاعي: سوق إدارة المركبات المتحركة
بناءً على نوع الإدارة، ينقسم سوق إدارة المركبات المتحركة إلى إدارة السكك الحديدية والبنية الأساسية. بناءً على خدمة الصيانة، يتم تصنيف سوق إدارة المركبات المتحركة إلى الصيانة التصحيحية والصيانة الوقائية والصيانة التنبؤية. من الناحية الجغرافية، يتم تقسيم سوق إدارة المركبات المتحركة إلى أمريكا الشمالية وأوروبا ومنطقة آسيا والمحيط الهادئ والشرق الأوسط وأفريقيا وأمريكا الجنوبية.
التحليل الإقليمي: سوق إدارة المركبات المتحركة
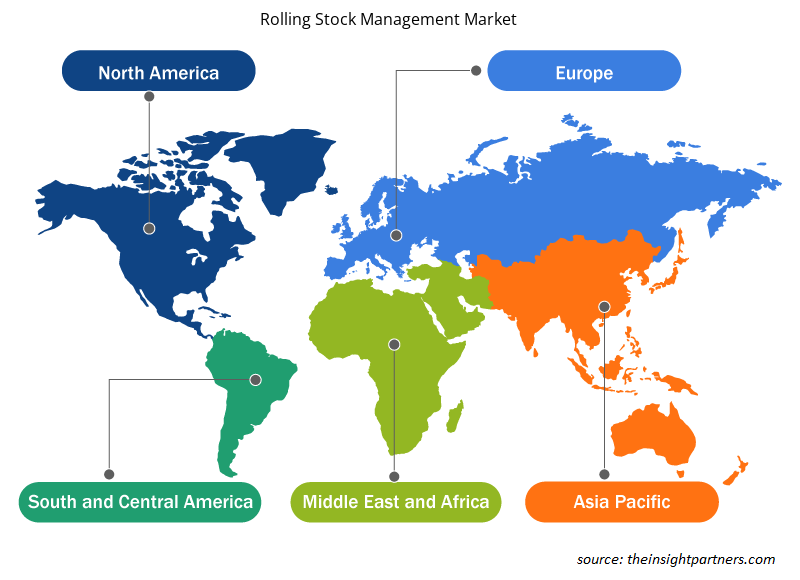
يتم تصنيف سوق إدارة المركبات المتحركة إلى خمس مناطق رئيسية - أمريكا الشمالية وأوروبا وآسيا والمحيط الهادئ والشرق الأوسط وأفريقيا وأمريكا الجنوبية. يُعزى نمو سوق إدارة المركبات المتحركة الجوية العالمية إلى زيادة حركة الركاب وزيادة محطات السكك الحديدية. توجد معظم شبكات السكك الحديدية التقليدية في أمريكا الشمالية وأوروبا ومنطقة آسيا والمحيط الهادئ. وفقًا لبيانات إدارة النقل الفيدرالية في عام 2019، تمثل هذه المناطق حوالي 90٪ من حركة الركاب العالمية على السكك الحديدية التقليدية، حيث تتصدر الهند بنسبة 39٪، تليها الصين بنسبة 27٪، واليابان بنسبة 11٪، والاتحاد الأوروبي بنسبة 9٪. إن العدد المتزايد من البنى التحتية والركاب يعزز الحاجة إلى شراء هذه المركبات المتحركة لتلبية الطلب على خدمات الصيانة المتزايدة. وبالتالي، فإن الارتفاع في عدد محطات السكك الحديدية يعزز الطلب على خدمات إدارة المركبات المتحركة من أجل الكفاءة والموثوقية والسلامة بين السكك الحديدية والمحطات، مما يغذي سوق إدارة المركبات المتحركة.
تحليل اللاعب الرئيسي: سوق إدارة المركبات المتحركة
من بين اللاعبين الرئيسيين العاملين في سوق إدارة المركبات المتحركة شركة Alstom SA، وشركة Hitachi Rail Ltd، وشركة ABB Ltd، وشركة Mitsubishi Electric Corp، وشركة Siemens Mobility GmbH، وشركة Talgo SA، وشركة Thales SA، وشركة Toshiba Infrastructure Systems and Solutions Corp، وشركة Trimble Inc، وشركة LocoTech LLC. تستثمر العديد من الشركات في إدارة المركبات المتحركة نظرًا للتحسينات المحتملة المتعلقة بالدقة والكفاءة التشغيلية وتنفيذ الطلبات في الوقت المناسب للمركبات المتحركة.
رؤى إقليمية حول سوق إدارة المركبات المتحركة
لقد قام المحللون في Insight Partners بشرح الاتجاهات والعوامل الإقليمية المؤثرة على سوق إدارة المركبات المتحركة طوال فترة التوقعات بشكل شامل. يناقش هذا القسم أيضًا قطاعات سوق إدارة المركبات المتحركة والجغرافيا في جميع أنحاء أمريكا الشمالية وأوروبا ومنطقة آسيا والمحيط الهادئ والشرق الأوسط وأفريقيا وأمريكا الجنوبية والوسطى.

- احصل على البيانات الإقليمية المحددة لسوق إدارة المركبات
نطاق تقرير سوق إدارة المركبات المتحركة
| سمة التقرير | تفاصيل |
|---|---|
| حجم السوق في عام 2022 | 48.57 مليار دولار أمريكي |
| حجم السوق بحلول عام 2028 | 68.76 مليار دولار أمريكي |
| معدل النمو السنوي المركب العالمي (2022 - 2028) | 6.0% |
| البيانات التاريخية | 2020-2021 |
| فترة التنبؤ | 2023-2028 |
| القطاعات المغطاة | حسب نوع الإدارة
|
| المناطق والدول المغطاة | أمريكا الشمالية
|
| قادة السوق وملفات تعريف الشركات الرئيسية |
|
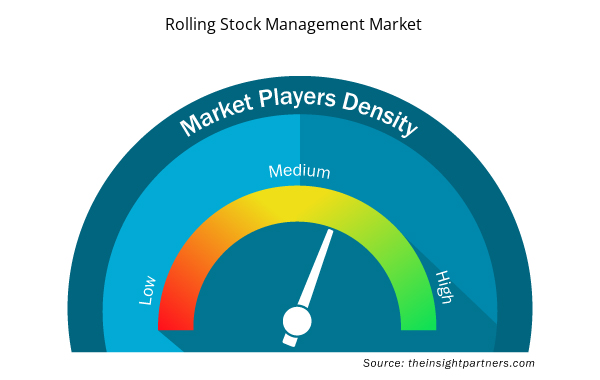
كثافة اللاعبين في السوق: فهم تأثيرها على ديناميكيات الأعمال
يشهد سوق إدارة المركبات المتحركة نموًا سريعًا، مدفوعًا بالطلب المتزايد من المستخدم النهائي بسبب عوامل مثل تفضيلات المستهلك المتطورة والتقدم التكنولوجي والوعي المتزايد بفوائد المنتج. ومع ارتفاع الطلب، تعمل الشركات على توسيع عروضها والابتكار لتلبية احتياجات المستهلكين والاستفادة من الاتجاهات الناشئة، مما يؤدي إلى زيادة نمو السوق.
تشير كثافة اللاعبين في السوق إلى توزيع الشركات أو المؤسسات العاملة في سوق أو صناعة معينة. وهي تشير إلى عدد المنافسين (اللاعبين في السوق) الموجودين في مساحة سوق معينة نسبة إلى حجمها أو قيمتها السوقية الإجمالية.
الشركات الرئيسية العاملة في سوق إدارة المركبات المتحركة هي:
- شركة الستوم السعودية
- شركة أيه بي بي المحدودة
- شركة هيتاشي للسكك الحديدية المحدودة
- شركة ميتسوبيشي الكتريك
- شركة سيمنز للتنقل المحدودة
إخلاء المسؤولية : الشركات المذكورة أعلاه ليست مرتبة بأي ترتيب معين.

- احصل على نظرة عامة على أهم اللاعبين الرئيسيين في سوق إدارة المركبات
التطورات الأخيرة: سوق إدارة المركبات المتحركة
تتبنى الشركات في سوق إدارة المركبات المتحركة استراتيجيات غير عضوية وعضوية مثل عمليات الدمج والاستحواذ على نطاق واسع. وفيما يلي بعض التطورات الرئيسية الأخيرة في سوق إدارة المركبات المتحركة:
- في عام 2023، وقعت شركة ألستوم عقدًا مع هيئة ميناء نيويورك ونيوجيرسي ومطار نيوارك ليبرتي الدولي لتوفير خدمات التشغيل والصيانة لنظام Innovia monorail الخاص بها - AirTrain Newark - لمدة سبع سنوات قادمة بحلول يناير 2030. وتقدر قيمة العقد بأكثر من 260 مليون دولار أمريكي ويتضمن خيارًا لمدة عام إضافي.
- في عام 2023، تلقت شركة ABB طلبات بقيمة 170 مليون دولار أمريكي من شركة Stadler، وهي شركة سويسرية سويدية متعددة الجنسيات، لتشغيل أكثر من 300 قطار وقاطرة جديدة. وقد تم استخدام القطارات عبر شبكات السكك الحديدية الأوروبية المختلفة لتحديث وتعزيز النقل بالقطارات في دول مثل المملكة المتحدة وإسبانيا والبرتغال وألمانيا والنمسا، وكذلك في عدد قليل من ممرات السكك الحديدية الأوروبية.
- في عام 2023، سلمت شركة Siemens Mobility 1200 قاطرة كهربائية ووعدت بتقديم خدمة صيانة كاملة لمدة 35 عامًا. ويعتبر هذا أكبر طلب قاطرة في تاريخ شركة Siemens Mobility وكذلك شركة Siemens India. وبهذا، عززت شركة Siemens Mobility مكانتها في السوق.
- في عام 2022، عرضت شركة Thales تقنية قطارات جديدة لأصحاب المصلحة جعلت شبكة السكك الحديدية في المملكة المتحدة أكثر أمانًا لعمال السكك الحديدية وطواقم القطارات والركاب. عملت Thales مع Network Rail وWest Somerset Railway (WSR) لإجراء عرض حي لنظام الحماية والتحذير للقطارات - الإشراف المستمر (TPWS-CS).
- التحليل التاريخي (سنتان)، السنة الأساسية، التوقعات (7 سنوات) مع معدل النمو السنوي المركب
- تحليل PEST و SWOT
- حجم السوق والقيمة / الحجم - عالميًا وإقليميًا وقطريًا
- الصناعة والمنافسة
- مجموعة بيانات Excel


- Electronic Health Record Market
- Latent TB Detection Market
- Energy Recovery Ventilator Market
- GMP Cytokines Market
- Water Pipeline Leak Detection System Market
- Mice Model Market
- Asset Integrity Management Market
- Smart Mining Market
- Biopharmaceutical Tubing Market
- Vision Guided Robotics Software Market

Report Coverage
Revenue forecast, Company Analysis, Industry landscape, Growth factors, and Trends

Segment Covered
This text is related
to segments covered.

Regional Scope
North America, Europe, Asia Pacific, Middle East & Africa, South & Central America

Country Scope
This text is related
to country scope.
الأسئلة الشائعة
APAC is anticipated to grow with the highest CAGR over the forecast period.
The rolling stock management market was estimated to be US$ 48,571.46 million in 2022 and is expected to grow at a CAGR of 6.0 %, during the period 2022 - 2028.
The military drone market is expected to reach US$ 68,761.96 million by 2028
The key players, holding majority shares, in rolling stock management market includes Alstom SA, Siemens Mobility GmbH, Mitsubishi Electric Corp, Hitachi Rail Ltd, and Toshiba Infrastructure Systems and Solutions Corp.
The use of 5G in the rolling stock management provides higher bandwidth for the data transmission between the rolling stock and authorities engaged in its management. It also improves train-to-ground communications and helps the operators make better decisions regarding the action needed to maintain the reliable operation of the rolling stock.
1. Expansion of Rail Industry
2. Rising Safety and Security Concerns Regarding Rail Infrastructure
The List of Companies - Rolling Stock Management Market
- Alstom SA
- ABB Ltd
- Hitachi Rail Ltd
- Mitsubishi Electric Corp
- Siemens Mobility GmbH
- Talgo SA
- Thales SA
- Toshiba Infrastructure Systems and Solutions Corp
- Trimble Inc
- LocoTech LLC


The Insight Partners performs research in 4 major stages: Data Collection & Secondary Research, Primary Research, Data Analysis and Data Triangulation & Final Review.
- Data Collection and Secondary Research:
As a market research and consulting firm operating from a decade, we have published and advised several client across the globe. First step for any study will start with an assessment of currently available data and insights from existing reports. Further, historical and current market information is collected from Investor Presentations, Annual Reports, SEC Filings, etc., and other information related to company’s performance and market positioning are gathered from Paid Databases (Factiva, Hoovers, and Reuters) and various other publications available in public domain.
Several associations trade associates, technical forums, institutes, societies and organization are accessed to gain technical as well as market related insights through their publications such as research papers, blogs and press releases related to the studies are referred to get cues about the market. Further, white papers, journals, magazines, and other news articles published in last 3 years are scrutinized and analyzed to understand the current market trends.
- Primary Research:
The primarily interview analysis comprise of data obtained from industry participants interview and answers to survey questions gathered by in-house primary team.
For primary research, interviews are conducted with industry experts/CEOs/Marketing Managers/VPs/Subject Matter Experts from both demand and supply side to get a 360-degree view of the market. The primary team conducts several interviews based on the complexity of the markets to understand the various market trends and dynamics which makes research more credible and precise.
A typical research interview fulfils the following functions:
- Provides first-hand information on the market size, market trends, growth trends, competitive landscape, and outlook
- Validates and strengthens in-house secondary research findings
- Develops the analysis team’s expertise and market understanding
Primary research involves email interactions and telephone interviews for each market, category, segment, and sub-segment across geographies. The participants who typically take part in such a process include, but are not limited to:
- Industry participants: VPs, business development managers, market intelligence managers and national sales managers
- Outside experts: Valuation experts, research analysts and key opinion leaders specializing in the electronics and semiconductor industry.
Below is the breakup of our primary respondents by company, designation, and region:

Once we receive the confirmation from primary research sources or primary respondents, we finalize the base year market estimation and forecast the data as per the macroeconomic and microeconomic factors assessed during data collection.
- Data Analysis:
Once data is validated through both secondary as well as primary respondents, we finalize the market estimations by hypothesis formulation and factor analysis at regional and country level.
- Macro-Economic Factor Analysis:
We analyse macroeconomic indicators such the gross domestic product (GDP), increase in the demand for goods and services across industries, technological advancement, regional economic growth, governmental policies, the influence of COVID-19, PEST analysis, and other aspects. This analysis aids in setting benchmarks for various nations/regions and approximating market splits. Additionally, the general trend of the aforementioned components aid in determining the market's development possibilities.
- Country Level Data:
Various factors that are especially aligned to the country are taken into account to determine the market size for a certain area and country, including the presence of vendors, such as headquarters and offices, the country's GDP, demand patterns, and industry growth. To comprehend the market dynamics for the nation, a number of growth variables, inhibitors, application areas, and current market trends are researched. The aforementioned elements aid in determining the country's overall market's growth potential.
- Company Profile:
The “Table of Contents” is formulated by listing and analyzing more than 25 - 30 companies operating in the market ecosystem across geographies. However, we profile only 10 companies as a standard practice in our syndicate reports. These 10 companies comprise leading, emerging, and regional players. Nonetheless, our analysis is not restricted to the 10 listed companies, we also analyze other companies present in the market to develop a holistic view and understand the prevailing trends. The “Company Profiles” section in the report covers key facts, business description, products & services, financial information, SWOT analysis, and key developments. The financial information presented is extracted from the annual reports and official documents of the publicly listed companies. Upon collecting the information for the sections of respective companies, we verify them via various primary sources and then compile the data in respective company profiles. The company level information helps us in deriving the base number as well as in forecasting the market size.
- Developing Base Number:
Aggregation of sales statistics (2020-2022) and macro-economic factor, and other secondary and primary research insights are utilized to arrive at base number and related market shares for 2022. The data gaps are identified in this step and relevant market data is analyzed, collected from paid primary interviews or databases. On finalizing the base year market size, forecasts are developed on the basis of macro-economic, industry and market growth factors and company level analysis.
- Data Triangulation and Final Review:
The market findings and base year market size calculations are validated from supply as well as demand side. Demand side validations are based on macro-economic factor analysis and benchmarks for respective regions and countries. In case of supply side validations, revenues of major companies are estimated (in case not available) based on industry benchmark, approximate number of employees, product portfolio, and primary interviews revenues are gathered. Further revenue from target product/service segment is assessed to avoid overshooting of market statistics. In case of heavy deviations between supply and demand side values, all thes steps are repeated to achieve synchronization.
We follow an iterative model, wherein we share our research findings with Subject Matter Experts (SME’s) and Key Opinion Leaders (KOLs) until consensus view of the market is not formulated – this model negates any drastic deviation in the opinions of experts. Only validated and universally acceptable research findings are quoted in our reports.
We have important check points that we use to validate our research findings – which we call – data triangulation, where we validate the information, we generate from secondary sources with primary interviews and then we re-validate with our internal data bases and Subject matter experts. This comprehensive model enables us to deliver high quality, reliable data in shortest possible time.

 احصل على عينة مجانية لهذا التقرير