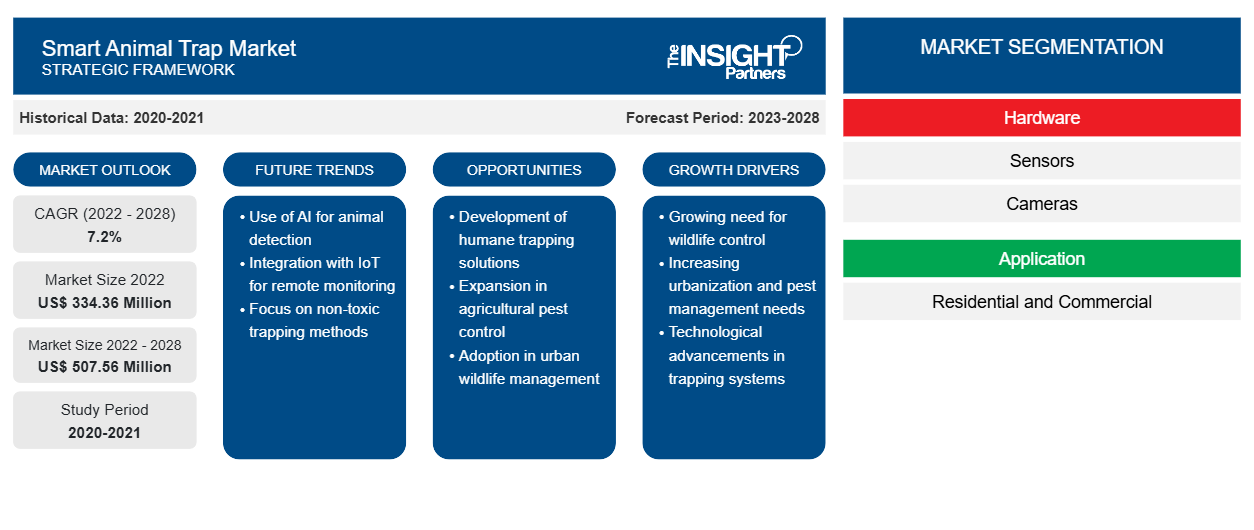
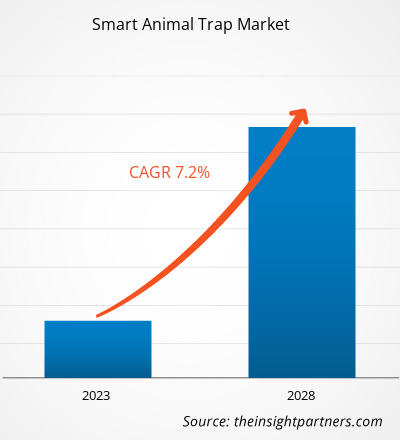
من المتوقع أن ينمو سوق مصائد الحيوانات الذكية من 334.36 مليون دولار أمريكي في عام 2022 إلى 507.56 مليون دولار أمريكي بحلول عام 2028. ومن المتوقع أن ينمو بمعدل نمو سنوي مركب قدره 7.2٪ من عام 2022 إلى عام 2028.
يمكن للخنازير البرية والغزلان والراكون والحيوانات الأخرى تدمير المحاصيل، ومثل هذا الضرر الناجم عن الحياة البرية يثبط عزيمة المزارعين. تهدف مصائد الحيوانات الذكية إلى تمكين المستخدمين النهائيين من اصطياد الحيوانات عن بعد لأسباب مختلفة، مثل الغذاء وتجارة الفراء والصيد ومكافحة الآفات وإدارة الحياة البرية. تتيح أجهزة الاستشعار المدمجة في هذه الأنظمة لها اكتشاف اصطياد حيوان خطير. ثم تنبه الأنظمة المسؤولين عن بعد عبر نظام تحديد المواقع العالمي (GPS) والاتصال اللاسلكي. يمكن رسم حالة جميع المصائد المثبتة في منطقة ما وإظهارها على خريطة، ويمكن إخطار عناوين البريد الإلكتروني المسجلة بهذه الحالة. تمكن التكنولوجيا الصيادين من السفر مباشرة إلى المواقع التي تم فيها اصطياد الحيوانات الخطرة.
وعلاوة على ذلك، ووفقًا لتوجيهات الاتحاد الأوروبي بشأن الموائل والطيور، فرضت دول الاتحاد الأوروبي قواعد صارمة للحفاظ على مواقع التكاثر والراحة الرئيسية للعديد من الأنواع، وخاصة النادرة والمهددة بالانقراض، ضمن شبكة Natura 2000. كما أنشأت مناطق لحماية العينات الفردية جسديًا في جميع أنحاء الدول الأعضاء السبع والعشرين في الاتحاد الأوروبي. كما يضع الاتحاد الأوروبي إرشادات لرعاية الحيوانات ويتعاون مع دول أخرى لمنع تجارة الحياة البرية غير المشروعة في جميع أنحاء العالم. لذلك، أصبح من الضروري أن يراقب حراس الحياة البرية هذه الحيوانات بشكل صحيح، مما يعزز الطلب على مصائد الحيوانات الذكية في أوروبا.
يوجد في أوروبا 504 حديقة وطنية. مع 48 حديقة بإجمالي مساحة 141200 كيلومتر مربع، تمتلك روسيا أكبر عدد من المتنزهات الوطنية في المنطقة. تليها فنلندا والسويد والنرويج وتركيا وفرنسا بـ 40 و30 و47 و43 و30 حديقة وطنية على التوالي. علاوة على ذلك، تمتلك فرنسا ثاني أكبر مساحة إجمالية تغطيها المتنزهات الوطنية. تحتل المتنزهات الوطنية العشر في فرنسا مساحة 60728 كيلومترًا مربعًا. تحافظ المتنزهات الوطنية على 9.5% من إجمالي مساحة الأراضي في فرنسا، وهي ثاني أكبر مساحة بعد أيسلندا (12.1%) من حيث النسبة المئوية. مع هذه المساحات الشاسعة، يحتاج حراس المتنزهات إلى مراقبة صحة الحيوانات لمواكبة أعداد السياح المتزايدة، مما يعزز نمو سوق مصائد الحيوانات الذكية .
قم بتخصيص هذا التقرير ليناسب متطلباتك
ستحصل على تخصيص لأي تقرير - مجانًا - بما في ذلك أجزاء من هذا التقرير، أو تحليل على مستوى الدولة، وحزمة بيانات Excel، بالإضافة إلى الاستفادة من العروض والخصومات الرائعة للشركات الناشئة والجامعات
- احصل على أهم اتجاهات السوق الرئيسية لهذا التقرير.ستتضمن هذه العينة المجانية تحليلاً للبيانات، بدءًا من اتجاهات السوق وحتى التقديرات والتوقعات.
- سوق مصائد الحيوانات الذكية
تأثير جائحة كوفيد-19 على سوق مصائد الحيوانات الذكية
تمتلك الهند والصين واليابان العديد من المرافق الإلكترونية والمستخدمين النهائيين لسوق مصائد الحيوانات الذكية. في أواخر عام 2021، وعلى الرغم من ارتفاع حالات الإصابة بفيروس كوفيد-19، خففت هذه البلدان من معايير الاحتواء. ومع ارتفاع حالات الإصابة بفيروس كوفيد-19 في الصين، كانت بعض المصانع لا تزال تعمل ولكنها لم تتمكن من تلبية الطلب. ووفقًا لمنظمة التعاون الاقتصادي والتنمية، فقد أثر الوباء بشدة على دول مثل الهند وأستراليا والصين واليابان. وكانت الهند الدولة الأكثر تضررًا من الوباء في هذه المنطقة. أثرت القيود التي فرضتها الحكومات للسيطرة على انتشار فيروس كوفيد-19 خلال المراحل الزمنية الأولية للأزمة على عملية الإنتاج في هذه البلدان بسبب القوى العاملة المحدودة، مما أعاق نمو سوق مصائد الحيوانات الذكية في عام 2020.
رؤى السوق - سوق مصيدة الحيوانات الذكية
استحوذت أمريكا الشمالية على أكبر حصة في سوق مصائد الحيوانات الذكية. الطلب المتزايد على حيوانات الماشية، والاستيعاب السريع للحيوانات الأليفة مع نمو الدخل المتاح، وارتفاع منتجات رعاية الحيوانات الأليفة ، والانتشار المتزايد لأمراض الحيوانات هي العوامل التي تدعم توسع سوق مصائد الحيوانات الذكية في هذه المنطقة. وقد لوحظت زيادة كبيرة في تبني الحيوانات الأليفة في السنوات الأخيرة، وخاصة بعد تفشي فيروس كورونا المستجد في كندا. يعتمد نموذج أمريكا الشمالية للحفاظ على الحياة البرية على سبعة مبادئ أساسية تدعم فكرة أن الحياة البرية هي أمانة عامة وحق طبيعي للناس، ويجب إدارة أنواع الحياة البرية حتى تظل أعدادها مستدامة إلى الأبد. مثل هذه المجتمعات القوية للحياة البرية هي المولدات الرئيسية للطلب على مصائد الحيوانات الذكية في جميع أنحاء المنطقة.
كان قانون استعادة الحياة البرية في أميركا، المعروف أيضاً باسم RAWA، أحد أهم الاستثمارات التي قامت بها الحكومات العالمية في مجال الحفاظ على الحياة البرية. ويهدف مشروع القانون الذي تبلغ قيمته 1.397 مليار دولار أميركي إلى تمويل المبادرات الإقليمية والوطنية لمساعدة الحياة البرية المحتاجة ومنع انقراضها. كما سيساعد في استعادة الأنواع المهددة بالانقراض بالفعل. ووفقاً لهذا، تقدم الشركات في جميع أنحاء البلاد مجموعة واسعة من مصائد الحيوانات الذكية. على سبيل المثال، تستخدم TrapSmar تكنولوجيا الاتصالات الحديثة بنظام تحديد المواقع العالمي (GPS) لتقديم حل بسيط ورحيم وعملي لمراقبة مصائد الحياة البرية عن بعد. وتوفر قنوات الاتصال الثلاث الخاصة بها تغطية في أي مكان تقريباً في العالم.
نظرة إقليمية على سوق مصائد الحيوانات الذكية
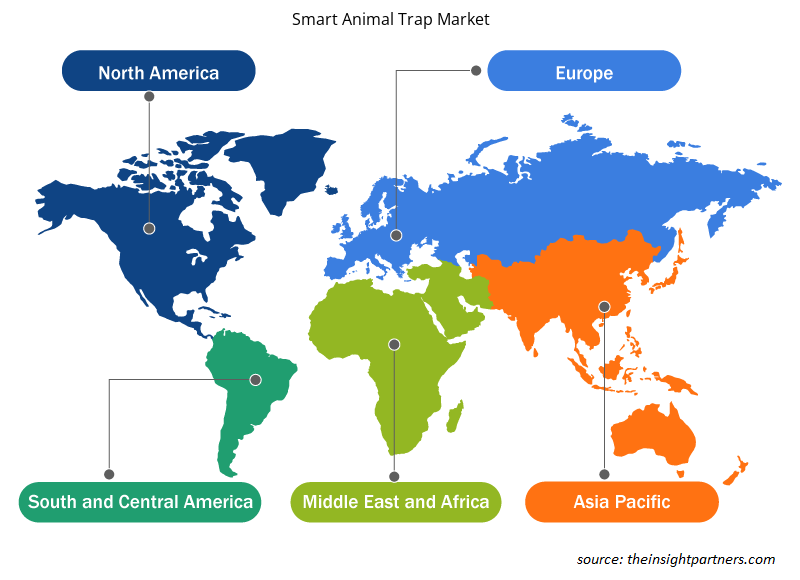
لقد قام المحللون في Insight Partners بشرح الاتجاهات والعوامل الإقليمية المؤثرة على سوق مصائد الحيوانات الذكية طوال فترة التوقعات بشكل شامل. يناقش هذا القسم أيضًا قطاعات سوق مصائد الحيوانات الذكية والجغرافيا في جميع أنحاء أمريكا الشمالية وأوروبا ومنطقة آسيا والمحيط الهادئ والشرق الأوسط وأفريقيا وأمريكا الجنوبية والوسطى.

- احصل على البيانات الإقليمية المحددة لسوق مصائد الحيوانات الذكية
نطاق تقرير سوق مصيدة الحيوانات الذكية
| سمة التقرير | تفاصيل |
|---|---|
| حجم السوق في عام 2022 | 334.36 مليون دولار أمريكي |
| حجم السوق بحلول عام 2028 | 507.56 مليون دولار أمريكي |
| معدل النمو السنوي المركب العالمي (2022 - 2028) | 7.2% |
| البيانات التاريخية | 2020-2021 |
| فترة التنبؤ | 2023-2028 |
| القطاعات المغطاة | حسب الأجهزة
|
| المناطق والدول المغطاة | أمريكا الشمالية
|
| قادة السوق وملفات تعريف الشركات الرئيسية |
|
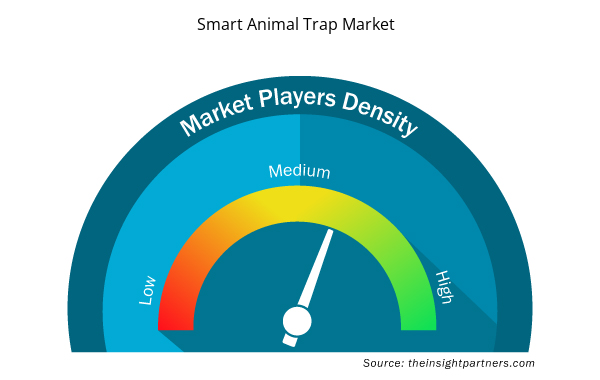
كثافة اللاعبين في سوق مصائد الحيوانات الذكية: فهم تأثيرها على ديناميكيات الأعمال
يشهد سوق مصائد الحيوانات الذكية نموًا سريعًا، مدفوعًا بالطلب المتزايد من المستخدم النهائي بسبب عوامل مثل تفضيلات المستهلك المتطورة والتقدم التكنولوجي والوعي المتزايد بفوائد المنتج. ومع ارتفاع الطلب، تعمل الشركات على توسيع عروضها والابتكار لتلبية احتياجات المستهلكين والاستفادة من الاتجاهات الناشئة، مما يؤدي إلى زيادة نمو السوق.
تشير كثافة اللاعبين في السوق إلى توزيع الشركات أو المؤسسات العاملة في سوق أو صناعة معينة. وهي تشير إلى عدد المنافسين (اللاعبين في السوق) الموجودين في مساحة سوق معينة نسبة إلى حجمها أو قيمتها السوقية الإجمالية.
الشركات الرئيسية العاملة في سوق مصائد الحيوانات الذكية هي:
- تراب ماستر
- شركة AlertHouse ApS (شرطة مينك)
- مدير المراجعة
- ويلدميلدر
- سكاي هوك
إخلاء المسؤولية : الشركات المذكورة أعلاه ليست مرتبة بأي ترتيب معين.

- احصل على نظرة عامة على أهم اللاعبين الرئيسيين في سوق مصائد الحيوانات الذكية
رؤى مبنية على المكونات
استنادًا إلى المكون، يتم تقسيم تقرير سوق مصائد الحيوانات الذكية إلى أجهزة وبرامج وخدمات. تتكون مصائد الحيوانات الذكية من مكونات أجهزة تتكون من أجهزة استشعار وأجهزة تعقب مختلفة. يعمل البرنامج كحلقة وصل بين الأجهزة والمستخدم النهائي، مما يوفر واجهة مستخدم للتفاعل مع الأجهزة. تعتمد الخدمات بالكامل على متطلبات المستخدم وتكوين الأجهزة والبرامج لمقدمي الخدمة.
الشركات التي تم عرضها في دراسة سوق مصائد الحيوانات الذكية هي Alert House ApS و CatchAlive ApS و Encounter Solutions Ltd. و Econode Ltd. و Wildlife Dominion Management LLC. (HogEye) و PestSense Pty Ltd Animal Trap Solutions و Skyhawk و TrapSmart tm LLP. و uWatch Ltd. و Fallenmelder TRAPMASTER و TFK Handels GmbH و WildMelder و Triotos و BOARMASTER. بالإضافة إلى هؤلاء اللاعبين الأربعة عشر، تم أيضًا تحليل العديد من الشركات العالمية والإقليمية البارزة واللاعبين الناشئين ومخربي السوق واللاعبين في السوق المتخصصة أثناء دراسة سوق مصائد الحيوانات الذكية.
يتبنى اللاعبون في سوق مصائد الحيوانات الذكية بشكل أساسي استراتيجية مبادرات السوق التي تنطوي على توسيع نطاق انتشارها في جميع أنحاء العالم وتلبية الطلب المتزايد من العملاء. يركز اللاعبون في سوق مصائد الحيوانات الذكية بشكل أساسي على تحسين المنتجات والخدمات من خلال دمج الميزات والتقنيات المتقدمة في عروضهم.
- ستشارك شركة Skyhawk في مؤتمر GPCA الصيفي في The Cloister at Sea Island، GA، من 11 يوليو 2022 إلى 14 يوليو 2022. شاركت الشركة في Texas Pest Control Expo، الذي أقيم في مركز مؤتمرات فورت وورث، تكساس، من 21 يونيو 2022 إلى 23 يونيو 2022.
- التحليل التاريخي (سنتان)، السنة الأساسية، التوقعات (7 سنوات) مع معدل النمو السنوي المركب
- تحليل PEST و SWOT
- حجم السوق والقيمة / الحجم - عالميًا وإقليميًا وقطريًا
- الصناعة والمنافسة
- مجموعة بيانات Excel


Report Coverage
Revenue forecast, Company Analysis, Industry landscape, Growth factors, and Trends

Segment Covered
This text is related
to segments covered.

Regional Scope
North America, Europe, Asia Pacific, Middle East & Africa, South & Central America

Country Scope
This text is related
to country scope.
الأسئلة الشائعة
By 2028, the global market size of smart animal trap market will be USD 507.56 Million.
US, Germany, China, UAE, Brazil are registering a high growth rate during the forecast period.
The commercial segment led the smart animal trap market with a market share of 66.9% in 2021. Commercial users of smart animal traps are governments, national park management authorities, large agriculturists, and food-based multinational corporations.
US holds the major market share of smart animal trap market in 2022.
Integration of advanced connectivity and computing technologies to propel the market growth during the forecast period.
Trapmaster.; AlertHouse ApS (Minkpolice); Revier Manager; Wildmelder; and Skyhawk are the five key market players operating in the global smart animal trap market.
Rise in human wildlife conflicts and rapid increase in population of several wildlife species are major driving factors contributing towards the growth of smart animal trap market.
The global smart animal trap market was valued USD 318.47 million in 2021.
Trends and growth analysis reports related to Electronics and Semiconductor : READ MORE..
The List of Companies - Smart Animal Trap Market
- Trapmaster
- AlertHouse ApS (Minkpolice)
- Revier Manager
- Wildmelder
- Skyhawk
- CatchAlive ApS
- Encounter Solutions Ltd.
- Econode Ltd.
- Wildlife Dominion Management LLC. (HogEye)
- PestSense Pty Ltd Animal Trap Solutions
- TrapSmart tm LLp
- uWatch Ltd.
- Fallenmeder TRAPMASTER
- Tritos
- Boarmaster
The Insight Partners performs research in 4 major stages: Data Collection & Secondary Research, Primary Research, Data Analysis and Data Triangulation & Final Review.
- Data Collection and Secondary Research:
As a market research and consulting firm operating from a decade, we have published and advised several client across the globe. First step for any study will start with an assessment of currently available data and insights from existing reports. Further, historical and current market information is collected from Investor Presentations, Annual Reports, SEC Filings, etc., and other information related to company’s performance and market positioning are gathered from Paid Databases (Factiva, Hoovers, and Reuters) and various other publications available in public domain.
Several associations trade associates, technical forums, institutes, societies and organization are accessed to gain technical as well as market related insights through their publications such as research papers, blogs and press releases related to the studies are referred to get cues about the market. Further, white papers, journals, magazines, and other news articles published in last 3 years are scrutinized and analyzed to understand the current market trends.
- Primary Research:
The primarily interview analysis comprise of data obtained from industry participants interview and answers to survey questions gathered by in-house primary team.
For primary research, interviews are conducted with industry experts/CEOs/Marketing Managers/VPs/Subject Matter Experts from both demand and supply side to get a 360-degree view of the market. The primary team conducts several interviews based on the complexity of the markets to understand the various market trends and dynamics which makes research more credible and precise.
A typical research interview fulfils the following functions:
- Provides first-hand information on the market size, market trends, growth trends, competitive landscape, and outlook
- Validates and strengthens in-house secondary research findings
- Develops the analysis team’s expertise and market understanding
Primary research involves email interactions and telephone interviews for each market, category, segment, and sub-segment across geographies. The participants who typically take part in such a process include, but are not limited to:
- Industry participants: VPs, business development managers, market intelligence managers and national sales managers
- Outside experts: Valuation experts, research analysts and key opinion leaders specializing in the electronics and semiconductor industry.
Below is the breakup of our primary respondents by company, designation, and region:

Once we receive the confirmation from primary research sources or primary respondents, we finalize the base year market estimation and forecast the data as per the macroeconomic and microeconomic factors assessed during data collection.
- Data Analysis:
Once data is validated through both secondary as well as primary respondents, we finalize the market estimations by hypothesis formulation and factor analysis at regional and country level.
- Macro-Economic Factor Analysis:
We analyse macroeconomic indicators such the gross domestic product (GDP), increase in the demand for goods and services across industries, technological advancement, regional economic growth, governmental policies, the influence of COVID-19, PEST analysis, and other aspects. This analysis aids in setting benchmarks for various nations/regions and approximating market splits. Additionally, the general trend of the aforementioned components aid in determining the market's development possibilities.
- Country Level Data:
Various factors that are especially aligned to the country are taken into account to determine the market size for a certain area and country, including the presence of vendors, such as headquarters and offices, the country's GDP, demand patterns, and industry growth. To comprehend the market dynamics for the nation, a number of growth variables, inhibitors, application areas, and current market trends are researched. The aforementioned elements aid in determining the country's overall market's growth potential.
- Company Profile:
The “Table of Contents” is formulated by listing and analyzing more than 25 - 30 companies operating in the market ecosystem across geographies. However, we profile only 10 companies as a standard practice in our syndicate reports. These 10 companies comprise leading, emerging, and regional players. Nonetheless, our analysis is not restricted to the 10 listed companies, we also analyze other companies present in the market to develop a holistic view and understand the prevailing trends. The “Company Profiles” section in the report covers key facts, business description, products & services, financial information, SWOT analysis, and key developments. The financial information presented is extracted from the annual reports and official documents of the publicly listed companies. Upon collecting the information for the sections of respective companies, we verify them via various primary sources and then compile the data in respective company profiles. The company level information helps us in deriving the base number as well as in forecasting the market size.
- Developing Base Number:
Aggregation of sales statistics (2020-2022) and macro-economic factor, and other secondary and primary research insights are utilized to arrive at base number and related market shares for 2022. The data gaps are identified in this step and relevant market data is analyzed, collected from paid primary interviews or databases. On finalizing the base year market size, forecasts are developed on the basis of macro-economic, industry and market growth factors and company level analysis.
- Data Triangulation and Final Review:
The market findings and base year market size calculations are validated from supply as well as demand side. Demand side validations are based on macro-economic factor analysis and benchmarks for respective regions and countries. In case of supply side validations, revenues of major companies are estimated (in case not available) based on industry benchmark, approximate number of employees, product portfolio, and primary interviews revenues are gathered. Further revenue from target product/service segment is assessed to avoid overshooting of market statistics. In case of heavy deviations between supply and demand side values, all thes steps are repeated to achieve synchronization.
We follow an iterative model, wherein we share our research findings with Subject Matter Experts (SME’s) and Key Opinion Leaders (KOLs) until consensus view of the market is not formulated – this model negates any drastic deviation in the opinions of experts. Only validated and universally acceptable research findings are quoted in our reports.
We have important check points that we use to validate our research findings – which we call – data triangulation, where we validate the information, we generate from secondary sources with primary interviews and then we re-validate with our internal data bases and Subject matter experts. This comprehensive model enables us to deliver high quality, reliable data in shortest possible time.


 احصل على عينة مجانية لهذا التقرير