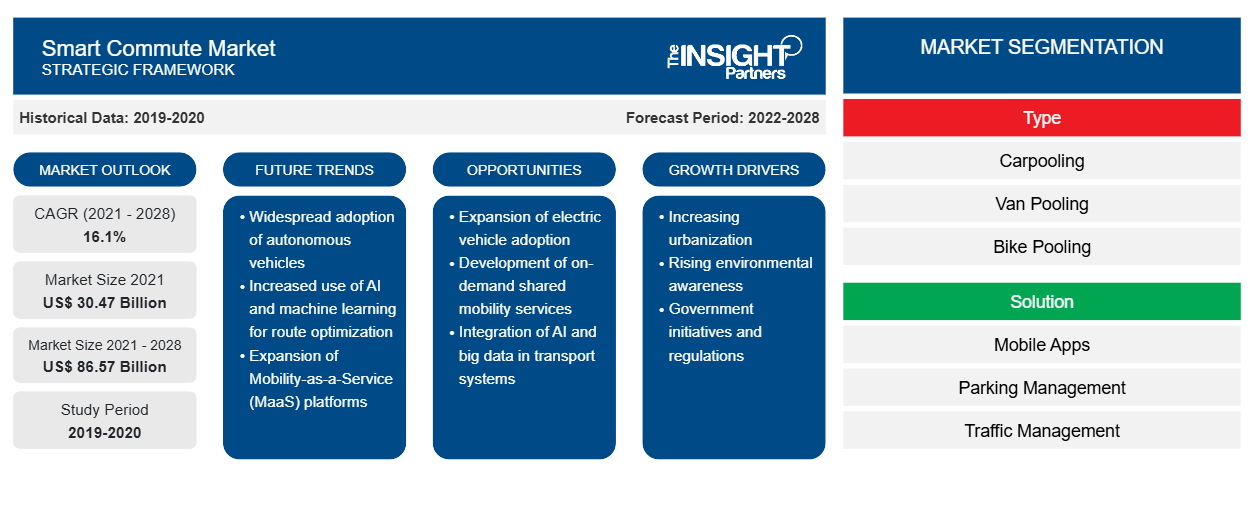
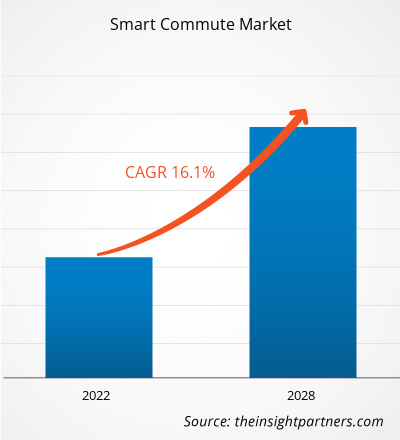
من المتوقع أن ينمو سوق التنقل الذكي من 30,469.49 مليون دولار أمريكي في عام 2021 إلى 86,568.73 مليون دولار أمريكي بحلول عام 2028؛ ومن المتوقع أن ينمو بمعدل نمو سنوي مركب قدره 16.1٪ من عام 2021 إلى عام 2028.
يُعرَّف التنقل الذكي بأنه السفر بانتظام عبر مشاركة السيارات أو مشاركة الشاحنات أو ركوب الدراجات أو الدراجات الهوائية أو ركوب المترو. وقد طورت شركات النقل العام والحكومات وأصحاب المصلحة الآخرون استراتيجية كاملة تأخذ في الاعتبار السفر الذكي وتشاركها مع الجمهور لبناء وسائل نقل أكثر قوة في المناطق الحضرية. يؤثر التنقل الذكي بشكل إيجابي على البيئة من خلال تقليل الازدحام المروري والحد من انبعاثات الغازات المسببة للانحباس الحراري العالمي.
تتوفر خيارات التنقل الصديقة للبيئة مثل مشاركة السيارات، ومشاركة الدراجات ، ومشاركة الحافلات الصغيرة ، وغيرها من خيارات التنقل الصديقة للبيئة من خلال خدمات التنقل الذكية. فهي توفر لموظفي المكاتب خيار نقل لاختيار مسار تنقل أكثر فعالية يقلل من الازدحام المروري ونفقات النقل. ومن العوامل التي تعزز نمو سوق التنقل الذكي العدد المتزايد من سكان المدن، مما يؤدي إلى زيادة معدلات الأجيال. وقد اكتسبت خدمات النقل المشتركة قبولاً عالميًا وتشجعها الحكومات والهيئات البيئية لأنها تساعد في تقليل الانبعاثات. كما أنها تسمح بعدد أقل من السيارات الخاصة، وهو ما من المتوقع أن يغذي نمو سوق التنقل الذكي في السنوات القادمة.
في أمريكا الشمالية، تم تعزيز الحاجة إلى التنقل الذكي من خلال التفضيل المتزايد لخدمات مشاركة السيارات بين ركاب المكاتب والتي من شأنها تخفيف الازدحام المروري ومنع الضرر البيئي. علاوة على ذلك، فإن ارتفاع صناعة السياحة والتقدم التكنولوجي والسياسات الحكومية المواتية هي عوامل أخرى تدفع نمو سوق التنقل الذكي في أمريكا الشمالية . في أوروبا، من المتوقع أن يؤدي ارتفاع اتجاه التنقل كخدمة وزيادة قاعدة مستخدمي خدمات مشاركة الرحلات إلى خلق فرص مربحة للاعبين في السوق.
في أوروبا، وبسبب المخاوف المتزايدة بشأن الانحباس الحراري العالمي، والازدحام المروري، والاعتماد على الطاقة الأجنبية، أصبحت المركبات الذكية أكثر شعبية. وقد أدت ممارسة فرض رسوم المرور على السيارات التي تقل راكباً واحداً، والتي فُرضت في عام 2012، إلى زيادة هائلة في استخدام المركبات الذكية للتنقل من قِبَل المستهلكين الأوروبيين.
قم بتخصيص هذا التقرير ليناسب متطلباتك
ستحصل على تخصيص لأي تقرير - مجانًا - بما في ذلك أجزاء من هذا التقرير، أو تحليل على مستوى الدولة، وحزمة بيانات Excel، بالإضافة إلى الاستفادة من العروض والخصومات الرائعة للشركات الناشئة والجامعات
سوق التنقل الذكي:
- احصل على أهم اتجاهات السوق الرئيسية لهذا التقرير.ستتضمن هذه العينة المجانية تحليلاً للبيانات، بدءًا من اتجاهات السوق وحتى التقديرات والتوقعات.
:
تأثير جائحة كوفيد-19 على سوق التنقل الذكي
كان لتفشي فيروس كورونا تأثير كبير على قطاع النقل. فقد انخفض الطلب على خدمات مشاركة السيارات والحافلات الصغيرة على مستوى العالم في عام 2020 بسبب فيروس كورونا. وشهد سوق التنقل الذكي في جميع أنحاء العالم انخفاضًا كبيرًا في توليد الإيرادات في عام 2020 مقارنة بعام 2019، ويرجع ذلك جزئيًا إلى عمليات الإغلاق وإحجام العملاء عن استخدام خدمات مشاركة الرحلات حتى بعد رفع اللوائح. تحاول شركات مشاركة الرحلات دائمًا الحفاظ على ثقة السائق والركاب من حيث السلامة والصرف الصحي.
رؤى السوق – سوق التنقل الذكي
الاتجاه المتزايد نحو التنقل كخدمة
إن الأشخاص غير القادرين على شراء سيارة يمكنهم تجربة السفر السلس من خلال خدمات التنقل. ووفقًا لمكتب إحصاءات النقل، فإن متوسط تكلفة امتلاك وتشغيل مركبة يبلغ حوالي 8858 دولارًا، بافتراض 15000 كيلومتر من القيادة سنويًا. تعمل خدمة التنقل كخدمة على تقليل هذه التكاليف للمستخدم من خلال تعظيم استخدام خدمات النقل مثل مشاركة السيارات وطلب الركوب. كما أنها تقلل من الازدحام المروري والانبعاثات الكلية للسيارات في المدن. ونتيجة لذلك، تعمل خدمة مشاركة السيارات وطلب الركوب المدعومة رقميًا على إدارة متطلبات النقل بكفاءة وتوفر بديلاً ملائمًا وصديقًا للبيئة لملكية السيارات الخاصة. وعلاوة على ذلك، وفقًا للإحصاءات، يعيش 55٪ من سكان العالم حاليًا في المدن، وتشير التقديرات إلى أنه بحلول عام 2050، سيعيش حوالي 68٪ من السكان في المدن. إن الوتيرة السريعة للتحضر تؤدي بالفعل إلى ازدحام مروري. قد يكون مفهوم التنقل كخدمة خيارًا أفضل للحد من الازدحام المروري من خلال الاستفادة بشكل أكبر من البنية التحتية للنقل العام والخاص القائمة. من المتوقع أن يؤدي الطلب العاجل على حلول فعالة للتعامل مع حركة المرور في المدن الذكية بطريقة أسرع وأقل تكلفة وأكثر ملاءمة إلى تعزيز نمو سوق التنقل كخدمة بحلول عام 2028. لذلك، من المتوقع أن يؤدي الاتجاه المتزايد للتنقل كخدمة (MaaS) إلى تعزيز نمو سوق التنقل الذكي العالمي.
رؤى حول سوق التنقل الذكي القائم على النوع
بناءً على النوع، يتم تقسيم سوق التنقل الذكي إلى مشاركة السيارات، ومشاركة الشاحنات، ومشاركة الدراجات، والمترو، وغيرها. ومن المتوقع أن يستحوذ قطاع مشاركة السيارات على حصة كبيرة في سوق التنقل الذكي العالمي، ومن المتوقع أن ينمو بمعدل نمو سنوي مركب مرتفع. يتم تعريف التنقل الذكي على أنه السفر بانتظام من نقطة إلى أخرى عبر مشاركة السيارات، أو مشاركة الشاحنات، أو ركوب الدراجات، أو ركوب الدراجات، أو ركوب المترو.
رؤى السوق حول حلول التنقل الذكي القائمة على الحلول
بناءً على الحل، يتم تقسيم سوق التنقل الذكي إلى تطبيقات الهاتف المحمول وإدارة مواقف السيارات وإدارة المرور وغيرها. ومن المتوقع أن يستحوذ قطاع تطبيقات الهاتف المحمول على حصة كبيرة في سوق التنقل الذكي العالمي، ومن المتوقع أن ينمو بأعلى معدل نمو سنوي مركب. هناك استخدام متزايد لتطبيقات الهاتف المحمول في وضع السفر بالسيارات لتقليل وقت السفر والتكلفة وانبعاثات المركبات.
رؤى السوق حول التنقل الذكي المستند إلى المستخدم النهائي
بناءً على المستخدم النهائي، ينقسم سوق التنقل الذكي إلى قطاع شخصي وقطاع مؤسساتي. ومن المتوقع أن يستحوذ قطاع المؤسساتي على حصة كبيرة في سوق التنقل الذكي العالمي، ومن المتوقع أن ينمو بمعدل نمو سنوي مركب أعلى.
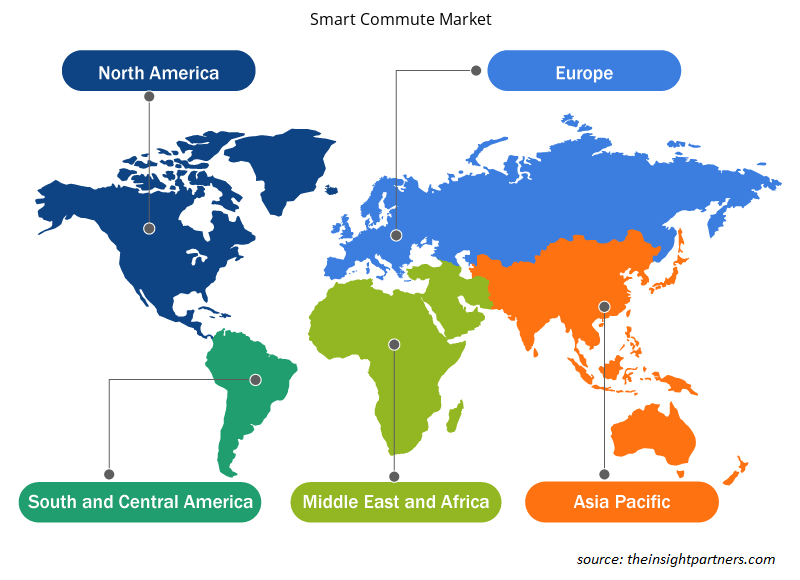
رؤى إقليمية حول سوق التنقل الذكي
لقد قام المحللون في Insight Partners بشرح الاتجاهات والعوامل الإقليمية المؤثرة على سوق التنقل الذكي طوال فترة التوقعات بشكل شامل. يناقش هذا القسم أيضًا قطاعات سوق التنقل الذكي والجغرافيا في جميع أنحاء أمريكا الشمالية وأوروبا ومنطقة آسيا والمحيط الهادئ والشرق الأوسط وأفريقيا وأمريكا الجنوبية والوسطى.
- احصل على البيانات الإقليمية المحددة لسوق التنقل الذكي
نطاق تقرير سوق التنقل الذكي
| سمة التقرير | تفاصيل |
|---|---|
| حجم السوق في عام 2021 | 30.47 مليار دولار أمريكي |
| حجم السوق بحلول عام 2028 | 86.57 مليار دولار أمريكي |
| معدل النمو السنوي المركب العالمي (2021 - 2028) | 16.1% |
| البيانات التاريخية | 2019-2020 |
| فترة التنبؤ | 2022-2028 |
| القطاعات المغطاة | حسب النوع
|
| المناطق والدول المغطاة | أمريكا الشمالية
|
| قادة السوق وملفات تعريف الشركات الرئيسية |
|
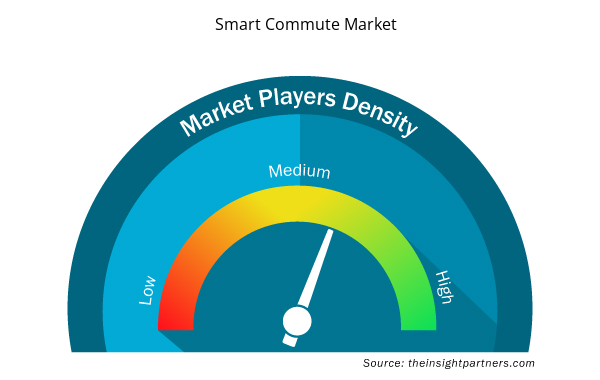
كثافة اللاعبين في سوق التنقل الذكي: فهم تأثيرها على ديناميكيات الأعمال
يشهد سوق التنقل الذكي نموًا سريعًا، مدفوعًا بالطلب المتزايد من المستخدم النهائي بسبب عوامل مثل تفضيلات المستهلكين المتطورة والتقدم التكنولوجي والوعي المتزايد بفوائد المنتج. ومع ارتفاع الطلب، تعمل الشركات على توسيع عروضها والابتكار لتلبية احتياجات المستهلكين والاستفادة من الاتجاهات الناشئة، مما يؤدي إلى زيادة نمو السوق.
تشير كثافة اللاعبين في السوق إلى توزيع الشركات أو المؤسسات العاملة في سوق أو صناعة معينة. وهي تشير إلى عدد المنافسين (اللاعبين في السوق) الموجودين في مساحة سوق معينة نسبة إلى حجمها أو قيمتها السوقية الإجمالية.
الشركات الرئيسية العاملة في سوق التنقل الذكي هي:
- بلابلاكار
- التنقل الذكي
- شركة إنتربرايز القابضة
- شركة إي بولرز للتكنولوجيا المحدودة
- شركة جولدن كونكورد القابضة المحدودة
إخلاء المسؤولية : الشركات المذكورة أعلاه ليست مرتبة بأي ترتيب معين.
- احصل على نظرة عامة على أهم اللاعبين الرئيسيين في سوق التنقل الذكي
يركز اللاعبون العاملون في سوق التنقل الذكي بشكل أساسي على تطوير المنتجات المتقدمة والفعالة.
- في يناير 2022، تعتزم شركة توموك، وهي شركة متخصصة في التنقل المتعدد الوسائط، توسيع عملياتها إلى عشر مدن أخرى بحلول عام 2022، بما في ذلك دلهي ومومباي.
- في أبريل 2021، قامت شركة متخصصة في التنقل في المدينة ببناء منصة تطبيقات تدمج الطرق مع الأسعار لأول مرة، وتجمع بين الحافلات والمترو وأوبر ويولو وغيرها من خيارات الميل الأخير.
نبذة عن الشركة
:
- بلابلاكار
- التنقل الذكي
- شركة إنتربرايز القابضة
- شركة إي بولرز للتكنولوجيا المحدودة
- شركة جولدن كونكورد القابضة المحدودة
- التنقل الذكي في أوكلاند
- رحلة سريعة
- ترانس هيلب تكنولوجيز المحدودة
- شركة أوبر تكنولوجيز
- التنقل الذكي
- التحليل التاريخي (سنتان)، السنة الأساسية، التوقعات (7 سنوات) مع معدل النمو السنوي المركب
- تحليل PEST و SWOT
- حجم السوق والقيمة / الحجم - عالميًا وإقليميًا وقطريًا
- الصناعة والمنافسة
- مجموعة بيانات Excel


- Virtual Pipeline Systems Market
- Hydrogen Compressors Market
- Public Key Infrastructure Market
- Virtual Production Market
- Lyophilization Services for Biopharmaceuticals Market
- Airline Ancillary Services Market
- Dealer Management System Market
- Data Center Cooling Market
- Electronic Shelf Label Market
- Europe Tortilla Market

Report Coverage
Revenue forecast, Company Analysis, Industry landscape, Growth factors, and Trends

Segment Covered
This text is related
to segments covered.

Regional Scope
North America, Europe, Asia Pacific, Middle East & Africa, South & Central America

Country Scope
This text is related
to country scope.
الأسئلة الشائعة
Based on type, the global Smart Commute market is segmented into carpooling, van pooling, bike pooling, metro, and others. The Smart Commute market was dominated by the carpooling segment in 2020.
North America dominated the Smart Commute market in 2020 with a share of 43.9%. Asia Pacific is expected to grow at a fastest CAGR accounting for 40.0% share by 2028, followed by Europe.
The major companies in Smart Commute market are Enterprise Holdings, Inc.; BlaBlaCar; CommuteSmart; ePoolers Technologies Pvt. Ltd.; Smart Commute; Oakland Smart Commute; Quick Ride; Tummoc (Transhelp Technologies Pvt. Ltd.); Uber Technologies, Inc.; and GCL Smart Commute Co., Ltd.
The major end user in Smart Commute includes personal, and enterprises. In terms of market share, the market was dominated by the enterprises segment in 2020.
IoT devices can be used to make daily commutes more enjoyable. These technologies also help reduce overall transport costs while being environmentally beneficial. The best IoT option for the last-mile journey could be connected bicycles. Citizens have already begun to benefit from combined bike-sharing possibilities provided by market players. Users may keep track of bike availability, usage, and trip details. The only stumbling block for linked bike-sharing programs is integrating them into today's traffic. Governments must ensure that designated bike lanes exist to maintain a smooth traffic flow. In some areas, connected electric scooters are also available for rent. Some firms even offer complimentary helmets to electric scooter riders for a minimal shipping fee. By providing alternate commute options, these businesses contribute to a better future for our world. Apps for taxi commuting are already widespread among today's youth. Rather than driving their car, many commuters use taxi services such as Uber and Lyft. This is a more cost-effective and environmentally responsible solution than single-user rides. These businesses have access to a wealth of data that may be monitored and studied to improve cab-sharing services. Unlike most public transit, they can function similarly to public transportation, but they can provide a comprehensive commute option.
The key element driving the expansion of smart commutes is a rapid increase in the adoption of carpool and bike pool services among regular office commuters. Prominent market players such as Uber and Ola offer convenient pick-up and drop-off services, attracting consumers to use ride-sharing services. Furthermore, services such as short-distance travel, intercity ride-sharing, bus-sharing, bike-sharing, and auto-sharing are available, which stimulates the expansion of smart commute demand. Many prominent Indian corporations proactively push employees to use carpool and bike pool services. Organizations with large workforces, such as Infosys, Capgemini, Cognizant, HCL, Amazon, Flipkart, Siemens, L&T, Biocon, and HDFC Bank, as well as several smaller businesses, are launching awareness campaigns and digital platforms to help employees better plan their commutes. Moreover, organizations are rewarding top carpoolers to keep employees engaged and motivated to reduce carbon emissions and traffic jams across cities. New York, Seoul, and Shanghai are among the top 10 cities with the highest carbon footprint. Governments and businesses are encouraging carpooling to commute in cities to reduce emissions. Countries have established specific targets for reducing carbon footprints by 2030 as part of the Paris climate agreement. In Delhi, India, the government implemented an odd-even strategy to control traffic density and reduce carbon emissions in the city.
The List of Companies - Smart Commute Market
- BlaBlaCar
- CommuteSmart
- Enterprise Holdings Inc
- ePoolers Technologies Pvt. Ltd
- Golden Concord Holdings Limited
- Oakland Smart Commute
- Quick Ride
- Transhelp Technologies Pvt Ltd
- Uber Technologies Inc.
- Smart Commute
The Insight Partners performs research in 4 major stages: Data Collection & Secondary Research, Primary Research, Data Analysis and Data Triangulation & Final Review.
- Data Collection and Secondary Research:
As a market research and consulting firm operating from a decade, we have published and advised several client across the globe. First step for any study will start with an assessment of currently available data and insights from existing reports. Further, historical and current market information is collected from Investor Presentations, Annual Reports, SEC Filings, etc., and other information related to company’s performance and market positioning are gathered from Paid Databases (Factiva, Hoovers, and Reuters) and various other publications available in public domain.
Several associations trade associates, technical forums, institutes, societies and organization are accessed to gain technical as well as market related insights through their publications such as research papers, blogs and press releases related to the studies are referred to get cues about the market. Further, white papers, journals, magazines, and other news articles published in last 3 years are scrutinized and analyzed to understand the current market trends.
- Primary Research:
The primarily interview analysis comprise of data obtained from industry participants interview and answers to survey questions gathered by in-house primary team.
For primary research, interviews are conducted with industry experts/CEOs/Marketing Managers/VPs/Subject Matter Experts from both demand and supply side to get a 360-degree view of the market. The primary team conducts several interviews based on the complexity of the markets to understand the various market trends and dynamics which makes research more credible and precise.
A typical research interview fulfils the following functions:
- Provides first-hand information on the market size, market trends, growth trends, competitive landscape, and outlook
- Validates and strengthens in-house secondary research findings
- Develops the analysis team’s expertise and market understanding
Primary research involves email interactions and telephone interviews for each market, category, segment, and sub-segment across geographies. The participants who typically take part in such a process include, but are not limited to:
- Industry participants: VPs, business development managers, market intelligence managers and national sales managers
- Outside experts: Valuation experts, research analysts and key opinion leaders specializing in the electronics and semiconductor industry.
Below is the breakup of our primary respondents by company, designation, and region:

Once we receive the confirmation from primary research sources or primary respondents, we finalize the base year market estimation and forecast the data as per the macroeconomic and microeconomic factors assessed during data collection.
- Data Analysis:
Once data is validated through both secondary as well as primary respondents, we finalize the market estimations by hypothesis formulation and factor analysis at regional and country level.
- Macro-Economic Factor Analysis:
We analyse macroeconomic indicators such the gross domestic product (GDP), increase in the demand for goods and services across industries, technological advancement, regional economic growth, governmental policies, the influence of COVID-19, PEST analysis, and other aspects. This analysis aids in setting benchmarks for various nations/regions and approximating market splits. Additionally, the general trend of the aforementioned components aid in determining the market's development possibilities.
- Country Level Data:
Various factors that are especially aligned to the country are taken into account to determine the market size for a certain area and country, including the presence of vendors, such as headquarters and offices, the country's GDP, demand patterns, and industry growth. To comprehend the market dynamics for the nation, a number of growth variables, inhibitors, application areas, and current market trends are researched. The aforementioned elements aid in determining the country's overall market's growth potential.
- Company Profile:
The “Table of Contents” is formulated by listing and analyzing more than 25 - 30 companies operating in the market ecosystem across geographies. However, we profile only 10 companies as a standard practice in our syndicate reports. These 10 companies comprise leading, emerging, and regional players. Nonetheless, our analysis is not restricted to the 10 listed companies, we also analyze other companies present in the market to develop a holistic view and understand the prevailing trends. The “Company Profiles” section in the report covers key facts, business description, products & services, financial information, SWOT analysis, and key developments. The financial information presented is extracted from the annual reports and official documents of the publicly listed companies. Upon collecting the information for the sections of respective companies, we verify them via various primary sources and then compile the data in respective company profiles. The company level information helps us in deriving the base number as well as in forecasting the market size.
- Developing Base Number:
Aggregation of sales statistics (2020-2022) and macro-economic factor, and other secondary and primary research insights are utilized to arrive at base number and related market shares for 2022. The data gaps are identified in this step and relevant market data is analyzed, collected from paid primary interviews or databases. On finalizing the base year market size, forecasts are developed on the basis of macro-economic, industry and market growth factors and company level analysis.
- Data Triangulation and Final Review:
The market findings and base year market size calculations are validated from supply as well as demand side. Demand side validations are based on macro-economic factor analysis and benchmarks for respective regions and countries. In case of supply side validations, revenues of major companies are estimated (in case not available) based on industry benchmark, approximate number of employees, product portfolio, and primary interviews revenues are gathered. Further revenue from target product/service segment is assessed to avoid overshooting of market statistics. In case of heavy deviations between supply and demand side values, all thes steps are repeated to achieve synchronization.
We follow an iterative model, wherein we share our research findings with Subject Matter Experts (SME’s) and Key Opinion Leaders (KOLs) until consensus view of the market is not formulated – this model negates any drastic deviation in the opinions of experts. Only validated and universally acceptable research findings are quoted in our reports.
We have important check points that we use to validate our research findings – which we call – data triangulation, where we validate the information, we generate from secondary sources with primary interviews and then we re-validate with our internal data bases and Subject matter experts. This comprehensive model enables us to deliver high quality, reliable data in shortest possible time.
 احصل على عينة مجانية لهذا التقرير