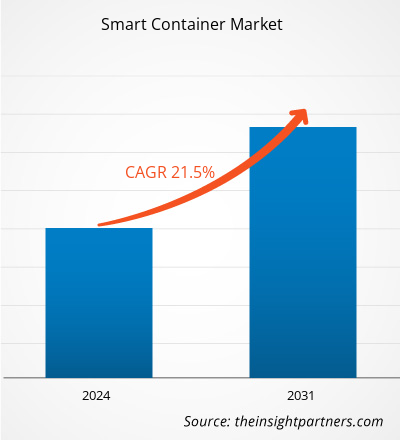
من المتوقع أن يصل حجم سوق الحاويات الذكية إلى 218.4 مليار دولار أمريكي بحلول عام 2031 من 46.05 مليار دولار أمريكي في عام 2023. ومن المتوقع أن يسجل السوق معدل نمو سنوي مركب قدره 21.5٪ في الفترة 2023-2031. ينمو السوق بسبب الطلب المتزايد على الشحن وتتبع البضائع في الوقت الفعلي.
تحليل سوق الحاويات الذكية
ويمكن ربط تكنولوجيا الحاويات الذكية بابتكارات أخرى، مثل البيانات الضخمة، أو سلسلة الكتل، أو خطوط أنابيب البيانات، لتوفير المزيد من الدعم للمجتمع التجاري. ومع ذلك، في جميع هذه الحالات، نرى أن إنشاء معايير واضحة وصريحة لتبادل الرسائل سيسمح لنا بالاستفادة من الإمكانات الكاملة للبيانات المحسنة.
نظرة عامة على سوق الحاويات الذكية
تعني الحاويات الذكية أن خطوط الشحن وأصحاب المصلحة المعنيين بالبضائع يمكنهم الوصول إلى بيانات الحاوية القادمة من المصدر بغض النظر عما إذا كانت الحاوية على متن سفينة أو في ساحة أو في أي نقطة أخرى أثناء رحلة ما قبل النقل وما بعد النقل. تتبنى الحاويات الذكية إنترنت الأشياء (IoT) لتعزيز عملية صنع القرار من قبل مختلف أصحاب المصلحة في القطاع. وهذا يوفر رؤية فائقة للمستثمرين داخل الصفقة وكذلك للهيئات التنظيمية التي تحتاج إلى معلومات شاملة عن الشحنات قبل وصولها إلى حدود.
تخصيص البحث ليناسب متطلباتك
يمكننا تحسين وتخصيص التحليل والنطاق الذي لم يتم تلبيته من خلال عروضنا القياسية. ستساعدك هذه المرونة في الحصول على المعلومات الدقيقة اللازمة لتخطيط أعمالك واتخاذ القرارات.
سوق الحاويات الذكية:

معدل النمو السنوي المركب (2023 - 2031)21.5%- حجم السوق 2023
46.05 مليار دولار أمريكي - حجم السوق 2031
218.4 مليار دولار أمريكي
ديناميات السوق
- تزايد اعتماد التقنيات المتقدمة في خدمة تيسير التجارة
- Blockchain في الخدمات اللوجستية
- تزايد الحاجة إلى التتبع في الوقت الفعلي، والأمان، والرؤية المحسنة
اللاعبين الرئيسيين
- أمبروس
- إي بي مولر - أ/س
- غلوب تراكر، أبس
- هاباغ لويد إيه جي
- نيكسويت ايه جي
- شركة أوربكوم
- تقنيات فيليبس كونيكت
- مجموعة الحاويات الذكية AG
- تراكسينز
- زيليونسورس تكنولوجيز
نظرة عامة إقليمية

- أمريكا الشمالية
- أوروبا
- آسيا والمحيط الهادئ
- أمريكا الجنوبية والوسطى
- الشرق الأوسط وأفريقيا
تجزئة السوق
 عناصر
عناصر- المعدات
- برمجة
- خدمات
 تكنولوجيا
- نظام تحديد المواقع
- الخلوية
- شبكة واسعة النطاق طويلة المدى
- بلوتوث منخفض الطاقة
 الصناعة عمودية
- طعام و مشروبات
- الأدوية
- النفط والغاز
- مواد كيميائية
- آحرون
- يعرض نموذج PDF بنية المحتوى وطبيعة المعلومات من خلال التحليل النوعي والكمي.
برامج التشغيل والفرص في سوق الحاويات الذكية
تزايد اعتماد التقنيات المتقدمة في خدمة تيسير التجارة لصالح السوق
تتيح التقنيات المختلفة للحاويات الذكية توصيل المعلومات التي تم التقاطها من خلال مجموعة واسعة من أجهزة الاستشعار حول حالتها الحالية (على سبيل المثال، موقع GPS، واكتشاف فتح الباب، والاهتزازات والصدمات، والظروف الجوية، وما إلى ذلك) وتغيير إعدادات المعلمات الخاصة بها عن بعد (على سبيل المثال، إعدادات درجة الحرارة، وإزالة الجليد عن بعد، وما إلى ذلك) في أي مكان وفي أي وقت. لقد أثبتت تقنيات إنترنت الأشياء أن هناك إمكانات هائلة للشركات للاستفادة من كفاءتها والتخفيف من مخاطرها. ستصبح الأصول الذكية سمة مشتركة في صناعة الشحن. تنقل الحاويات الذكية كمية كبيرة من البيانات، والتي يمكن تحليلها وتفسيرها، جنبًا إلى جنب مع البيانات الأخرى في النظام المضيف الأساسي، لتوفير تقييمات أكثر صلة. هذه البيانات ليست مفيدة فقط أثناء رحلة حاوية واحدة. وفي سياق الرحلات المتعددة على مدى فترة زمنية طويلة، يمكن أن يوفر رؤية عالمية للعمليات. عند مقارنة متوسط أوقات التسليم أو معدلات الضرر بين الموانئ والساحات المختلفة، يمكن للمرء بناء وتقييم البرامج لرفع جميع أصحاب المصلحة إلى نفس المستوى من التميز في سلسلة التوريد. وبالتالي، فإن الاعتماد المتزايد على التقنيات المتقدمة في خدمة تيسير التجارة يدفع نمو سوق الحاويات الذكية.
تزايد الحاجة إلى التتبع في الوقت الفعلي، والأمان، والرؤية المحسنة.
إحدى أهم مزايا الحاويات الذكية هي القدرة على تسجيل الشحنات في الوقت الفعلي. يتيح التدفق المستمر للبيانات من هذه الحاويات لمقدمي الخدمات اللوجستية والعملاء معرفة الحالة الدقيقة وموقع شحناتهم في أي لحظة. لا تعمل هذه الميزة على تحسين دقة التسليم وتقليل فرص فقدان الشحنات فحسب، بل تسمح أيضًا بحل المشكلات بشكل استباقي، وبالتالي تعزيز خدمة العملاء بشكل كبير. تُحدث الحاويات الذكية أيضًا ثورة في مجال الأمن اللوجستي من خلال تقنيات مثل السياج الجغرافي، والتي يمكن أن تولد تنبيهات إذا انحرفت الحاويات عن مسارها المحدد مسبقًا أو إذا تم اكتشاف وصول غير مصرح به. يعد هذا المستوى من الأمان مهمًا بشكل ملحوظ في نقل البضائع ذات القيمة العالية أو الحساسة ويلعب دورًا حاسمًا في ردع السرقة وتحسين أمان سلسلة التوريد بشكل عام.
تحليل تجزئة تقرير سوق الحاويات الذكية
القطاعات الرئيسية التي ساهمت في اشتقاق تحليل سوق الحاويات الذكية هي المكونات والتكنولوجيا والصناعة الرأسية.
- استنادًا إلى المكونات، يتم تقسيم سوق الحاويات الذكية إلى أجهزة وبرامج وخدمات.
- استنادًا إلى التكنولوجيا، يتم تقسيم سوق الحاويات الذكية إلى نظام تحديد المواقع العالمي (GPS)، والشبكة الخلوية، والشبكة واسعة النطاق طويلة المدى، وتقنية البلوتوث منخفضة الطاقة (BLE)، وغيرها.
- استنادًا إلى قطاع الصناعة، يتم تقسيم سوق الحاويات الذكية إلى الأطعمة والمشروبات والأدوية والنفط والغاز والمواد الكيميائية وغيرها.
تحليل حصة سوق الحاويات الذكية حسب الجغرافيا
ينقسم النطاق الجغرافي لتقرير سوق الحاويات الذكية بشكل أساسي إلى خمس مناطق: أمريكا الشمالية وآسيا والمحيط الهادئ وأوروبا والشرق الأوسط وأفريقيا وأمريكا الجنوبية / أمريكا الجنوبية والوسطى. تعمل الحاويات الذكية على تغيير تجربة العملاء في مجال الخدمات اللوجستية. ويعني التتبع في الوقت الفعلي وتعزيز الرؤية أن العملاء يتم إخطارهم دائمًا بحالة شحناتهم، مما يقلل من عدم اليقين ويحسن الثقة، وهو ما يدفع نمو سوق الحاويات الذكية.
نطاق تقرير سوق الحاويات الذكية
| سمة التقرير | تفاصيل |
|---|---|
| حجم السوق في عام 2023 | 46.05 مليار دولار أمريكي |
| حجم السوق بحلول عام 2031 | 218.4 مليار دولار أمريكي |
| معدل النمو السنوي المركب العالمي (2023 - 2031) | 21.5% |
| البيانات التاريخية | 2021-2022 |
| فترة التنبؤ | 2024-2031 |
| القطاعات المغطاة | بواسطة المكونات
|
| المناطق والبلدان المشمولة | أمريكا الشمالية
|
| قادة السوق وملفات تعريف الشركة الرئيسية |
|
- يعرض نموذج PDF بنية المحتوى وطبيعة المعلومات من خلال التحليل النوعي والكمي.
أخبار سوق الحاويات الذكية والتطورات الأخيرة
يتم تقييم سوق الحاويات الذكية من خلال جمع البيانات النوعية والكمية بعد البحث الأولي والثانوي، والذي يتضمن منشورات الشركات المهمة وبيانات الجمعيات وقواعد البيانات. وفيما يلي قائمة بالتطورات في السوق:
- وفي فبراير 2022، أطلقت شركة النقل الفرنسية CMA CGM حاويات SMART المجهزة بأحدث تقنيات Emerson، والتي تتيح للمستخدمين مراقبة حالة الحاوية وأحوالها في الوقت الفعلي. تلقي البيانات الأساسية مثل الموقع ودرجة الحرارة وتغيرات الغاز.
(المصدر: CMA CGM، موقع الشركة الإلكتروني، 2022)
- في أكتوبر 2023، أعلنت شركة Tower Cold Chain عن سلسلة من المبادرات الجديدة لـ KTEvolution، وهو حل "الصندوق الصغير" الخاص بها للتوصيل المباشر إلى المريض وشحن العينات وتسليم الميل الأخير. ومن بين العروض الجديدة خدمة "انقر واستلم" لشركات الطيران وشركات الأدوية وشركات النقل الثالث التي تستأجر الحاويات بالإضافة إلى خيار الشراء والتخصيص.
(المصدر: سلسلة تبريد البرج، موقع الشركة الإلكتروني، 2022)
تغطية تقرير سوق الحاويات الذكية والتسليمات
يقدم تقرير "حجم سوق الحاويات الذكية وتوقعاته (2021-2031)" تحليلاً مفصلاً للسوق يغطي المجالات التالية:
- حجم السوق والتوقعات على المستويات العالمية والإقليمية والقطرية لجميع قطاعات السوق الرئيسية التي يغطيها النطاق
- ديناميكيات السوق مثل السائقين والقيود والفرص الرئيسية
- الاتجاهات المستقبلية الرئيسية
- القوى الخمس التفصيلية لـ PEST/Porter وتحليل SWOT
- تحليل السوق العالمية والإقليمية الذي يغطي اتجاهات السوق الرئيسية واللاعبين الرئيسيين واللوائح وتطورات السوق الأخيرة
- تحليل المشهد الصناعي والمنافسة الذي يغطي تركيز السوق وتحليل الخريطة الحرارية واللاعبين البارزين والتطورات الأخيرة
- ملفات تعريف الشركة التفصيلية
- التحليل التاريخي (سنتان)، السنة الأساسية، التوقعات (7 سنوات) مع معدل النمو السنوي المركب
- تحليل PEST و SWOT
- حجم السوق والقيمة / الحجم - عالميًا وإقليميًا وقطريًا
- الصناعة والمنافسة
- مجموعة بيانات Excel


Report Coverage
Revenue forecast, Company Analysis, Industry landscape, Growth factors, and Trends

Segment Covered
This text is related
to segments covered.

Regional Scope
North America, Europe, Asia Pacific, Middle East & Africa, South & Central America

Country Scope
This text is related
to country scope.
الأسئلة الشائعة
The global smart container market was estimated to be US$ 46.05 billion in 2023 and is expected to grow at a CAGR of 21.5% during the forecast period 2023 - 2031.
The growing adoption of advanced technologies at the service of trade facilitation is the major factors that propel the global smart container market.
Blockchain in logistics play a significant role in the global smart container market in the coming years.
The key players holding the majority of shares in the global smart container market are Ambrosus, A.P. Møller - A/S, Globe Tracker, ApS, Hapag-Lloyd AG, and Nexxoit AG.
The global smart container market is expected to reach US$ 218.4 billion by 2031.
Trends and growth analysis reports related to Electronics and Semiconductor : READ MORE..
The Insight Partners performs research in 4 major stages: Data Collection & Secondary Research, Primary Research, Data Analysis and Data Triangulation & Final Review.
- Data Collection and Secondary Research:
As a market research and consulting firm operating from a decade, we have published and advised several client across the globe. First step for any study will start with an assessment of currently available data and insights from existing reports. Further, historical and current market information is collected from Investor Presentations, Annual Reports, SEC Filings, etc., and other information related to company’s performance and market positioning are gathered from Paid Databases (Factiva, Hoovers, and Reuters) and various other publications available in public domain.
Several associations trade associates, technical forums, institutes, societies and organization are accessed to gain technical as well as market related insights through their publications such as research papers, blogs and press releases related to the studies are referred to get cues about the market. Further, white papers, journals, magazines, and other news articles published in last 3 years are scrutinized and analyzed to understand the current market trends.
- Primary Research:
The primarily interview analysis comprise of data obtained from industry participants interview and answers to survey questions gathered by in-house primary team.
For primary research, interviews are conducted with industry experts/CEOs/Marketing Managers/VPs/Subject Matter Experts from both demand and supply side to get a 360-degree view of the market. The primary team conducts several interviews based on the complexity of the markets to understand the various market trends and dynamics which makes research more credible and precise.
A typical research interview fulfils the following functions:
- Provides first-hand information on the market size, market trends, growth trends, competitive landscape, and outlook
- Validates and strengthens in-house secondary research findings
- Develops the analysis team’s expertise and market understanding
Primary research involves email interactions and telephone interviews for each market, category, segment, and sub-segment across geographies. The participants who typically take part in such a process include, but are not limited to:
- Industry participants: VPs, business development managers, market intelligence managers and national sales managers
- Outside experts: Valuation experts, research analysts and key opinion leaders specializing in the electronics and semiconductor industry.
Below is the breakup of our primary respondents by company, designation, and region:

Once we receive the confirmation from primary research sources or primary respondents, we finalize the base year market estimation and forecast the data as per the macroeconomic and microeconomic factors assessed during data collection.
- Data Analysis:
Once data is validated through both secondary as well as primary respondents, we finalize the market estimations by hypothesis formulation and factor analysis at regional and country level.
- Macro-Economic Factor Analysis:
We analyse macroeconomic indicators such the gross domestic product (GDP), increase in the demand for goods and services across industries, technological advancement, regional economic growth, governmental policies, the influence of COVID-19, PEST analysis, and other aspects. This analysis aids in setting benchmarks for various nations/regions and approximating market splits. Additionally, the general trend of the aforementioned components aid in determining the market's development possibilities.
- Country Level Data:
Various factors that are especially aligned to the country are taken into account to determine the market size for a certain area and country, including the presence of vendors, such as headquarters and offices, the country's GDP, demand patterns, and industry growth. To comprehend the market dynamics for the nation, a number of growth variables, inhibitors, application areas, and current market trends are researched. The aforementioned elements aid in determining the country's overall market's growth potential.
- Company Profile:
The “Table of Contents” is formulated by listing and analyzing more than 25 - 30 companies operating in the market ecosystem across geographies. However, we profile only 10 companies as a standard practice in our syndicate reports. These 10 companies comprise leading, emerging, and regional players. Nonetheless, our analysis is not restricted to the 10 listed companies, we also analyze other companies present in the market to develop a holistic view and understand the prevailing trends. The “Company Profiles” section in the report covers key facts, business description, products & services, financial information, SWOT analysis, and key developments. The financial information presented is extracted from the annual reports and official documents of the publicly listed companies. Upon collecting the information for the sections of respective companies, we verify them via various primary sources and then compile the data in respective company profiles. The company level information helps us in deriving the base number as well as in forecasting the market size.
- Developing Base Number:
Aggregation of sales statistics (2020-2022) and macro-economic factor, and other secondary and primary research insights are utilized to arrive at base number and related market shares for 2022. The data gaps are identified in this step and relevant market data is analyzed, collected from paid primary interviews or databases. On finalizing the base year market size, forecasts are developed on the basis of macro-economic, industry and market growth factors and company level analysis.
- Data Triangulation and Final Review:
The market findings and base year market size calculations are validated from supply as well as demand side. Demand side validations are based on macro-economic factor analysis and benchmarks for respective regions and countries. In case of supply side validations, revenues of major companies are estimated (in case not available) based on industry benchmark, approximate number of employees, product portfolio, and primary interviews revenues are gathered. Further revenue from target product/service segment is assessed to avoid overshooting of market statistics. In case of heavy deviations between supply and demand side values, all thes steps are repeated to achieve synchronization.
We follow an iterative model, wherein we share our research findings with Subject Matter Experts (SME’s) and Key Opinion Leaders (KOLs) until consensus view of the market is not formulated – this model negates any drastic deviation in the opinions of experts. Only validated and universally acceptable research findings are quoted in our reports.
We have important check points that we use to validate our research findings – which we call – data triangulation, where we validate the information, we generate from secondary sources with primary interviews and then we re-validate with our internal data bases and Subject matter experts. This comprehensive model enables us to deliver high quality, reliable data in shortest possible time.
 احصل على عينة مجانية لهذا التقرير