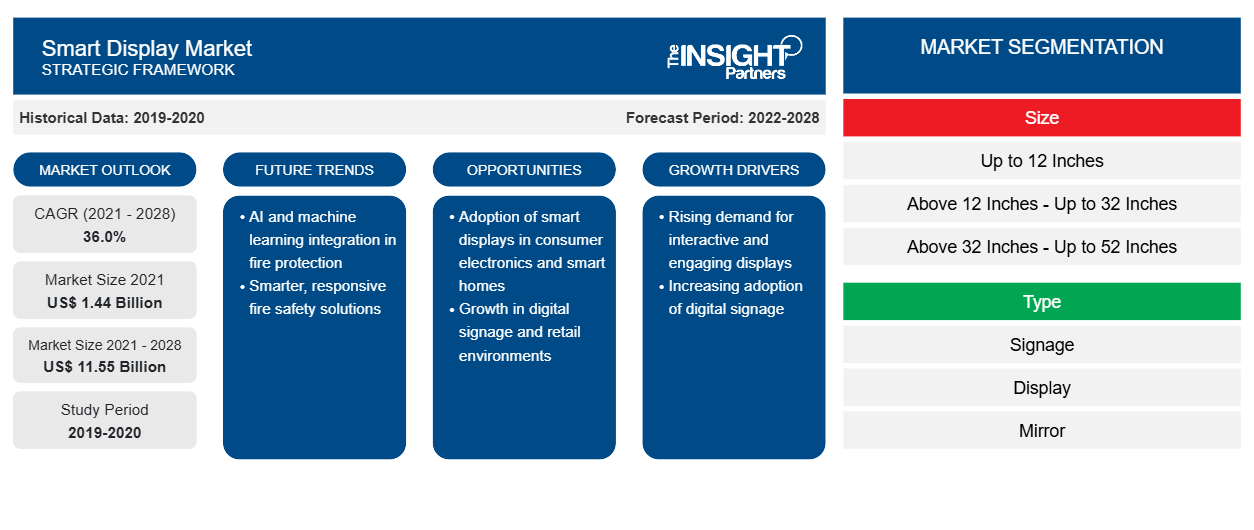
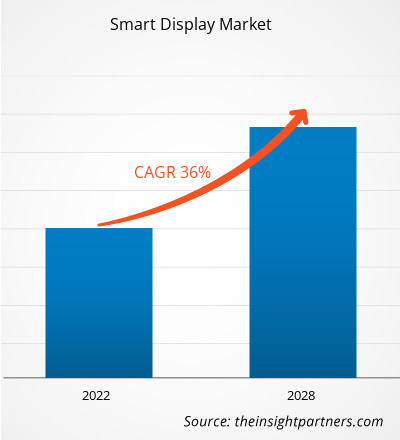
بلغت قيمة سوق الشاشات الذكية 1,443.74 مليون دولار أمريكي في عام 2021، ومن المتوقع أن تصل إلى 11,547.23 مليون دولار أمريكي بحلول عام 2028؛ ومن المتوقع أن تسجل معدل نمو سنوي مركب بنسبة 36.0٪ من عام 2022 إلى عام 2028.
الشاشة الذكية هي شاشة رقمية يمكن تشغيلها باستخدام أجهزة التحكم عن بعد الصوتية أو الأجهزة المتصلة بإنترنت الأشياء. على سبيل المثال، المرآة الذكية هي جهاز مبتكر يسجل المعلومات الشخصية للمستخدمين وتجربة المتسوقين في قطاعي السيارات والتجزئة. علاوة على ذلك، كحل تقني متطور، تتضمن الشاشة الذكية وظائف تحكم تفاعلية ومعقدة.
الطلب العالي على المرايا الذكية من صناعة السيارات، والميزات الجديدة والمبتكرة التي تقدمها المرايا الذكية، والعدد المتزايد من مستخدمي الإنترنت والتبني المتزايد للأجهزة الذكية وفقًا لتفضيلات المستهلكين، والطلب المتزايد على الأجهزة المنزلية الذكية التي تعمل بالذكاء الاصطناعي وإنترنت الأشياء، والاتجاه المتزايد نحو اللافتات التي تدرك السياق، والتبني المتزايد للافتات الذكية في قطاع البيع بالتجزئة هي العوامل الرئيسية الدافعة لنمو سوق العرض الذكي.
تدعم صناعة التجزئة المتنامية زيادة القدرة الشرائية للمستهلكين. كما تعمل مراكز التسوق ومساحات البيع بالتجزئة سريعة التوسع في جميع أنحاء العالم على دفع الطلب على حلول اللافتات الذكية لجذب المارة وتشجيعهم على دخول المتجر. ونتيجة لذلك، تهتم المتاجر الذكية باستخدام الإعلانات البرمجية لزيادة التعرف على العلامة التجارية. يمكن أيضًا استخدام اللافتات الذكية كجزء من عملية الدفع. يمكن للعملاء الدفع باستخدام جهاز محمول بدلاً من الوقوف في طابور للدفع. أنشأت العديد من شركات التجزئة، مثل وول مارت وعلي بابا وأمازون وكارفور، متاجر ذكية في جميع أنحاء العالم. يستخدمون حلول وتقنيات البيع بالتجزئة الذكية المختلفة، مثل اللافتات الذكية، في المتاجر الذكية. نفذ تجار التجزئة في جميع أنحاء العالم استراتيجيات التوسع والشراكة لفتح متاجر أكثر ذكاءً وخالية من أمين الصندوق. كل هذه العوامل تعزز حجم سوق العرض الذكي .
قم بتخصيص هذا التقرير ليناسب متطلباتك
ستحصل على تخصيص لأي تقرير - مجانًا - بما في ذلك أجزاء من هذا التقرير، أو تحليل على مستوى الدولة، وحزمة بيانات Excel، بالإضافة إلى الاستفادة من العروض والخصومات الرائعة للشركات الناشئة والجامعات
- احصل على أهم اتجاهات السوق الرئيسية لهذا التقرير.ستتضمن هذه العينة المجانية تحليلاً للبيانات، بدءًا من اتجاهات السوق وحتى التقديرات والتوقعات.
رؤى حول سوق الشاشات الذكية
وجود العلامات التجارية الشعبية
بمجرد أن يعتاد العملاء على منتج علامة تجارية معينة، فإنهم يشترون منتجات أخرى من نفس العلامة التجارية. تقدم بعض العلامات التجارية المعروفة، مثل Google؛ Amazon, Inc.؛ Bosch؛ Panasonic؛ BenQ Corporation؛ LG Electronics؛ Lenovo Group, Ltd.؛ Samsung Corporation؛ وSony Corporation، حلول شاشات ذكية متنوعة لصناعات السيارات والرعاية الصحية والسكن والتجزئة. تجتذب هذه العلامات التجارية عملائها المخلصين دون عناء وهي عامل دافع رئيسي لنمو سوق الشاشات الذكية. تروج العلامات التجارية أحيانًا لمنتجاتها قبل الإطلاق لخلق ضجة بين العملاء. على سبيل المثال، في مارس 2022، تم إدراج شاشة Xiaomi الذكية 10 على مواقع ويب متعددة، وتم إطلاق المنتج في أبريل 2022. في يناير 2022، أطلقت Google شاشتها الذكية من الجيل الثاني Google Nest Hub في الهند بسعر 103.24 دولارًا أمريكيًا. في يونيو 2021، أطلقت أمازون منتجين جديدين للشاشات الذكية في السوق الهندية؛ Echo show 10 و 5. وبالتالي، فإن الشعبية المتزايدة للعلامات التجارية تدفع نمو سوق الشاشات الذكية.
رؤى السوق المستندة إلى الحجم
بناءً على الحجم، يتم تقسيم سوق شاشات العرض الذكية إلى شاشات تصل إلى 12 بوصة، وشاشات أكبر من 12 بوصة - حتى 32 بوصة، وشاشات أكبر من 32 بوصة - حتى 52 بوصة، وشاشات أكبر من 52 بوصة. وتختلف أحجام الشاشات من شركة مصنعة إلى أخرى. وفي حين تقدم بعض الشركات المصنعة وظائف أعلى حتى في أحجام شاشات أصغر، يفضل البعض الآخر تنويع الوظائف حسب حجم الشاشة. ويعتمد السوق في المقام الأول على الطلب المتزايد على شاشات العرض الذكية متوسطة الحجم عبر مختلف القطاعات الرأسية على مستوى العالم.
رؤى السوق القائمة على الحلول
بناءً على الدقة، يتم تقسيم سوق شاشات العرض الذكية إلى شاشات عالية الدقة بالكامل (FHD) وشاشات فائقة الدقة (UHD) وغيرها. تُستخدم الشاشات الذكية ذات الدقة العالية في الغالب للتطبيقات السكنية. ومع ذلك، تستخدم معظم التطبيقات الأخرى، مثل لافتات الإعلانات أو الأكشاك الذكية، شاشات بدقة UHD وFHD بشكل متزايد. يتم دفع السوق في المقام الأول من خلال الطلب المتزايد على شاشات العرض الذكية ذات الدقة الأفضل حتى يتمكن المستخدمون من الاستمتاع بتجربة غامرة.
يتبنى اللاعبون في سوق الشاشات الذكية استراتيجيات مثل عمليات الدمج والاستحواذ ومبادرات السوق للحفاظ على مواقعهم في السوق. وفيما يلي بعض التطورات التي قام بها اللاعبون الرئيسيون في السوق:
- وفقًا لشركة NoviSign، الشركة الرائدة في مجال شاشات العرض الرقمية التي تعمل بنظام Android، فإن تطبيق NoviSign Android Digital Signage متاح حاليًا لجميع شاشات Sony BRAVIA Professional التي تعمل بنظام Android. تدعم سلسلة BRAVIA Professional من Sony دقة 4K وHDR، ولديها منصة نظام على شريحة، وتأتي بأحجام تتراوح من 32 بوصة إلى 100 بوصة.
- انضمت شركة BenQ، الرائدة في مجال تقنيات العرض التفاعلية، إلى مبادرة الحلول المتكاملة للتعليم من Google. وتؤكد شركة BenQ التزامها بتوفير حلول تعليمية تمكن المدارس من بناء بيئات تعليمية نشطة أكثر مرونة ومناسبة للتعلم الشخصي والتعلم عن بعد من خلال الانضمام إلى هذه المبادرة.
رؤى إقليمية حول سوق الشاشات الذكية
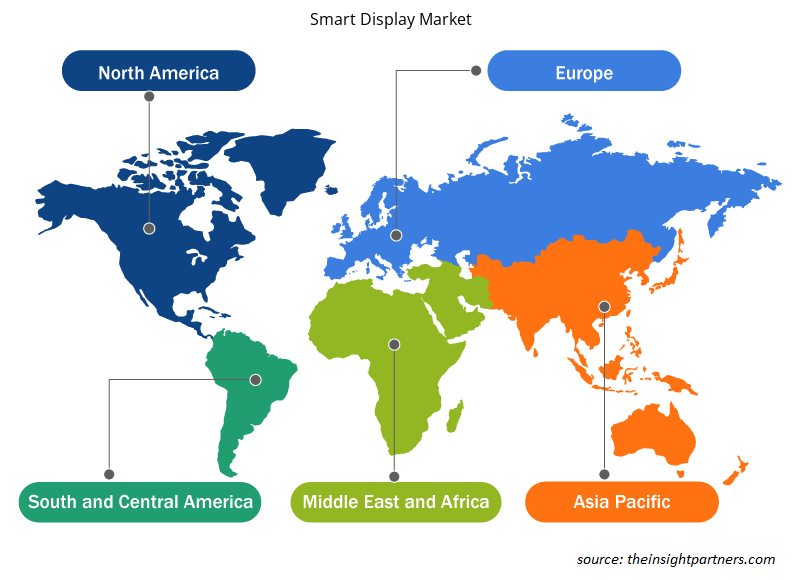
لقد قام المحللون في Insight Partners بشرح الاتجاهات والعوامل الإقليمية المؤثرة على سوق الشاشات الذكية طوال فترة التوقعات بشكل شامل. يناقش هذا القسم أيضًا قطاعات سوق الشاشات الذكية والجغرافيا في جميع أنحاء أمريكا الشمالية وأوروبا ومنطقة آسيا والمحيط الهادئ والشرق الأوسط وأفريقيا وأمريكا الجنوبية والوسطى.

- احصل على البيانات الإقليمية المحددة لسوق الشاشات الذكية
نطاق تقرير سوق الشاشات الذكية
| سمة التقرير | تفاصيل |
|---|---|
| حجم السوق في عام 2021 | 1.44 مليار دولار أمريكي |
| حجم السوق بحلول عام 2028 | 11.55 مليار دولار أمريكي |
| معدل النمو السنوي المركب العالمي (2021 - 2028) | 36.0% |
| البيانات التاريخية | 2019-2020 |
| فترة التنبؤ | 2022-2028 |
| القطاعات المغطاة | حسب الحجم
|
| المناطق والدول المغطاة | أمريكا الشمالية
|
| قادة السوق وملفات تعريف الشركات الرئيسية |
|
كثافة اللاعبين في السوق: فهم تأثيرها على ديناميكيات الأعمال
يشهد سوق شاشات العرض الذكية نموًا سريعًا، مدفوعًا بالطلب المتزايد من المستخدم النهائي بسبب عوامل مثل تفضيلات المستهلكين المتطورة والتقدم التكنولوجي والوعي المتزايد بفوائد المنتج. ومع ارتفاع الطلب، تعمل الشركات على توسيع عروضها والابتكار لتلبية احتياجات المستهلكين والاستفادة من الاتجاهات الناشئة، مما يؤدي إلى زيادة نمو السوق.
تشير كثافة اللاعبين في السوق إلى توزيع الشركات أو المؤسسات العاملة في سوق أو صناعة معينة. وهي تشير إلى عدد المنافسين (اللاعبين في السوق) الموجودين في مساحة سوق معينة نسبة إلى حجمها أو قيمتها السوقية الإجمالية.
الشركات الرئيسية العاملة في سوق الشاشات الذكية هي:
- شركة ألفابيت
- أمازون.كوم، المحدودة.
- إل جي إلكترونيكس
- مجموعة لينوفو المحدودة
- ماجنا الدولية المحدودة
إخلاء المسؤولية : الشركات المذكورة أعلاه ليست مرتبة بأي ترتيب معين.

- احصل على نظرة عامة على أهم اللاعبين الرئيسيين في سوق الشاشات الذكية
يتم تقسيم سوق شاشات العرض الذكية العالمية على أساس الحجم والنوع والدقة والصناعة. بناءً على الحجم، يتم تقسيم السوق إلى ما يصل إلى 12 بوصة، وفوق 12 بوصة - حتى 32 بوصة، وفوق 32 بوصة - حتى 52 بوصة، وفوق 52 بوصة. من حيث النوع، يتم تقسيم السوق إلى لافتات وشاشات ومرآة. بناءً على الدقة، يتم تقسيم السوق إلى دقة عالية كاملة ودقة عالية للغاية وغيرها. علاوة على ذلك، بناءً على الصناعة، يتم تقسيم سوق شاشات العرض الذكية إلى الأجهزة الاستهلاكية والمنزلية والسيارات والتجزئة والرعاية الصحية وغيرها.
تعد Alphabet Inc.؛ Amazon.com, Inc.؛ LG Electronics؛ LENOVO GROUP LIMITED؛ Magna International Inc؛ Panasonic Corporation؛ Sony Corporation؛ BenQ Corporation؛ NEXCOM International Co., Ltd.؛ وSamsung Electronics Co., Ltd. من أهم اللاعبين في سوق الشاشات الذكية الذين تم أخذهم في الاعتبار في دراسة البحث. بالإضافة إلى ذلك، تمت دراسة العديد من اللاعبين الآخرين في السوق وتحليلهم في تقرير البحث هذا للحصول على نظرة شاملة لسوق الشاشات الذكية العالمية ونظامها البيئي.
- التحليل التاريخي (سنتان)، السنة الأساسية، التوقعات (7 سنوات) مع معدل النمو السنوي المركب
- تحليل PEST و SWOT
- حجم السوق والقيمة / الحجم - عالميًا وإقليميًا وقطريًا
- الصناعة والمنافسة
- مجموعة بيانات Excel


Report Coverage
Revenue forecast, Company Analysis, Industry landscape, Growth factors, and Trends

Segment Covered
This text is related
to segments covered.

Regional Scope
North America, Europe, Asia Pacific, Middle East & Africa, South & Central America

Country Scope
This text is related
to country scope.
الأسئلة الشائعة
The adoption of smart signage enables a variety of content to be displayed and scheduled multiple times in a day or week. The context-aware smart signage provides active and real-time information. For instance, it can provide information related to weather; during the rainy season, it can show advertisements for umbrellas, or in summer, it can display advertisements for sunglasses.
The countries that registered a high growth rate during the forecast period are United States, Germany, UK, China, India, and South Korea
Based on type, the smart display market is segmented into display, mirror, and signage. The display segment mostly consists of smart display devices, such as Amazon’s Echo Show and Google’s Nest Max, and automotive smart displays. The growing penetration of IoT and the increasing adoption of smart home products drive market growth.
The top five key players operating in the global smart display market include Amazon, Baidu, Google, Alibaba, and Apple in 2021.
The global market size for smart display market in 2021 is estimated to be $ 1443.74 million.
The driving factors that influence the global smart display market are technological advancements and presence of popular brands.
Trends and growth analysis reports related to Electronics and Semiconductor : READ MORE..
The List of Companies - Smart Display Market
- Alphabet Inc.
- Amazon.com, Inc.
- LG Electronics
- LENOVO GROUP LIMITED
- Magna International Inc
- Panasonic Corporation
- Sony Corporation
- BenQ Corporation
- NEXCOM International Co., Ltd.
- Samsung Electronics Co., Ltd.
The Insight Partners performs research in 4 major stages: Data Collection & Secondary Research, Primary Research, Data Analysis and Data Triangulation & Final Review.
- Data Collection and Secondary Research:
As a market research and consulting firm operating from a decade, we have published and advised several client across the globe. First step for any study will start with an assessment of currently available data and insights from existing reports. Further, historical and current market information is collected from Investor Presentations, Annual Reports, SEC Filings, etc., and other information related to company’s performance and market positioning are gathered from Paid Databases (Factiva, Hoovers, and Reuters) and various other publications available in public domain.
Several associations trade associates, technical forums, institutes, societies and organization are accessed to gain technical as well as market related insights through their publications such as research papers, blogs and press releases related to the studies are referred to get cues about the market. Further, white papers, journals, magazines, and other news articles published in last 3 years are scrutinized and analyzed to understand the current market trends.
- Primary Research:
The primarily interview analysis comprise of data obtained from industry participants interview and answers to survey questions gathered by in-house primary team.
For primary research, interviews are conducted with industry experts/CEOs/Marketing Managers/VPs/Subject Matter Experts from both demand and supply side to get a 360-degree view of the market. The primary team conducts several interviews based on the complexity of the markets to understand the various market trends and dynamics which makes research more credible and precise.
A typical research interview fulfils the following functions:
- Provides first-hand information on the market size, market trends, growth trends, competitive landscape, and outlook
- Validates and strengthens in-house secondary research findings
- Develops the analysis team’s expertise and market understanding
Primary research involves email interactions and telephone interviews for each market, category, segment, and sub-segment across geographies. The participants who typically take part in such a process include, but are not limited to:
- Industry participants: VPs, business development managers, market intelligence managers and national sales managers
- Outside experts: Valuation experts, research analysts and key opinion leaders specializing in the electronics and semiconductor industry.
Below is the breakup of our primary respondents by company, designation, and region:

Once we receive the confirmation from primary research sources or primary respondents, we finalize the base year market estimation and forecast the data as per the macroeconomic and microeconomic factors assessed during data collection.
- Data Analysis:
Once data is validated through both secondary as well as primary respondents, we finalize the market estimations by hypothesis formulation and factor analysis at regional and country level.
- Macro-Economic Factor Analysis:
We analyse macroeconomic indicators such the gross domestic product (GDP), increase in the demand for goods and services across industries, technological advancement, regional economic growth, governmental policies, the influence of COVID-19, PEST analysis, and other aspects. This analysis aids in setting benchmarks for various nations/regions and approximating market splits. Additionally, the general trend of the aforementioned components aid in determining the market's development possibilities.
- Country Level Data:
Various factors that are especially aligned to the country are taken into account to determine the market size for a certain area and country, including the presence of vendors, such as headquarters and offices, the country's GDP, demand patterns, and industry growth. To comprehend the market dynamics for the nation, a number of growth variables, inhibitors, application areas, and current market trends are researched. The aforementioned elements aid in determining the country's overall market's growth potential.
- Company Profile:
The “Table of Contents” is formulated by listing and analyzing more than 25 - 30 companies operating in the market ecosystem across geographies. However, we profile only 10 companies as a standard practice in our syndicate reports. These 10 companies comprise leading, emerging, and regional players. Nonetheless, our analysis is not restricted to the 10 listed companies, we also analyze other companies present in the market to develop a holistic view and understand the prevailing trends. The “Company Profiles” section in the report covers key facts, business description, products & services, financial information, SWOT analysis, and key developments. The financial information presented is extracted from the annual reports and official documents of the publicly listed companies. Upon collecting the information for the sections of respective companies, we verify them via various primary sources and then compile the data in respective company profiles. The company level information helps us in deriving the base number as well as in forecasting the market size.
- Developing Base Number:
Aggregation of sales statistics (2020-2022) and macro-economic factor, and other secondary and primary research insights are utilized to arrive at base number and related market shares for 2022. The data gaps are identified in this step and relevant market data is analyzed, collected from paid primary interviews or databases. On finalizing the base year market size, forecasts are developed on the basis of macro-economic, industry and market growth factors and company level analysis.
- Data Triangulation and Final Review:
The market findings and base year market size calculations are validated from supply as well as demand side. Demand side validations are based on macro-economic factor analysis and benchmarks for respective regions and countries. In case of supply side validations, revenues of major companies are estimated (in case not available) based on industry benchmark, approximate number of employees, product portfolio, and primary interviews revenues are gathered. Further revenue from target product/service segment is assessed to avoid overshooting of market statistics. In case of heavy deviations between supply and demand side values, all thes steps are repeated to achieve synchronization.
We follow an iterative model, wherein we share our research findings with Subject Matter Experts (SME’s) and Key Opinion Leaders (KOLs) until consensus view of the market is not formulated – this model negates any drastic deviation in the opinions of experts. Only validated and universally acceptable research findings are quoted in our reports.
We have important check points that we use to validate our research findings – which we call – data triangulation, where we validate the information, we generate from secondary sources with primary interviews and then we re-validate with our internal data bases and Subject matter experts. This comprehensive model enables us to deliver high quality, reliable data in shortest possible time.


 احصل على عينة مجانية لهذا التقرير