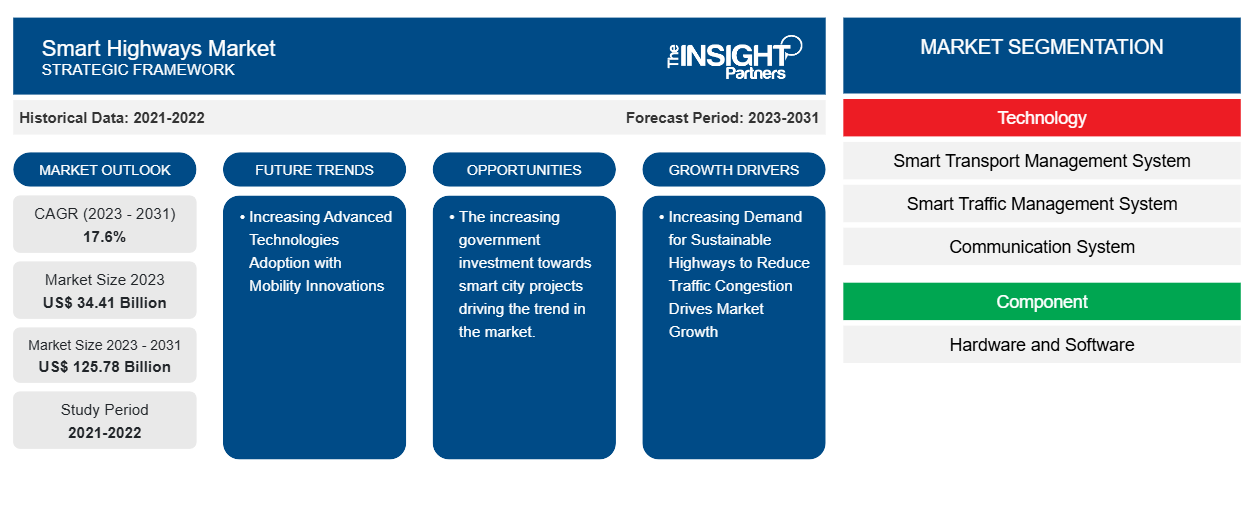
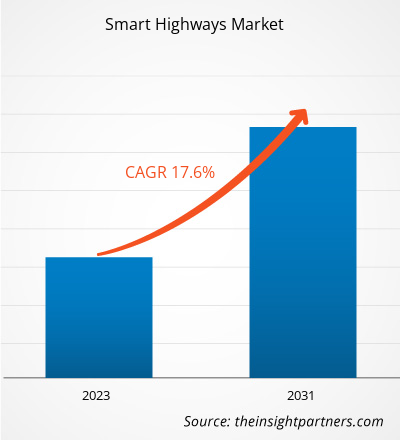
من المتوقع أن يصل حجم سوق الطرق السريعة الذكية إلى 125.78 مليار دولار أمريكي بحلول عام 2031 من 34.41 مليار دولار أمريكي في عام 2023. ومن المتوقع أن يسجل السوق معدل نمو سنوي مركب بنسبة 17.6٪ خلال الفترة 2023-2031. إن المبادرات الحكومية المتزايدة لتطوير المدن الذكية تدفع نمو السوق. إن زيادة اعتماد التقنيات المتقدمة لإنشاء المدن الذكية في جميع أنحاء العالم هو اتجاه دافع في السوق.
تحليل سوق الطرق السريعة الذكية
إن زيادة تطوير الطرق السريعة الذكية مع دمج التقنيات المتقدمة، مثل الذكاء الاصطناعي وإنترنت الأشياء والأجهزة المتصلة، في طرق النقل يدفع نمو سوق الطرق السريعة الذكية. هناك هيئات حاكمة مختلفة تخطط لتعديل مساراتها، وخاصة الطرق السريعة لدعم أنظمة النقل الذكية والبنية التحتية للطرق في جميع أنحاء العالم. على سبيل المثال، في أوروبا، تم بناء أنظمة النقل الذكية التعاونية للطرق الذكية التي تسمح لمستخدمي الطرق ومديري المرور بتنسيق وتبادل المعلومات المفيدة حول أنشطة الطرق.
نظرة عامة على سوق الطرق السريعة الذكية
إن زيادة تبني وتطوير مشاريع " المدينة الذكية " في المناطق الحضرية مع دمج شبكة أجهزة استشعار واسعة النطاق لتعزيز الاتصال الأفضل يدفع نمو السوق. تخضع المدن الذكية في جميع أنحاء العالم لتغييرات كبيرة لجعل حياة المواطنين أفضل وأكثر كفاءة وصديقة للبيئة. ومن المتوقع أن تعزز الابتكارات مثل بناء المدن الذكية سوق الطرق السريعة الذكية بشكل كبير في السنوات القادمة.
بفضل المشاريع من القطاعين العام والخاص، تشهد مدينة نيويورك حاليًا تحولًا رقميًا باستخدام أحدث التقنيات التي توفرها إنترنت الأشياء والأجهزة المتصلة.
قم بتخصيص هذا التقرير ليناسب متطلباتك
ستحصل على تخصيص لأي تقرير - مجانًا - بما في ذلك أجزاء من هذا التقرير، أو تحليل على مستوى الدولة، وحزمة بيانات Excel، بالإضافة إلى الاستفادة من العروض والخصومات الرائعة للشركات الناشئة والجامعات
- احصل على أهم اتجاهات السوق الرئيسية لهذا التقرير.ستتضمن هذه العينة المجانية تحليلاً للبيانات، بدءًا من اتجاهات السوق وحتى التقديرات والتوقعات.
محركات وفرص سوق الطرق السريعة الذكية
الطلب المتزايد على الطرق السريعة المستدامة لتقليل الازدحام المروري يدفع نمو السوق
إن الطرق السريعة المستدامة تمكن التنمية المجتمعية والنمو الاقتصادي وتقلل من التأثيرات السلبية على البيئة. ووفقًا للإدارة الفيدرالية للطرق السريعة، فإن الطرق السريعة المستدامة تشكل جزءًا لا يتجزأ من التنمية المستدامة التي يجب تقييمها والنظر في تنفيذها طوال دورة حياتها، من التصميم إلى البناء والتشغيل والصيانة. بالإضافة إلى معالجة الاحتياجات البيئية والموارد الطبيعية، تلبي الطرق السريعة المستدامة الطلب على إمكانية الوصول إلى خدمات النقل والمشي الآمن والمريح وركوب الدراجات وطرق النقل. تعالج سلطات الطرق السريعة في الولايات المتحدة الاستدامة من خلال مجموعة واسعة من المبادرات، مثل أنظمة النقل الذكية (ITS)، وإعادة التدوير، والتخطيط، والارتباطات البيئية، ومتطلبات قانون السياسة البيئية الوطنية (NEPA).
ستوفر زيادة الإنفاق الحكومي على البنية التحتية للبناء والطرق المزيد من الفرص لسوق الطرق السريعة الذكية في أمريكا الشمالية. وفقًا لوزارة النقل الأمريكية، بلغ الإنفاق العام على مشاريع الطرق السريعة والشوارع في الولايات المتحدة 95.5 مليار دولار أمريكي في عام 2021. ووفقًا لوزارة النقل الأمريكية، تم استثمار حوالي 350 مليون دولار أمريكي في الصناديق العامة والخاصة لتطوير المدن الذكية.
زيادة اعتماد التقنيات المتقدمة من خلال ابتكارات التنقل
تُبقي التقنيات المختلفة، مثل شبكة Wi-Fi الشبكية المخصصة والاتصال الخلوي بالمركبات إلى كل شيء (C-V2X)، السائقين على اطلاع بالتغييرات في إشارات المرور والتواصل مع المركبات الأخرى لتجنب الاصطدامات. ومن المتوقع أن توفر الابتكارات في التقنيات الرقمية فرص نمو مربحة للاعبين في سوق الطرق السريعة الذكية خلال فترة التنبؤ. تستثمر الحكومات في جميع أنحاء العالم بشكل كبير في تقنيات المركبات المتصلة لتعزيز نمو سوق الطرق السريعة الذكية. على سبيل المثال، تخطط وزارة النقل في كولورادو لتجهيز 2500 مركبة حكومية بتقنيات C-V2X والاتصالات القصيرة المدى المخصصة (DSRC) في غضون 10 سنوات. في الصين، تم اعتماد C-V2X على نطاق واسع من قبل الحكومة كعامل تمكين رئيسي للمركبات المتصلة لأنها توفر تغطية واسعة.
تقرير تحليل تجزئة سوق الطرق السريعة الذكية
إن القطاعات الرئيسية التي ساهمت في استخلاص تحليل سوق الطرق السريعة الذكية هي تكنولوجيا الأقراص والمكونات والجغرافيا.
- بناءً على التكنولوجيا، ينقسم السوق إلى أنظمة إدارة النقل الذكية، وأنظمة إدارة المرور الذكية ، وأنظمة الاتصالات، وأنظمة المراقبة، وغيرها. ومن بين هذه الأنظمة، كان لأنظمة إدارة النقل الذكية الحصة الأكبر في عام 2023. ويرجع ذلك إلى زيادة الاستثمار في المدن الذكية بمبادرات حكومية.
- اعتمادًا على المكون، يتم تقسيم السوق إلى أجهزة وبرامج. ومن بين هذه الأجهزة، سيكون لشريحة الأجهزة حصة أكبر في عام 2023. ويرجع هذا إلى زيادة الاستثمارات في المدن الذكية.
تحليل حصة سوق الطرق السريعة الذكية حسب المنطقة الجغرافية
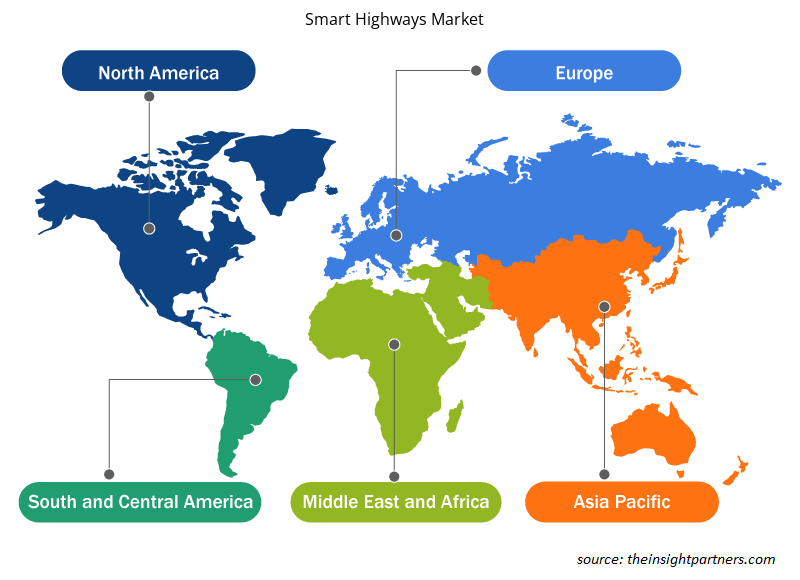
ينقسم النطاق الجغرافي لتقرير سوق الطرق السريعة الذكية بشكل أساسي إلى خمس مناطق: أمريكا الشمالية، ومنطقة آسيا والمحيط الهادئ، وأوروبا، والشرق الأوسط وأفريقيا، وأمريكا الجنوبية.
من المتوقع أن تحظى أمريكا الشمالية بأكبر حصة في عام 2023. ويرجع هذا في المقام الأول إلى زيادة الاستثمارات في الطرق السريعة لدفع ثمن الجسور والطرق السريعة والأنفاق. يوجد أكثر من 300 منشأة في جميع أنحاء الولايات المتحدة تعمل على تحويل سيناريو النقل البري والطرق السريعة في المنطقة. وفقًا لأدوات تصور بيانات Toll Miner، يوجد أكثر من 114 مشغلاً يديرون أكثر من 321 منشأة برسوم في الولايات المتحدة. يستخدم هذا ETC، ويغطي 6235 ميلاً من خط الوسط من الطريق. لذلك، فإن التبني واسع النطاق لأنظمة الرسوم الآلية، والتي تلغي المدفوعات النقدية (وساحات الرسوم) من المرافق، يشجع على التنفيذ الناجح لمكونات وتقنيات أخرى للطرق السريعة الذكية في أمريكا الشمالية.
رؤى إقليمية حول سوق الطرق السريعة الذكية
لقد قام المحللون في Insight Partners بشرح الاتجاهات والعوامل الإقليمية المؤثرة على سوق الطرق السريعة الذكية طوال فترة التوقعات بشكل شامل. يناقش هذا القسم أيضًا قطاعات سوق الطرق السريعة الذكية والجغرافيا في جميع أنحاء أمريكا الشمالية وأوروبا ومنطقة آسيا والمحيط الهادئ والشرق الأوسط وأفريقيا وأمريكا الجنوبية والوسطى.

- احصل على البيانات الإقليمية المحددة لسوق الطرق السريعة الذكية
نطاق تقرير سوق الطرق السريعة الذكية
| سمة التقرير | تفاصيل |
|---|---|
| حجم السوق في عام 2023 | 34.41 مليار دولار أمريكي |
| حجم السوق بحلول عام 2031 | 125.78 مليار دولار أمريكي |
| معدل النمو السنوي المركب العالمي (2023 - 2031) | 17.6% |
| البيانات التاريخية | 2021-2022 |
| فترة التنبؤ | 2023-2031 |
| القطاعات المغطاة | حسب التكنولوجيا
|
| المناطق والدول المغطاة | أمريكا الشمالية
|
| قادة السوق وملفات تعريف الشركات الرئيسية |
|
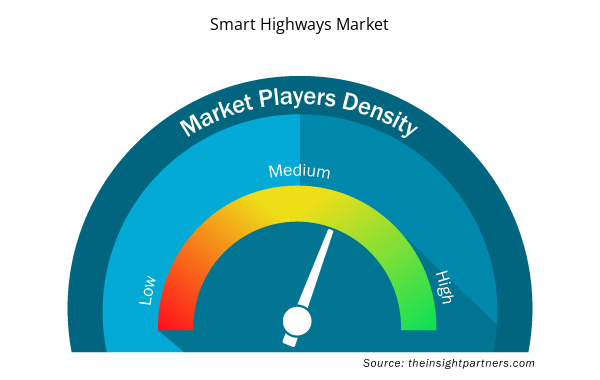
كثافة اللاعبين في سوق الطرق السريعة الذكية: فهم تأثيرها على ديناميكيات الأعمال
يشهد سوق الطرق السريعة الذكية نموًا سريعًا، مدفوعًا بالطلب المتزايد من المستخدم النهائي بسبب عوامل مثل تفضيلات المستهلكين المتطورة والتقدم التكنولوجي والوعي المتزايد بفوائد المنتج. ومع ارتفاع الطلب، تعمل الشركات على توسيع عروضها والابتكار لتلبية احتياجات المستهلكين والاستفادة من الاتجاهات الناشئة، مما يؤدي إلى زيادة نمو السوق.
تشير كثافة اللاعبين في السوق إلى توزيع الشركات أو المؤسسات العاملة في سوق أو صناعة معينة. وهي تشير إلى عدد المنافسين (اللاعبين في السوق) الموجودين في مساحة سوق معينة نسبة إلى حجمها أو قيمتها السوقية الإجمالية.
الشركات الرئيسية العاملة في سوق الطرق السريعة الذكية هي:
- الموصل
- شركة.
- شركة هواوي للتكنولوجيا المحدودة
- مجموعة اي بي اي
- سيسكو
- شركة كابش ترافيك كوم ايه جي
إخلاء المسؤولية : الشركات المذكورة أعلاه ليست مرتبة بأي ترتيب معين.

- احصل على نظرة عامة على أهم اللاعبين الرئيسيين في سوق الطرق السريعة الذكية
أخبار سوق الطرق السريعة الذكية والتطورات الأخيرة
يتم تقييم سوق الطرق السريعة الذكية من خلال جمع البيانات النوعية والكمية بعد البحث الأولي والثانوي، والتي تتضمن منشورات الشركات المهمة وبيانات الجمعيات وقواعد البيانات. فيما يلي بعض التطورات في سوق الطرق السريعة الذكية:
- تم تطوير طريقين في إطار مشروع المدينة الذكية في الهند، مع فتح العاصمة للجمهور. سيتم الانتهاء من الطرق السريعة الذكية التي تم بناؤها من ألثارا إلى تشينثيتا عبر فازوثاكود وثيكود بحلول نهاية أبريل 2024. تم الانتهاء من طريق كيليبالام-أتاكولانغارا بحلول الأسبوع الثاني من مايو 2024. (المصدر: Times of India-Newsletter، مارس 2024)
- أعلنت شركة Iteris، Inc.، وهي منظومة التكنولوجيا الموثوقة عالميًا لإدارة البنية التحتية للتنقل الذكي، اليوم أن مدينة كارسون سيتي بولاية نيفادا الأمريكية اختارت ترقية أجهزة استشعار اكتشاف التقاطعات في المدينة إلى أجهزة استشعار Vantage Apex الهجينة من Iteris. Vantage Apex هو أول جهاز استشعار راداري رباعي الأبعاد (4D) وفيديو عالي الدقة (HD) بدقة 1080 بكسل مع خوارزميات الذكاء الاصطناعي المتكاملة. يوفر دقة الكشف والتتبع والتصنيف المتطورة للمركبات والمشاة وراكبي الدراجات، بالإضافة إلى شاشة عرض فيديو عالية الدقة لمراقبة مركز إدارة المرور. (المصدر: بيان صحفي، أبريل 2024)
تقرير سوق الطرق السريعة الذكية: التغطية والنتائج المتوقعة
يوفر تقرير "حجم سوق الطرق السريعة الذكية والتوقعات (2021-2031)" تحليلاً مفصلاً للسوق يغطي المجالات التالية:
- حجم سوق الطرق السريعة الذكية وتوقعاته على المستويات العالمية والإقليمية والوطنية لجميع قطاعات السوق الرئيسية التي يغطيها النطاق
- اتجاهات سوق الطرق السريعة الذكية بالإضافة إلى ديناميكيات السوق مثل السائقين والقيود والفرص الرئيسية
- تحليل مفصل لـ PEST و SWOT
- تحليل سوق الطرق السريعة الذكية يغطي اتجاهات السوق الرئيسية والإطار العالمي والإقليمي والجهات الفاعلة الرئيسية واللوائح والتطورات الأخيرة في السوق
- تحليل المشهد الصناعي والمنافسة الذي يغطي تركيز السوق، وتحليل خريطة الحرارة، واللاعبين البارزين، والتطورات الأخيرة لسوق الطرق السريعة الذكية
- ملفات تعريف الشركة التفصيلية
- التحليل التاريخي (سنتان)، السنة الأساسية، التوقعات (7 سنوات) مع معدل النمو السنوي المركب
- تحليل PEST و SWOT
- حجم السوق والقيمة / الحجم - عالميًا وإقليميًا وقطريًا
- الصناعة والمنافسة
- مجموعة بيانات Excel


Report Coverage
Revenue forecast, Company Analysis, Industry landscape, Growth factors, and Trends

Segment Covered
This text is related
to segments covered.

Regional Scope
North America, Europe, Asia Pacific, Middle East & Africa, South & Central America

Country Scope
This text is related
to country scope.
الأسئلة الشائعة
North America is expected to dominate the smart highways market in 2023.
Increasing demand for sustainable highways to reduce traffic congestion drives the market growth.
Increasing adoption of advanced technologies for smart city establishment across the globe is a driving trend in the market.
Conduent, Inc., Huawei Technologies Co., Ltd., IBI Group, Cisco, Kapsch TrafficCom AG, Nippon Koei Co., Ltd., Nokia, Siemens, TelegraToshiba Infrastructure Systems & Solutions Corporation are among the major companies operating in the Smart Highways market.
The smart highways market size is projected to reach US$ 125.78 billion by 2031 from US$ 34.41 billion in 2023.
The market is expected to register a CAGR of 17.6% during 2023–2031.
Trends and growth analysis reports related to Automotive and Transportation : READ MORE..
The Insight Partners performs research in 4 major stages: Data Collection & Secondary Research, Primary Research, Data Analysis and Data Triangulation & Final Review.
- Data Collection and Secondary Research:
As a market research and consulting firm operating from a decade, we have published and advised several client across the globe. First step for any study will start with an assessment of currently available data and insights from existing reports. Further, historical and current market information is collected from Investor Presentations, Annual Reports, SEC Filings, etc., and other information related to company’s performance and market positioning are gathered from Paid Databases (Factiva, Hoovers, and Reuters) and various other publications available in public domain.
Several associations trade associates, technical forums, institutes, societies and organization are accessed to gain technical as well as market related insights through their publications such as research papers, blogs and press releases related to the studies are referred to get cues about the market. Further, white papers, journals, magazines, and other news articles published in last 3 years are scrutinized and analyzed to understand the current market trends.
- Primary Research:
The primarily interview analysis comprise of data obtained from industry participants interview and answers to survey questions gathered by in-house primary team.
For primary research, interviews are conducted with industry experts/CEOs/Marketing Managers/VPs/Subject Matter Experts from both demand and supply side to get a 360-degree view of the market. The primary team conducts several interviews based on the complexity of the markets to understand the various market trends and dynamics which makes research more credible and precise.
A typical research interview fulfils the following functions:
- Provides first-hand information on the market size, market trends, growth trends, competitive landscape, and outlook
- Validates and strengthens in-house secondary research findings
- Develops the analysis team’s expertise and market understanding
Primary research involves email interactions and telephone interviews for each market, category, segment, and sub-segment across geographies. The participants who typically take part in such a process include, but are not limited to:
- Industry participants: VPs, business development managers, market intelligence managers and national sales managers
- Outside experts: Valuation experts, research analysts and key opinion leaders specializing in the electronics and semiconductor industry.
Below is the breakup of our primary respondents by company, designation, and region:

Once we receive the confirmation from primary research sources or primary respondents, we finalize the base year market estimation and forecast the data as per the macroeconomic and microeconomic factors assessed during data collection.
- Data Analysis:
Once data is validated through both secondary as well as primary respondents, we finalize the market estimations by hypothesis formulation and factor analysis at regional and country level.
- Macro-Economic Factor Analysis:
We analyse macroeconomic indicators such the gross domestic product (GDP), increase in the demand for goods and services across industries, technological advancement, regional economic growth, governmental policies, the influence of COVID-19, PEST analysis, and other aspects. This analysis aids in setting benchmarks for various nations/regions and approximating market splits. Additionally, the general trend of the aforementioned components aid in determining the market's development possibilities.
- Country Level Data:
Various factors that are especially aligned to the country are taken into account to determine the market size for a certain area and country, including the presence of vendors, such as headquarters and offices, the country's GDP, demand patterns, and industry growth. To comprehend the market dynamics for the nation, a number of growth variables, inhibitors, application areas, and current market trends are researched. The aforementioned elements aid in determining the country's overall market's growth potential.
- Company Profile:
The “Table of Contents” is formulated by listing and analyzing more than 25 - 30 companies operating in the market ecosystem across geographies. However, we profile only 10 companies as a standard practice in our syndicate reports. These 10 companies comprise leading, emerging, and regional players. Nonetheless, our analysis is not restricted to the 10 listed companies, we also analyze other companies present in the market to develop a holistic view and understand the prevailing trends. The “Company Profiles” section in the report covers key facts, business description, products & services, financial information, SWOT analysis, and key developments. The financial information presented is extracted from the annual reports and official documents of the publicly listed companies. Upon collecting the information for the sections of respective companies, we verify them via various primary sources and then compile the data in respective company profiles. The company level information helps us in deriving the base number as well as in forecasting the market size.
- Developing Base Number:
Aggregation of sales statistics (2020-2022) and macro-economic factor, and other secondary and primary research insights are utilized to arrive at base number and related market shares for 2022. The data gaps are identified in this step and relevant market data is analyzed, collected from paid primary interviews or databases. On finalizing the base year market size, forecasts are developed on the basis of macro-economic, industry and market growth factors and company level analysis.
- Data Triangulation and Final Review:
The market findings and base year market size calculations are validated from supply as well as demand side. Demand side validations are based on macro-economic factor analysis and benchmarks for respective regions and countries. In case of supply side validations, revenues of major companies are estimated (in case not available) based on industry benchmark, approximate number of employees, product portfolio, and primary interviews revenues are gathered. Further revenue from target product/service segment is assessed to avoid overshooting of market statistics. In case of heavy deviations between supply and demand side values, all thes steps are repeated to achieve synchronization.
We follow an iterative model, wherein we share our research findings with Subject Matter Experts (SME’s) and Key Opinion Leaders (KOLs) until consensus view of the market is not formulated – this model negates any drastic deviation in the opinions of experts. Only validated and universally acceptable research findings are quoted in our reports.
We have important check points that we use to validate our research findings – which we call – data triangulation, where we validate the information, we generate from secondary sources with primary interviews and then we re-validate with our internal data bases and Subject matter experts. This comprehensive model enables us to deliver high quality, reliable data in shortest possible time.


 احصل على عينة مجانية لهذا التقرير