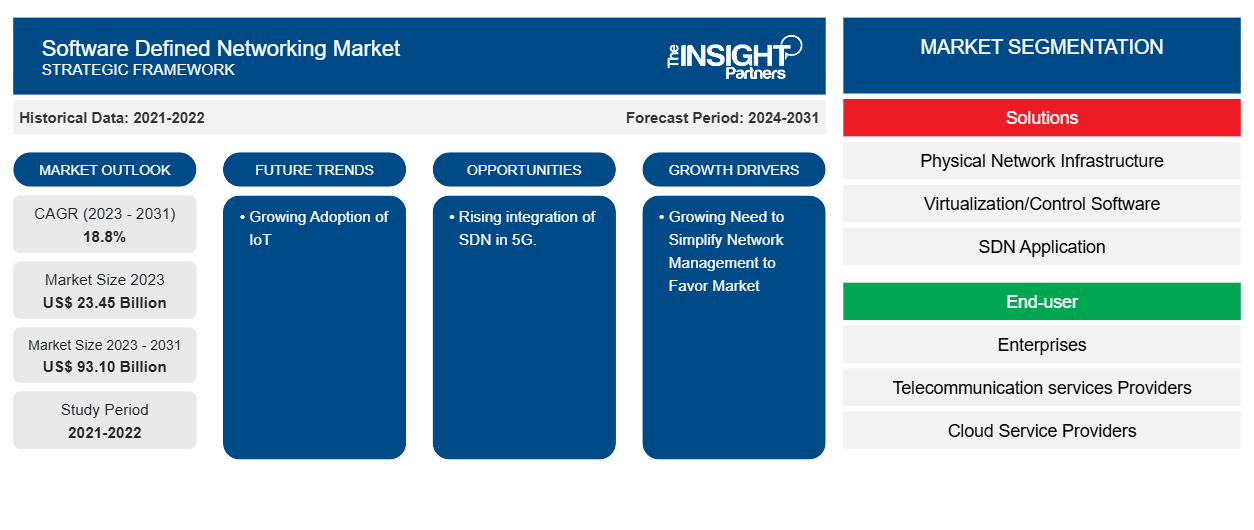
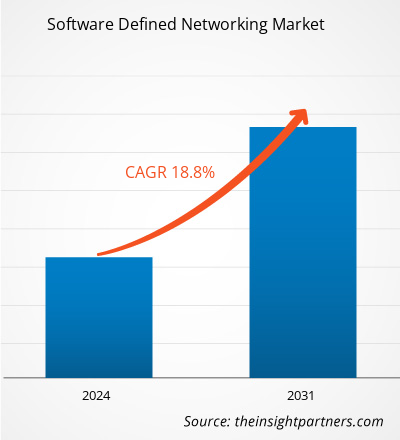
من المتوقع أن يصل حجم سوق الشبكات المحددة بالبرمجيات إلى 93.10 مليار دولار أمريكي بحلول عام 2031 من 23.45 مليار دولار أمريكي في عام 2023. ومن المتوقع أن يسجل السوق معدل نمو سنوي مركب بنسبة 18.8٪ في الفترة من 2023 إلى 2031. ومن المرجح أن تظل الحاجة المتزايدة لتبسيط إدارة الشبكة والتنفيذ المتزايد لـ SDN لـ 5G من الاتجاهات الرئيسية لسوق الشبكات المحددة بالبرمجيات.
تحليل سوق الشبكات المحددة بالبرمجيات
تنمو سوق الشبكات المحددة بالبرمجيات بوتيرة سريعة وتغذي نمو السوق مع تحول مؤسسات تكنولوجيا المعلومات بسرعة نحو تقنية السحابة. تتمتع شركات وكيانات تكنولوجيا المعلومات بالفوائد المرتبطة بالأدوار والأحداث على مستوى التطبيق لتحقيق الكفاءة الوظيفية والمرونة. يتكون هذا من أتمتة خدمات الشبكة والتكامل السحابي وخدمات الأتمتة الهجينة. حاليًا، تقوم العديد من الشركات بإنشاء تطبيقات خدمة الشبكة للبرمجيات الخاصة بـ SDN من أجل إضافة قيمة المحاكاة الافتراضية إلى معيار جديد من خلال تمكين هذه الخدمات من التأثير على البنية الأساسية بقوة نيابة عن التطبيقات وقابليتها للاستخدام.
نظرة عامة على سوق الشبكات المحددة بالبرمجيات
إن استخدام وحدات تحكم تعتمد على البرامج أو واجهات برمجة التطبيقات (APIs) للاتصال بالبنية الأساسية للأجهزة الأساسية وإدارة حركة المرور على الشبكة، أو الشبكات المحددة بالبرمجيات، أو SDN، هي إحدى تقنيات الشبكات. ويختلف هذا النهج عن الشبكات التقليدية، التي تدير حركة المرور على الشبكة باستخدام مكونات أجهزة متخصصة مثل المحولات وأجهزة التوجيه. ويمكن للشبكات المحددة بالبرمجيات استخدام البرامج لبناء وإدارة شبكة افتراضية أو إدارة الأجهزة التقليدية.
قم بتخصيص هذا التقرير ليناسب متطلباتك
ستحصل على تخصيص لأي تقرير - مجانًا - بما في ذلك أجزاء من هذا التقرير، أو تحليل على مستوى الدولة، وحزمة بيانات Excel، بالإضافة إلى الاستفادة من العروض والخصومات الرائعة للشركات الناشئة والجامعات
سوق الشبكات المحددة بالبرمجيات:
- احصل على أهم اتجاهات السوق الرئيسية لهذا التقرير.ستتضمن هذه العينة المجانية تحليلاً للبيانات، بدءًا من اتجاهات السوق وحتى التقديرات والتوقعات.
محركات وفرص سوق الشبكات المحددة بالبرمجيات
الحاجة المتزايدة إلى تبسيط إدارة الشبكة لصالح السوق
إن أحد العوامل الرئيسية التي تدفع صناعة الشبكات المحددة بالبرمجيات (SDN) إلى الأمام هو الحاجة المتزايدة من جانب الشركات لتبسيط إدارة الشبكة. غالبًا ما تحتوي الشبكات التقليدية على إعدادات معقدة وإجراءات إدارة يدوية، مما يزيد من النفقات ويؤدي إلى عدم الكفاءة. تقدم SDN واجهة متسقة للتحكم في مجموعة متنوعة من أجهزة الشبكة، وتمركز التحكم في الشبكة، وتسمح بالأتمتة من أجل التغلب على هذه الصعوبات. تسهل هذه الطريقة المركزية اتباع نهج محايد للبائع، وتسريع توفير الشبكة، وتبسيط إدارة السياسات، وتحسين رؤية أداء الشبكة. تعد SDN خيارًا قويًا لتحديث البنية الأساسية للشبكة والتكيف مع متطلبات الأعمال المتغيرة لأنها تجعل العمليات أبسط، مما يوفر للشركات المال والوقت والموارد.
التكامل المتزايد لـ SDN في 5G.
SDN عبارة عن بنية شبكة ذكية تتوافق مع معايير النظام البيئي لشبكة الجيل الخامس. يمكن لشبكة الجيل الخامس أن تعمل عبر مستوى تحكم بمساعدة SDN، والتي يمكنها تقديم إطار عمل كامل. تعد تدفقات البيانات الأفضل عند انتقال البيانات عبر شبكة الجيل الخامس واحدة فقط من المزايا العديدة التي توفرها هذه التقنية. تعمل بنية SDN على تقليل زمن الوصول وتعظيم عرض النطاق الترددي للشبكة. من خلال تحديد أفضل تدفقات البيانات في الوقت الفعلي، يمكن لتقنية SDN أتمتة وإدارة التكرار في الشبكة من مستوى تحكم مركزي، مما يتجنب الانقطاعات الكبيرة.
تقرير تحليل تجزئة سوق الشبكات المحددة بالبرمجيات
إن القطاعات الرئيسية التي ساهمت في اشتقاق تحليل سوق الشبكات المحددة بالبرمجيات هي الحلول والمستخدم النهائي والنشر والقطاع الصناعي.
- بناءً على الحلول، يتم تقسيم سوق الشبكات المحددة بالبرمجيات إلى البنية التحتية للشبكة المادية، وبرامج التحكم/المحاكاة الافتراضية، وتطبيقات SDN، والخدمات المهنية.
- بحسب المستخدم النهائي، يتم تقسيم السوق إلى المؤسسات ومقدمي خدمات الاتصالات ومقدمي الخدمات السحابية.
- استنادًا إلى الصناعة العمودية، يتم تقسيم سوق الشبكات المحددة بالبرمجيات إلى الخدمات المصرفية والمالية والتأمين، والاتصالات وتكنولوجيا المعلومات، والسلع الاستهلاكية والتجزئة، والحكومة والدفاع، والتصنيع، والبحث والأوساط الأكاديمية، وغيرها.
تحليل حصة سوق الشبكات المحددة بالبرمجيات حسب المنطقة الجغرافية
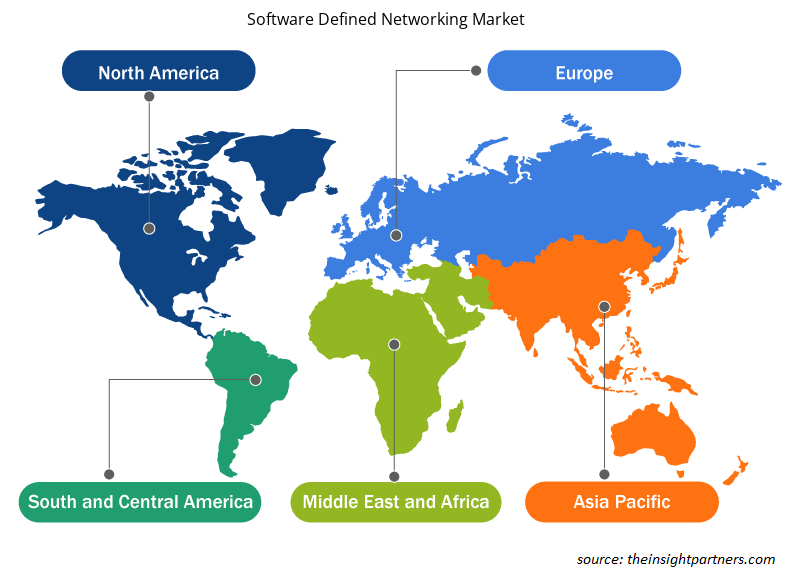
ينقسم النطاق الجغرافي لتقرير سوق الشبكات المحددة بالبرمجيات بشكل أساسي إلى خمس مناطق: أمريكا الشمالية، ومنطقة آسيا والمحيط الهادئ، وأوروبا، والشرق الأوسط وأفريقيا، وأمريكا الجنوبية/أمريكا الجنوبية والوسطى. سيطرت أمريكا الشمالية على سوق الشبكات المحددة بالبرمجيات. وقد أدت اتجاهات تبني التكنولوجيا العالية في مختلف الصناعات في منطقة أمريكا الشمالية إلى تغذية نمو سوق الشبكات المحددة بالبرمجيات. ومن المتوقع أن تؤدي العوامل بما في ذلك زيادة تبني الأدوات الرقمية والإنفاق التكنولوجي العالي من قبل الوكالات الحكومية إلى دفع نمو سوق الشبكات المحددة بالبرمجيات في أمريكا الشمالية. وعلاوة على ذلك، فإن التركيز القوي على البحث والتطوير في الاقتصادات المتقدمة في الولايات المتحدة وكندا يجبر اللاعبين في أمريكا الشمالية على جلب حلول متقدمة تقنيًا إلى السوق. بالإضافة إلى ذلك، يوجد في الولايات المتحدة عدد كبير من اللاعبين في سوق الشبكات المحددة بالبرمجيات الذين يركزون بشكل متزايد على تطوير حلول مبتكرة. ومن بين اللاعبين الرئيسيين في سوق الشبكات المحددة بالبرمجيات IBM وCisco وMicrosoft، من بين آخرين. وتساهم كل هذه العوامل في نمو سوق الشبكات المحددة بالبرمجيات في المنطقة.
رؤى إقليمية حول سوق الشبكات المحددة بالبرمجيات
لقد قام المحللون في Insight Partners بشرح الاتجاهات والعوامل الإقليمية المؤثرة على سوق الشبكات المحددة بالبرمجيات طوال فترة التوقعات بشكل شامل. يناقش هذا القسم أيضًا قطاعات سوق الشبكات المحددة بالبرمجيات والجغرافيا في جميع أنحاء أمريكا الشمالية وأوروبا ومنطقة آسيا والمحيط الهادئ والشرق الأوسط وأفريقيا وأمريكا الجنوبية والوسطى.
- احصل على البيانات الإقليمية المحددة لسوق الشبكات المحددة بالبرمجيات
نطاق تقرير سوق الشبكات المحددة بالبرمجيات
| سمة التقرير | تفاصيل |
|---|---|
| حجم السوق في عام 2023 | 23.45 مليار دولار أمريكي |
| حجم السوق بحلول عام 2031 | 93.10 مليار دولار أمريكي |
| معدل النمو السنوي المركب العالمي (2023 - 2031) | 18.8% |
| البيانات التاريخية | 2021-2022 |
| فترة التنبؤ | 2024-2031 |
| القطاعات المغطاة | بواسطة الحلول
|
| المناطق والدول المغطاة | أمريكا الشمالية
|
| قادة السوق وملفات تعريف الشركات الرئيسية |
|
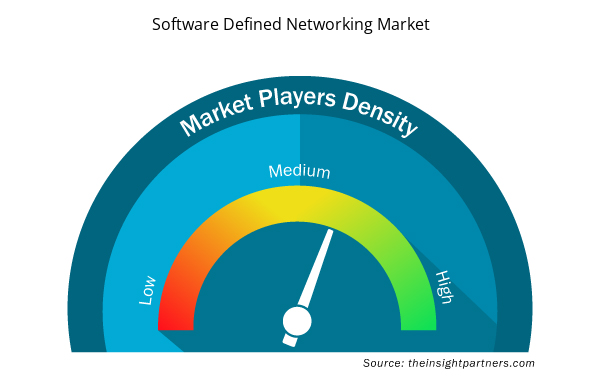
كثافة اللاعبين في سوق الشبكات المحددة بالبرمجيات: فهم تأثيرها على ديناميكيات الأعمال
يشهد سوق الشبكات المحددة بالبرمجيات نموًا سريعًا، مدفوعًا بالطلب المتزايد من المستخدم النهائي بسبب عوامل مثل تفضيلات المستهلكين المتطورة والتقدم التكنولوجي والوعي المتزايد بفوائد المنتج. ومع ارتفاع الطلب، تعمل الشركات على توسيع عروضها والابتكار لتلبية احتياجات المستهلكين والاستفادة من الاتجاهات الناشئة، مما يؤدي إلى زيادة نمو السوق.
تشير كثافة اللاعبين في السوق إلى توزيع الشركات أو المؤسسات العاملة في سوق أو صناعة معينة. وهي تشير إلى عدد المنافسين (اللاعبين في السوق) الموجودين في مساحة سوق معينة نسبة إلى حجمها أو قيمتها السوقية الإجمالية.
الشركات الرئيسية العاملة في سوق الشبكات المحددة بالبرمجيات هي:
- شركة سيسكو سيستمز
- آي بي إم
- شركة هيوليت باكارد لتطوير المشاريع
- برودكوم
- شركة جونيبر نتوركس
- شركة هواوي للتكنولوجيا المحدودة
إخلاء المسؤولية : الشركات المذكورة أعلاه ليست مرتبة بأي ترتيب معين.
- احصل على نظرة عامة على أهم اللاعبين الرئيسيين في سوق الشبكات المحددة بالبرمجيات
أخبار سوق الشبكات المحددة بالبرمجيات والتطورات الأخيرة
يتم تقييم سوق الشبكات المحددة بالبرمجيات من خلال جمع البيانات النوعية والكمية بعد البحث الأولي والثانوي، والذي يتضمن منشورات الشركات المهمة وبيانات الجمعيات وقواعد البيانات. فيما يلي قائمة بالتطورات في السوق:
- في نوفمبر 2023، أعلنت شركة VMware, Inc. عن حلول جديدة وشراكات موسعة لمساعدة العملاء على تسريع التحول الرقمي على الحافة. بناءً على VMware Software-Defined Edge التي تم تقديمها مؤخرًا، ستساعد هذه الابتكارات والتكاملات الجديدة العملاء على تبسيط بيئات الحافة الخاصة بهم وتأمينها بشكل أفضل وتحديثها.
(المصدر: VMware, Inc.، بيان صحفي، 2023)
- في فبراير 2023، أعلنت مجموعة TeraFlowSDN مفتوحة المصدر التابعة لـ ETSI عن الإصدار الثاني من وحدة التحكم TeraFlowSDN، وهي وحدة تحكم وتنظيم SDN مبتكرة وقوية. يوفر الإصدار الثاني من TeraFlowSDN دعمًا موسعًا ومُثبتًا لتقسيم شبكة النقل من البداية إلى النهاية عبر نطاقات شبكة متعددة. يكمل هذا الإصدار تنسيق SDN لتوفير L2/L3VPN وشبكات الميكروويف والتكامل من نقطة إلى عدة نقاط لأجهزة الإرسال والاستقبال الضوئية XR والتفاعل مع وحدات التحكم الضوئية SDN من خلال واجهة برمجة تطبيقات النقل Open Networking Foundation (ONF) (TAPI).
(المصدر: المعهد الأوروبي للمعايير، بيان صحفي، 2022)
تغطية تقرير سوق الشبكات المحددة بالبرمجيات والمنتجات النهائية
يوفر تقرير "حجم سوق الشبكات المحددة بالبرمجيات والتوقعات (2021-2031)" تحليلاً مفصلاً للسوق يغطي المجالات التالية:
- حجم السوق والتوقعات على المستويات العالمية والإقليمية والوطنية لجميع قطاعات السوق الرئيسية التي يغطيها النطاق
- ديناميكيات السوق مثل المحركات والقيود والفرص الرئيسية
- الاتجاهات المستقبلية الرئيسية
- تحليل مفصل لقوى PEST/Porter الخمس وSWOT
- تحليل السوق العالمي والإقليمي الذي يغطي اتجاهات السوق الرئيسية واللاعبين الرئيسيين واللوائح والتطورات الأخيرة في السوق
- تحليل المشهد الصناعي والمنافسة الذي يغطي تركيز السوق، وتحليل خريطة الحرارة، واللاعبين البارزين، والتطورات الأخيرة
- ملفات تعريف الشركة التفصيلية
- التحليل التاريخي (سنتان)، السنة الأساسية، التوقعات (7 سنوات) مع معدل النمو السنوي المركب
- تحليل PEST و SWOT
- حجم السوق والقيمة / الحجم - عالميًا وإقليميًا وقطريًا
- الصناعة والمنافسة
- مجموعة بيانات Excel


Report Coverage
Revenue forecast, Company Analysis, Industry landscape, Growth factors, and Trends

Segment Covered
This text is related
to segments covered.

Regional Scope
North America, Europe, Asia Pacific, Middle East & Africa, South & Central America

Country Scope
This text is related
to country scope.
الأسئلة الشائعة
Growing need to simplify network management organizations and rising demand for cloud services are the major factors that propel the global software defined networking market growth.
The global software defined networking market was estimated to be US$ 29.2 billion in 2024 and is expected to grow at a CAGR of 19.3 % during the forecast period 2025 - 2031.
The growing adoption of IoT and the rising implementation of software defined networking in 5G are the factors that are anticipated to play a significant role in the global software defined networking market in the coming years.
The global software defined networking market is expected to reach US$ 93.10 billion by 2031.
The key players holding majority shares in the global software defined networking market are Cisco Systems, Inc., IBM, Hewlett Packard Enterprise Development LP, Broadcom, Juniper Networks, Inc., Huawei Technologies Co., Ltd., NEC Corporation of America, Dell Inc., Telefonaktiebolaget LM EricssonCiena Corporation.
Trends and growth analysis reports related to Technology, Media and Telecommunications : READ MORE..
The Insight Partners performs research in 4 major stages: Data Collection & Secondary Research, Primary Research, Data Analysis and Data Triangulation & Final Review.
- Data Collection and Secondary Research:
As a market research and consulting firm operating from a decade, we have published and advised several client across the globe. First step for any study will start with an assessment of currently available data and insights from existing reports. Further, historical and current market information is collected from Investor Presentations, Annual Reports, SEC Filings, etc., and other information related to company’s performance and market positioning are gathered from Paid Databases (Factiva, Hoovers, and Reuters) and various other publications available in public domain.
Several associations trade associates, technical forums, institutes, societies and organization are accessed to gain technical as well as market related insights through their publications such as research papers, blogs and press releases related to the studies are referred to get cues about the market. Further, white papers, journals, magazines, and other news articles published in last 3 years are scrutinized and analyzed to understand the current market trends.
- Primary Research:
The primarily interview analysis comprise of data obtained from industry participants interview and answers to survey questions gathered by in-house primary team.
For primary research, interviews are conducted with industry experts/CEOs/Marketing Managers/VPs/Subject Matter Experts from both demand and supply side to get a 360-degree view of the market. The primary team conducts several interviews based on the complexity of the markets to understand the various market trends and dynamics which makes research more credible and precise.
A typical research interview fulfils the following functions:
- Provides first-hand information on the market size, market trends, growth trends, competitive landscape, and outlook
- Validates and strengthens in-house secondary research findings
- Develops the analysis team’s expertise and market understanding
Primary research involves email interactions and telephone interviews for each market, category, segment, and sub-segment across geographies. The participants who typically take part in such a process include, but are not limited to:
- Industry participants: VPs, business development managers, market intelligence managers and national sales managers
- Outside experts: Valuation experts, research analysts and key opinion leaders specializing in the electronics and semiconductor industry.
Below is the breakup of our primary respondents by company, designation, and region:

Once we receive the confirmation from primary research sources or primary respondents, we finalize the base year market estimation and forecast the data as per the macroeconomic and microeconomic factors assessed during data collection.
- Data Analysis:
Once data is validated through both secondary as well as primary respondents, we finalize the market estimations by hypothesis formulation and factor analysis at regional and country level.
- Macro-Economic Factor Analysis:
We analyse macroeconomic indicators such the gross domestic product (GDP), increase in the demand for goods and services across industries, technological advancement, regional economic growth, governmental policies, the influence of COVID-19, PEST analysis, and other aspects. This analysis aids in setting benchmarks for various nations/regions and approximating market splits. Additionally, the general trend of the aforementioned components aid in determining the market's development possibilities.
- Country Level Data:
Various factors that are especially aligned to the country are taken into account to determine the market size for a certain area and country, including the presence of vendors, such as headquarters and offices, the country's GDP, demand patterns, and industry growth. To comprehend the market dynamics for the nation, a number of growth variables, inhibitors, application areas, and current market trends are researched. The aforementioned elements aid in determining the country's overall market's growth potential.
- Company Profile:
The “Table of Contents” is formulated by listing and analyzing more than 25 - 30 companies operating in the market ecosystem across geographies. However, we profile only 10 companies as a standard practice in our syndicate reports. These 10 companies comprise leading, emerging, and regional players. Nonetheless, our analysis is not restricted to the 10 listed companies, we also analyze other companies present in the market to develop a holistic view and understand the prevailing trends. The “Company Profiles” section in the report covers key facts, business description, products & services, financial information, SWOT analysis, and key developments. The financial information presented is extracted from the annual reports and official documents of the publicly listed companies. Upon collecting the information for the sections of respective companies, we verify them via various primary sources and then compile the data in respective company profiles. The company level information helps us in deriving the base number as well as in forecasting the market size.
- Developing Base Number:
Aggregation of sales statistics (2020-2022) and macro-economic factor, and other secondary and primary research insights are utilized to arrive at base number and related market shares for 2022. The data gaps are identified in this step and relevant market data is analyzed, collected from paid primary interviews or databases. On finalizing the base year market size, forecasts are developed on the basis of macro-economic, industry and market growth factors and company level analysis.
- Data Triangulation and Final Review:
The market findings and base year market size calculations are validated from supply as well as demand side. Demand side validations are based on macro-economic factor analysis and benchmarks for respective regions and countries. In case of supply side validations, revenues of major companies are estimated (in case not available) based on industry benchmark, approximate number of employees, product portfolio, and primary interviews revenues are gathered. Further revenue from target product/service segment is assessed to avoid overshooting of market statistics. In case of heavy deviations between supply and demand side values, all thes steps are repeated to achieve synchronization.
We follow an iterative model, wherein we share our research findings with Subject Matter Experts (SME’s) and Key Opinion Leaders (KOLs) until consensus view of the market is not formulated – this model negates any drastic deviation in the opinions of experts. Only validated and universally acceptable research findings are quoted in our reports.
We have important check points that we use to validate our research findings – which we call – data triangulation, where we validate the information, we generate from secondary sources with primary interviews and then we re-validate with our internal data bases and Subject matter experts. This comprehensive model enables us to deliver high quality, reliable data in shortest possible time.
 احصل على عينة مجانية لهذا التقرير