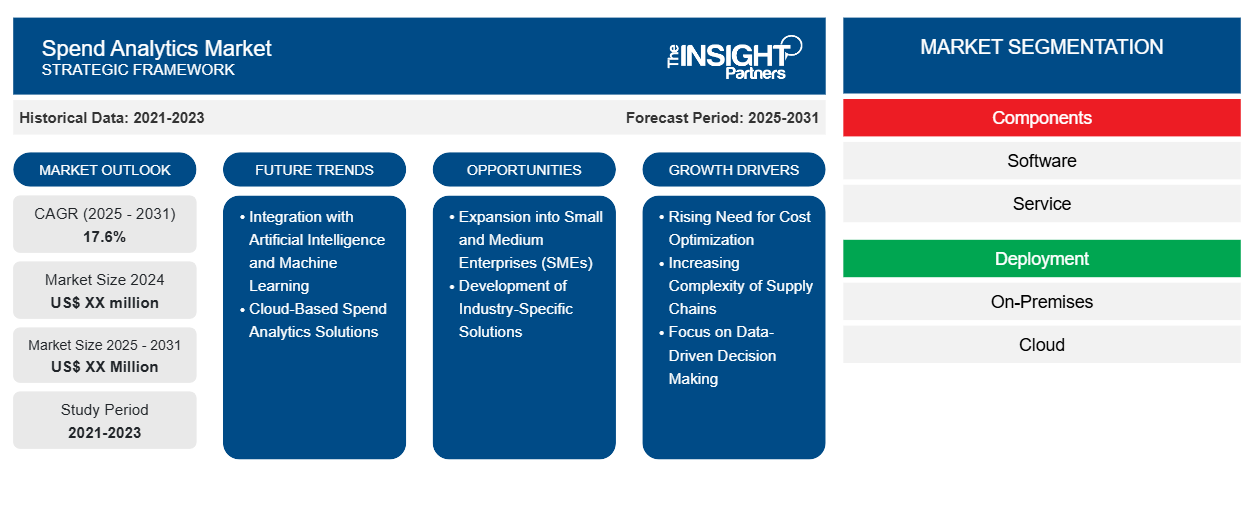
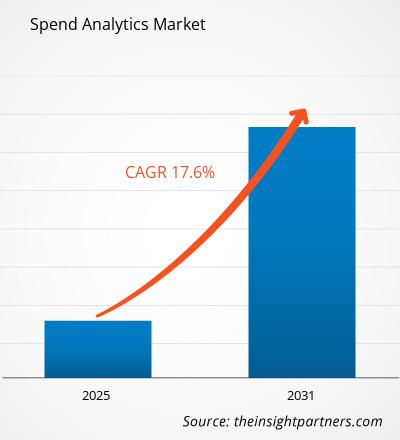
من المتوقع أن يسجل سوق تحليلات الإنفاق معدل نمو سنوي مركب بنسبة 17.6٪ من عام 2025 إلى عام 2031، مع توسع حجم السوق من XX مليون دولار أمريكي في عام 2024 إلى XX مليون دولار أمريكي بحلول عام 2031.
يُقسّم التقرير حسب المكونات (البرمجيات، الخدمات)، والنشر (محليًا، سحابيًا)، والتحليل (وصفي، توجيهي، تنبؤي)، وقطاع المستخدم النهائي (التصنيع، التجزئة، الخدمات المصرفية والمالية والتأمين، تكنولوجيا المعلومات والاتصالات، التعليم، الرعاية الصحية، وغيرها)؛ والجغرافيا (أمريكا الشمالية، أوروبا، آسيا والمحيط الهادئ، الشرق الأوسط وأفريقيا، أمريكا الجنوبية والوسطى). ويُفصّل
التحليل العالمي بشكل أكبر على المستوى الإقليمي والدول الرئيسية. ويُقدّم التقرير القيمة بالدولار الأمريكي للتحليل والقطاعات المذكورة أعلاه.
غرض التقرير
يهدف تقرير "سوق تحليلات الإنفاق" الصادر عن "ذا إنسايت بارتنرز" إلى وصف المشهد الحالي والنمو المستقبلي، وأهم العوامل المحفزة، والتحديات، والفرص المتاحة. وسيوفر هذا التقرير رؤى ثاقبة لمختلف أصحاب المصلحة في قطاع الأعمال، مثل:
- مزودي التكنولوجيا/المصنعين: لفهم ديناميكيات السوق المتطورة ومعرفة فرص النمو المحتملة، وتمكينهم من اتخاذ قرارات استراتيجية مستنيرة.
- المستثمرون: إجراء تحليل شامل للاتجاهات فيما يتعلق بمعدل نمو السوق، والتوقعات المالية للسوق، والفرص المتاحة عبر سلسلة القيمة.
- الهيئات التنظيمية: لتنظيم السياسات ومراقبة الأنشطة في السوق بهدف تقليل الانتهاكات والحفاظ على ثقة المستثمرين ودعم سلامة السوق واستقرارها.
تجزئة سوق تحليلات الإنفاق
عناصر
- برمجة
- خدمة
النشر
- في الموقع
- سحاب
تحليل
- وصفي
- وصفي
- تنبؤي
صناعة المستخدم النهائي
- تصنيع
- بيع بالتجزئة
- الخدمات المصرفية والمالية والتأمين
- تكنولوجيا المعلومات والاتصالات
- تعليم
- الرعاية الصحية
قم بتخصيص هذا التقرير ليناسب متطلباتك
ستحصل على تخصيص لأي تقرير - مجانًا - بما في ذلك أجزاء من هذا التقرير، أو تحليل على مستوى الدولة، وحزمة بيانات Excel، بالإضافة إلى الاستفادة من العروض والخصومات الرائعة للشركات الناشئة والجامعات
سوق تحليلات الإنفاق: رؤى استراتيجية
- احصل على أهم اتجاهات السوق الرئيسية لهذا التقرير.ستتضمن هذه العينة المجانية تحليل البيانات، بدءًا من اتجاهات السوق وحتى التقديرات والتوقعات.
عوامل نمو سوق تحليلات الإنفاق
- الحاجة المتزايدة لتحسين التكاليف: تواجه المؤسسات ضغوطًا مستمرة لتعزيز الربحية وخفض التكاليف. يوفر تحليل الإنفاق رؤىً ثاقبة حول أنماط الإنفاق، مما يُمكّن الشركات من تحديد المجالات التي يُمكنها فيها خفض التكاليف وتحسين الكفاءة التشغيلية. من خلال تحليل بيانات المشتريات، يُمكن للمؤسسات التفاوض على عقود أفضل، والتخلص من النفقات غير الضرورية، واتخاذ قرارات مدروسة بشأن إدارة الموردين. يُعدّ هذا التركيز على تحسين التكاليف مُحفّزًا رئيسيًا لنمو سوق تحليل الإنفاق.
- تزايد تعقيد سلاسل التوريد: أصبحت سلاسل التوريد العالمية اليوم أكثر تعقيدًا من أي وقت مضى، مع تعدد الموردين وتنوع قنوات الشراء. يُصعّب هذا التعقيد على المؤسسات رصد إنفاقها وأداء مورديها. تُساعد أدوات تحليل الإنفاق المؤسسات على تجميع البيانات وتحليلها من مصادر مُختلفة، مُوفرةً بذلك رؤية شاملة للنفقات وعلاقات الموردين. وتُعزّز الحاجة إلى تحسين رؤية وإدارة سلاسل التوريد المُعقدة الطلب على حلول تحليل الإنفاق.
- التركيز على اتخاذ القرارات المستندة إلى البيانات: مع تزايد اعتماد المؤسسات على الاستراتيجيات المستندة إلى البيانات، يتزايد الطلب على أدوات التحليلات التي توفر رؤى عملية. تُمكّن حلول تحليلات الإنفاق الشركات من الاستفادة من بيانات الإنفاق التاريخية لتحديد الاتجاهات، والتنبؤ بالإنفاق المستقبلي، ودعم قرارات التوريد الاستراتيجية. يُعدّ التحوّل نحو اتخاذ القرارات المستندة إلى البيانات محركًا رئيسيًا لسوق تحليلات الإنفاق، حيث تُدرك المؤسسات أهمية استخدام البيانات لتحسين استراتيجيات الشراء والأداء العام للأعمال.
اتجاهات مستقبل سوق تحليلات الإنفاق
- التكامل مع الذكاء الاصطناعي والتعلم الآلي: يُعدّ دمج تقنيات الذكاء الاصطناعي والتعلم الآلي في حلول تحليلات الإنفاق توجهًا متزايدًا. تُحسّن هذه التقنيات من قدرة أدوات تحليلات الإنفاق من خلال أتمتة تحليل البيانات، وتحديد الأنماط، وتوفير رؤى تنبؤية. ويمكن للذكاء الاصطناعي والتعلم الآلي مساعدة المؤسسات على كشف أنماط الإنفاق الخفية والاختلالات، مما يُمكّن من وضع تنبؤات أكثر دقة واتخاذ قرارات استراتيجية. يُحفّز هذا التوجه الابتكار في سوق تحليلات الإنفاق، مما يجعل الحلول أكثر تطورًا وسهولة في الاستخدام.
- حلول تحليلات الإنفاق السحابية: يُحدث اعتماد تقنية السحابة تحولاً جذرياً في كيفية تطبيق المؤسسات لتحليلات الإنفاق. توفر الحلول السحابية قابلية التوسع والمرونة والفعالية من حيث التكلفة، مما يجعلها جذابة للشركات بمختلف أحجامها. ويتزايد إقبال المؤسسات على منصات تحليلات الإنفاق SaaS (البرمجيات كخدمة) التي تتيح التعاون الفوري، والتكامل الأسهل مع الأنظمة الحالية، وتكاليف أولية أقل. ومن المتوقع أن يستمر هذا التوجه نحو الحلول السحابية مع سعي المؤسسات إلى تعزيز قدراتها التحليلية دون الحاجة إلى إدارة البنية التحتية المحلية.
فرص سوق تحليلات الإنفاق
- التوسع في الشركات الصغيرة والمتوسطة: في حين أن الشركات الكبيرة كانت تقليديًا الأكثر استخدامًا لحلول تحليلات الإنفاق، إلا أن هناك فرصة كبيرة لاستهداف الشركات الصغيرة والمتوسطة. بدأت العديد من هذه الشركات تُدرك أهمية استراتيجيات الشراء القائمة على البيانات، إلا أنها قد تفتقر إلى الموارد أو الخبرة اللازمة لتطبيق أنظمة تحليلات معقدة. يمكن للموردين الذين يقدمون حلول تحليلات إنفاق ميسورة التكلفة وسهلة الاستخدام، ومصممة خصيصًا لتلبية احتياجات الشركات الصغيرة والمتوسطة، الاستفادة من هذه الشريحة السوقية التي تعاني من نقص الخدمات.
- تطوير حلول خاصة بالقطاعات: لكل قطاع تحديات ومتطلبات مشتريات فريدة. هناك فرصة للموردين لتطوير حلول تحليلية للإنفاق خاصة بالقطاعات، تلبي الاحتياجات المحددة لقطاعات مثل الرعاية الصحية، والتصنيع، وتجارة التجزئة، والخدمات اللوجستية. من خلال توفير حلول مخصصة تُعالج التحديات الفريدة التي تواجهها هذه القطاعات، يمكن للموردين التميز في سوق تنافسية وبناء علاقات قوية مع العملاء.
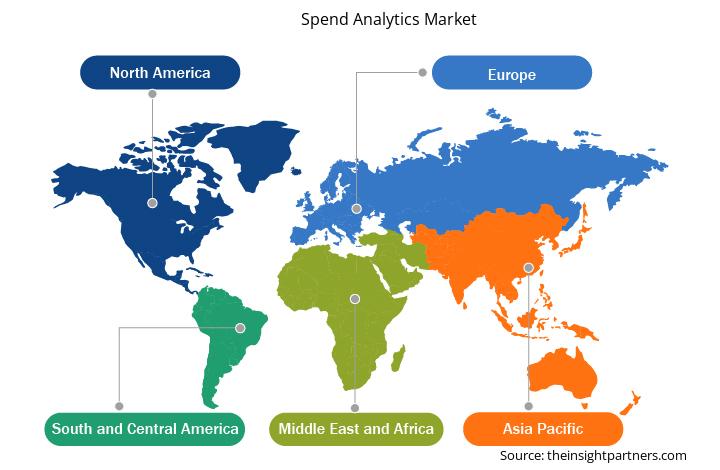
رؤى إقليمية حول سوق تحليلات الإنفاق
قام محللو إنسايت بارتنرز بشرح شامل للاتجاهات والعوامل الإقليمية المؤثرة في سوق تحليلات الإنفاق خلال فترة التوقعات. ويناقش هذا القسم أيضًا قطاعات سوق تحليلات الإنفاق ومناطقها الجغرافية في أمريكا الشمالية، وأوروبا، وآسيا والمحيط الهادئ، والشرق الأوسط وأفريقيا، وأمريكا الجنوبية والوسطى.
- احصل على بيانات إقليمية محددة لسوق تحليلات الإنفاق
نطاق تقرير سوق تحليلات الإنفاق
| سمة التقرير | تفاصيل |
|---|---|
| حجم السوق في عام 2024 | XX مليون دولار أمريكي |
| حجم السوق بحلول عام 2031 | XX مليون دولار أمريكي |
| معدل النمو السنوي المركب العالمي (2025 - 2031) | 17.6% |
| البيانات التاريخية | 2021-2023 |
| فترة التنبؤ | 2025-2031 |
| القطاعات المغطاة | حسب المكونات
|
| المناطق والدول المغطاة | أمريكا الشمالية
|
| قادة السوق وملفات تعريف الشركات الرئيسية |
|
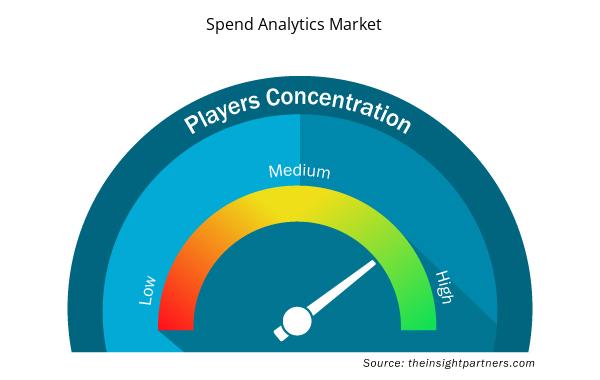
كثافة اللاعبين في سوق تحليلات الإنفاق: فهم تأثيرها على ديناميكيات الأعمال
يشهد سوق تحليلات الإنفاق نموًا سريعًا، مدفوعًا بتزايد طلب المستخدم النهائي نتيجةً لعوامل مثل تطور تفضيلات المستهلكين، والتقدم التكنولوجي، وزيادة الوعي بمزايا المنتج. ومع تزايد الطلب، تعمل الشركات على توسيع عروضها، والابتكار لتلبية احتياجات المستهلكين، والاستفادة من الاتجاهات الناشئة، مما يعزز نمو السوق.
تشير كثافة اللاعبين في السوق إلى توزيع الشركات العاملة في سوق أو قطاع معين. وتشير إلى عدد المنافسين (اللاعبين في السوق) الموجودين في سوق معين نسبةً إلى حجمه أو قيمته السوقية الإجمالية.
الشركات الرئيسية العاملة في سوق تحليلات الإنفاق هي:
- شركة آي بي إم
- معهد SAS
- شركة جاغاير
- SAP SE
- برنامج كوبا
- شركة بروأكتيس
إخلاء المسؤولية : الشركات المذكورة أعلاه ليست مرتبة بأي ترتيب معين.
- احصل على نظرة عامة على أهم اللاعبين الرئيسيين في سوق تحليلات الإنفاق
نقاط البيع الرئيسية
- التغطية الشاملة: يغطي التقرير بشكل شامل تحليل المنتجات والخدمات والأنواع والمستخدمين النهائيين لسوق تحليلات الإنفاق، مما يوفر مشهدًا شاملاً.
- تحليل الخبراء: تم تجميع التقرير على أساس الفهم العميق لخبراء الصناعة والمحللين.
- معلومات محدثة: يضمن التقرير أهمية الأعمال التجارية بسبب تغطيته للمعلومات الحديثة واتجاهات البيانات.
- خيارات التخصيص: يمكن تخصيص هذا التقرير لتلبية متطلبات العملاء المحددة وتلبية استراتيجيات العمل بشكل مناسب.
لذا، يُمكن لتقرير البحث حول سوق تحليلات الإنفاق أن يُساعد في تمهيد الطريق لفهم سيناريوهات القطاع وآفاق نموه. ورغم وجود بعض المخاوف المُبررة، إلا أن فوائد هذا التقرير الإجمالية تفوق عيوبه.
- التحليل التاريخي (سنتان)، السنة الأساسية، التوقعات (7 سنوات) مع معدل النمو السنوي المركب
- تحليل PEST و SWOT
- حجم السوق والقيمة / الحجم - عالميًا وإقليميًا وقطريًا
- الصناعة والمنافسة
- مجموعة بيانات Excel


- Quantitative Structure-Activity Relationship (QSAR) Market
- UV Curing System Market
- Energy Recovery Ventilator Market
- Aerosol Paints Market
- Employment Screening Services Market
- Automotive Fabric Market
- Identity Verification Market
- Nitrogenous Fertilizer Market
- Electronic Shelf Label Market
- Terahertz Technology Market

Report Coverage
Revenue forecast, Company Analysis, Industry landscape, Growth factors, and Trends

Segment Covered
This text is related
to segments covered.

Regional Scope
North America, Europe, Asia Pacific, Middle East & Africa, South & Central America

Country Scope
This text is related
to country scope.
الأسئلة الشائعة
Some of the customization options available based on the request are an additional 3–5 company profiles and country-specific analysis of 3–5 countries of your choice. Customizations are to be requested/discussed before making final order confirmation# as our team would review the same and check the feasibility
The report can be delivered in PDF/PPT format; we can also share excel dataset based on the request
Integration with Artificial Intelligence and Cloud-Based Spend Analytics Solutions are anticipated to play a significant role in the global Spend Analytics Market in the coming years
Rising Need for Cost Optimization, Increasing Complexity of Supply Chains, and Focus on Data-Driven Decision Making are the major factors driving the Spend Analytics Market
The global Spend Analytics Market is expected to grow at a CAGR of 17.6% during the forecast period 2024 - 2031
Trends and growth analysis reports related to Technology, Media and Telecommunications : READ MORE..
The Insight Partners performs research in 4 major stages: Data Collection & Secondary Research, Primary Research, Data Analysis and Data Triangulation & Final Review.
- Data Collection and Secondary Research:
As a market research and consulting firm operating from a decade, we have published and advised several client across the globe. First step for any study will start with an assessment of currently available data and insights from existing reports. Further, historical and current market information is collected from Investor Presentations, Annual Reports, SEC Filings, etc., and other information related to company’s performance and market positioning are gathered from Paid Databases (Factiva, Hoovers, and Reuters) and various other publications available in public domain.
Several associations trade associates, technical forums, institutes, societies and organization are accessed to gain technical as well as market related insights through their publications such as research papers, blogs and press releases related to the studies are referred to get cues about the market. Further, white papers, journals, magazines, and other news articles published in last 3 years are scrutinized and analyzed to understand the current market trends.
- Primary Research:
The primarily interview analysis comprise of data obtained from industry participants interview and answers to survey questions gathered by in-house primary team.
For primary research, interviews are conducted with industry experts/CEOs/Marketing Managers/VPs/Subject Matter Experts from both demand and supply side to get a 360-degree view of the market. The primary team conducts several interviews based on the complexity of the markets to understand the various market trends and dynamics which makes research more credible and precise.
A typical research interview fulfils the following functions:
- Provides first-hand information on the market size, market trends, growth trends, competitive landscape, and outlook
- Validates and strengthens in-house secondary research findings
- Develops the analysis team’s expertise and market understanding
Primary research involves email interactions and telephone interviews for each market, category, segment, and sub-segment across geographies. The participants who typically take part in such a process include, but are not limited to:
- Industry participants: VPs, business development managers, market intelligence managers and national sales managers
- Outside experts: Valuation experts, research analysts and key opinion leaders specializing in the electronics and semiconductor industry.
Below is the breakup of our primary respondents by company, designation, and region:

Once we receive the confirmation from primary research sources or primary respondents, we finalize the base year market estimation and forecast the data as per the macroeconomic and microeconomic factors assessed during data collection.
- Data Analysis:
Once data is validated through both secondary as well as primary respondents, we finalize the market estimations by hypothesis formulation and factor analysis at regional and country level.
- Macro-Economic Factor Analysis:
We analyse macroeconomic indicators such the gross domestic product (GDP), increase in the demand for goods and services across industries, technological advancement, regional economic growth, governmental policies, the influence of COVID-19, PEST analysis, and other aspects. This analysis aids in setting benchmarks for various nations/regions and approximating market splits. Additionally, the general trend of the aforementioned components aid in determining the market's development possibilities.
- Country Level Data:
Various factors that are especially aligned to the country are taken into account to determine the market size for a certain area and country, including the presence of vendors, such as headquarters and offices, the country's GDP, demand patterns, and industry growth. To comprehend the market dynamics for the nation, a number of growth variables, inhibitors, application areas, and current market trends are researched. The aforementioned elements aid in determining the country's overall market's growth potential.
- Company Profile:
The “Table of Contents” is formulated by listing and analyzing more than 25 - 30 companies operating in the market ecosystem across geographies. However, we profile only 10 companies as a standard practice in our syndicate reports. These 10 companies comprise leading, emerging, and regional players. Nonetheless, our analysis is not restricted to the 10 listed companies, we also analyze other companies present in the market to develop a holistic view and understand the prevailing trends. The “Company Profiles” section in the report covers key facts, business description, products & services, financial information, SWOT analysis, and key developments. The financial information presented is extracted from the annual reports and official documents of the publicly listed companies. Upon collecting the information for the sections of respective companies, we verify them via various primary sources and then compile the data in respective company profiles. The company level information helps us in deriving the base number as well as in forecasting the market size.
- Developing Base Number:
Aggregation of sales statistics (2020-2022) and macro-economic factor, and other secondary and primary research insights are utilized to arrive at base number and related market shares for 2022. The data gaps are identified in this step and relevant market data is analyzed, collected from paid primary interviews or databases. On finalizing the base year market size, forecasts are developed on the basis of macro-economic, industry and market growth factors and company level analysis.
- Data Triangulation and Final Review:
The market findings and base year market size calculations are validated from supply as well as demand side. Demand side validations are based on macro-economic factor analysis and benchmarks for respective regions and countries. In case of supply side validations, revenues of major companies are estimated (in case not available) based on industry benchmark, approximate number of employees, product portfolio, and primary interviews revenues are gathered. Further revenue from target product/service segment is assessed to avoid overshooting of market statistics. In case of heavy deviations between supply and demand side values, all thes steps are repeated to achieve synchronization.
We follow an iterative model, wherein we share our research findings with Subject Matter Experts (SME’s) and Key Opinion Leaders (KOLs) until consensus view of the market is not formulated – this model negates any drastic deviation in the opinions of experts. Only validated and universally acceptable research findings are quoted in our reports.
We have important check points that we use to validate our research findings – which we call – data triangulation, where we validate the information, we generate from secondary sources with primary interviews and then we re-validate with our internal data bases and Subject matter experts. This comprehensive model enables us to deliver high quality, reliable data in shortest possible time.
 احصل على عينة مجانية لهذا التقرير