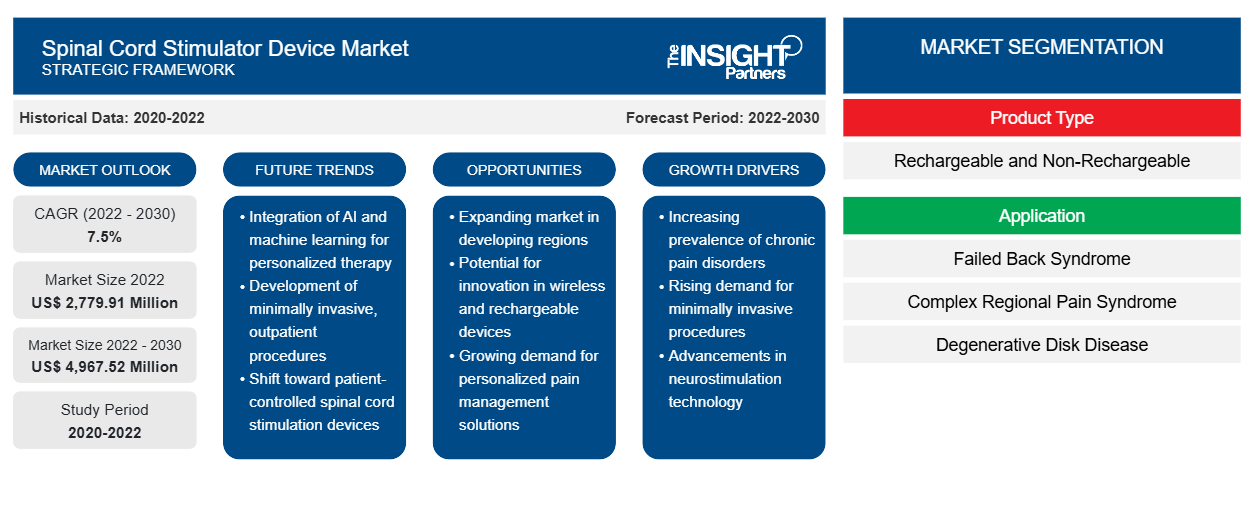
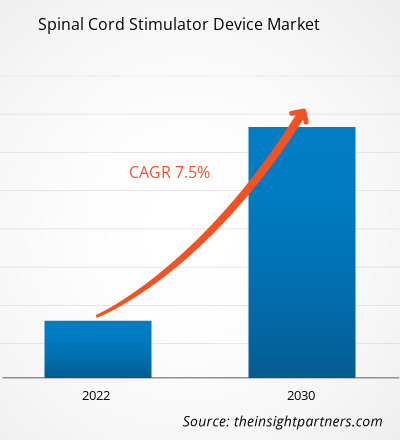
[تقرير بحثي] من المتوقع أن ينمو سوق جهاز تحفيز النخاع الشوكي من 2،779.91 مليون دولار أمريكي في عام 2022 إلى 4،967.52 مليون دولار أمريكي بحلول عام 2030؛ ومن المتوقع أن يسجل معدل نمو سنوي مركب بنسبة 7.5٪ من عام 2022 إلى عام 2030.
رؤى السوق ووجهة نظر المحلل:
جهاز تحفيز النخاع الشوكي هو جهاز مزروع يخفف الألم عن طريق نقل إشارات كهربائية منخفضة المستوى مباشرة إلى النخاع الشوكي. يستخدم هذا الجهاز في الغالب بعد فشل علاجات الألم غير الجراحية في توفير الراحة الكافية. بالإضافة إلى ذلك، يمكن للجهاز تحسين جودة الحياة والنوم بشكل عام. نظرًا لأنه يُوصف عادةً مع علاجات إدارة الألم الأخرى، فإنه يقمع بشكل فعال الحاجة إلى أدوية الألم. يتوسع حجم سوق جهاز تحفيز النخاع الشوكي مع العدد المتزايد من إصابات النخاع الشوكي وتوافر العلاجات المبتكرة.
محركات النمو والتحديات:
وفقًا للمكتبة الوطنية للطب (NLM)، يعاني ما يقرب من 250.000-500.000 مريض من إصابات الحبل الشوكي (SCIs) كل عام في جميع أنحاء العالم. وفقًا لتقرير نشرته جمعية أبحاث إصابات العمود الفقري وإعادة التأهيل وإعادة الدمج (Aspire، المملكة المتحدة)، يتم تشخيص إصابة حوالي 2500 شخص بإصابات الحبل الشوكي سنويًا في المملكة المتحدة. حاليًا، يعيش حوالي 50.000 شخص بهذه الإصابات في المملكة المتحدة. يقدر المركز الوطني لإحصاءات إصابات الحبل الشوكي (NSCISC) أن حوالي 320.000 شخص يعيشون مع إصابات الحبل الشوكي الرضحية في الولايات المتحدة. يُعزى العدد المرتفع من الحالات إلى ظهور مسابقات موتوكروس والدراجات النارية كأكثر الأنشطة الرياضية شعبية في جميع أنحاء العالم، وفقًا لتقرير المعهد الوطني للصحة (NIH).
علاوة على ذلك، فإن هذه الإصابات شائعة بين كبار السن. ووفقًا للبيانات المقدمة في إطار مجموعة مؤشرات التنمية التي جمعها البنك الدولي في عام 2022، فإن 22.41% من السكان في ألمانيا تزيد أعمارهم عن 65 عامًا. يذكر مقال نشرته MDPI أن معدل انتشار إصابات الحبل الشوكي الرضحية يبلغ حوالي 500 لكل مليون نسمة، ويرتفع معدل الإصابة إلى 13 لكل مليون على مستوى العالم.
إن إصابات الحبل الشوكي لها تأثيرات تغير حياة المرضى المصابين وأسرهم. إن ارتفاع معدل الإصابة بإصابات الحبل الشوكي والعلاج المقابل للمرضى في المستشفيات يتبعه إعادة دخول المريض إلى المستشفى مرة واحدة على الأقل كل عام. وذلك لأن إصابات الحبل الشوكي لا يتم علاجها على الفور. وتشمل أسباب إعادة الدخول إلى المستشفى التهابات الجهاز التنفسي والجهاز البولي والكسور التي تحدث أثناء ممارسة الأنشطة الرياضية للدراجات النارية. ومع ارتفاع معدل الإصابة بإصابات الحبل الشوكي وتوافر البنية التحتية المتطورة في مراكز العلاج التي تقدم برامج إعادة التأهيل، فإن الطلب على أجهزة تحفيز الحبل الشوكي يتزايد في المراكز المتخصصة أو مراكز إعادة التأهيل، مما يغذي نمو جهاز تحفيز الحبل الشوكي.
قم بتخصيص هذا التقرير ليناسب متطلباتك
ستحصل على تخصيص لأي تقرير - مجانًا - بما في ذلك أجزاء من هذا التقرير، أو تحليل على مستوى الدولة، وحزمة بيانات Excel، بالإضافة إلى الاستفادة من العروض والخصومات الرائعة للشركات الناشئة والجامعات
- احصل على أهم اتجاهات السوق الرئيسية لهذا التقرير.ستتضمن هذه العينة المجانية تحليلاً للبيانات، بدءًا من اتجاهات السوق وحتى التقديرات والتوقعات.
تقسيم التقرير ونطاقه:
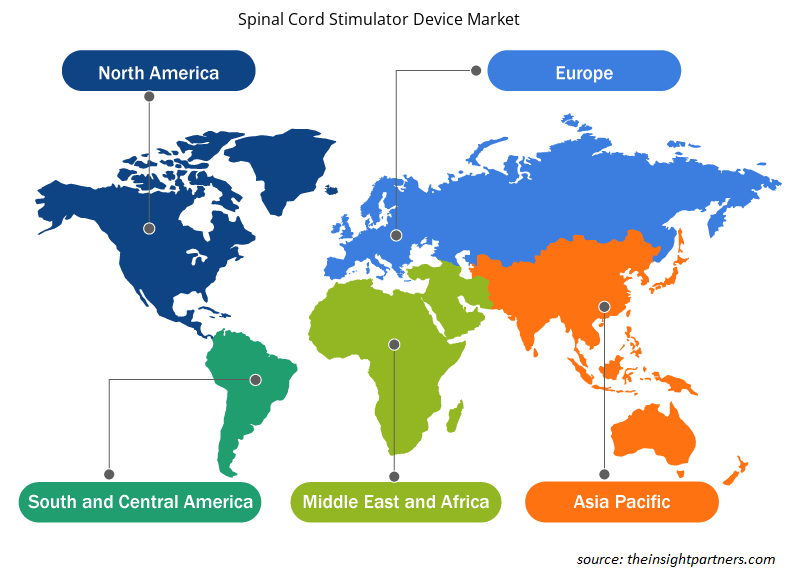
ينقسم سوق جهاز تحفيز النخاع الشوكي بناءً على نوع المنتج والتطبيق والمستخدم النهائي والجغرافيا. بناءً على نوع المنتج، ينقسم سوق جهاز تحفيز النخاع الشوكي إلى قابل لإعادة الشحن وغير قابل لإعادة الشحن. يتم تقسيم سوق جهاز تحفيز النخاع الشوكي بناءً على التطبيق إلى متلازمة فشل الظهر ومتلازمة الألم الإقليمي المعقد ومرض القرص التنكسي وغيرها. من حيث المستخدم النهائي، يتم تصنيف السوق إلى المستشفيات ومراكز الجراحة الخارجية وغيرها. بناءً على الجغرافيا، يتم تقسيم سوق جهاز تحفيز النخاع الشوكي إلى أمريكا الشمالية (الولايات المتحدة وكندا والمكسيك) وأوروبا (المملكة المتحدة وألمانيا وفرنسا وإيطاليا وإسبانيا وروسيا وبقية أوروبا) وآسيا والمحيط الهادئ (الصين واليابان والهند وكوريا الجنوبية وأستراليا وجنوب شرق آسيا وبقية آسيا والمحيط الهادئ) والشرق الأوسط وأفريقيا (الإمارات العربية المتحدة والمملكة العربية السعودية وجنوب إفريقيا وبقية الشرق الأوسط وأفريقيا) وأمريكا الجنوبية والوسطى (البرازيل والأرجنتين وبقية أمريكا الجنوبية والوسطى).
التحليل القطاعي:
يتم تقسيم سوق أجهزة تحفيز النخاع الشوكي بناءً على التطبيق إلى متلازمة فشل الظهر ومتلازمة الألم الإقليمي المعقد ومرض القرص التنكسي وغيرها. احتل قطاع متلازمة الألم الإقليمي المعقد أكبر حصة سوقية في عام 2022. ومن المتوقع أن يسجل أعلى معدل نمو سنوي مركب خلال الفترة 2022-2030. تتضمن متلازمة الألم الإقليمي المعقد (CRPS) ألمًا والتهابًا مطولًا يحدث بسبب إصابة أو أحداث طبية أخرى مثل الجراحة والصدمات والسكتة الدماغية والنوبة القلبية. يمكن أن تحدث متلازمة الألم الإقليمي المعقد (CRPS) في أي مكان في الجسم، وعادة ما تؤثر على الذراع أو الساق أو اليد أو القدم. من المرجح أن تحدث لأي شخص في أي عمر، مع اقتراب الالتهاب من ذروته بعد 40 عامًا. تحدث معظم حالات متلازمة الألم الإقليمي المعقد (CRPS) بسبب تلف أو سوء عمل ألياف الأعصاب الطرفية الصغيرة من الألياف C، والتي تحمل إشارات الألم إلى الدماغ. غالبًا ما تظل متلازمة الألم الإقليمي المعقد (CRPS) غير مشخصة مع تطور جلطات صغيرة، مما يؤدي أحيانًا إلى منع تدفق الدم إلى الأعصاب وإصابتها.
سوق أجهزة تحفيز النخاع الشوكي حسب التطبيق – 2022 و2030
التحليل الإقليمي:
بناءً على الجغرافيا، ينقسم سوق جهاز تحفيز النخاع الشوكي إلى أمريكا الشمالية وأوروبا وآسيا والمحيط الهادئ والشرق الأوسط وأفريقيا وأمريكا الجنوبية والوسطى. أمريكا الشمالية هي المساهم الأكبر في نمو سوق جهاز تحفيز النخاع الشوكي العالمي. ومن المتوقع أن تسجل منطقة آسيا والمحيط الهادئ أعلى معدل نمو سنوي مركب في سوق جهاز تحفيز النخاع الشوكي من عام 2022 إلى عام 2030. يرتبط ارتفاع معدل إصابات النخاع الشوكي باستمرار بنمو هذا السوق. حاليًا، تشكل إصابات النخاع الشوكي عبئًا صحيًا كبيرًا في دول أمريكا الشمالية. وفقًا لشركة Spinal Cord Inc.، يعاني حوالي 18000 شخص في الولايات المتحدة من هذه الإصابات كل عام.
رؤى إقليمية حول سوق أجهزة تحفيز النخاع الشوكي
لقد قام المحللون في Insight Partners بشرح الاتجاهات والعوامل الإقليمية المؤثرة على سوق أجهزة تحفيز الحبل الشوكي طوال فترة التوقعات بشكل شامل. يناقش هذا القسم أيضًا قطاعات سوق أجهزة تحفيز الحبل الشوكي والجغرافيا في جميع أنحاء أمريكا الشمالية وأوروبا ومنطقة آسيا والمحيط الهادئ والشرق الأوسط وأفريقيا وأمريكا الجنوبية والوسطى.

- احصل على البيانات الإقليمية المحددة لسوق أجهزة تحفيز النخاع الشوكي
نطاق تقرير سوق جهاز تحفيز النخاع الشوكي
| سمة التقرير | تفاصيل |
|---|---|
| حجم السوق في عام 2022 | 2,779.91 مليون دولار أمريكي |
| حجم السوق بحلول عام 2030 | 4,967.52 مليون دولار أمريكي |
| معدل النمو السنوي المركب العالمي (2022 - 2030) | 7.5% |
| البيانات التاريخية | 2020-2022 |
| فترة التنبؤ | 2022-2030 |
| القطاعات المغطاة | حسب نوع المنتج
|
| المناطق والدول المغطاة | أمريكا الشمالية
|
| قادة السوق وملفات تعريف الشركات الرئيسية |
|
كثافة اللاعبين في السوق: فهم تأثيرها على ديناميكيات الأعمال
يشهد سوق أجهزة تحفيز النخاع الشوكي نموًا سريعًا، مدفوعًا بالطلب المتزايد من جانب المستخدم النهائي بسبب عوامل مثل تفضيلات المستهلكين المتطورة والتقدم التكنولوجي والوعي المتزايد بفوائد المنتج. ومع ارتفاع الطلب، تعمل الشركات على توسيع عروضها والابتكار لتلبية احتياجات المستهلكين والاستفادة من الاتجاهات الناشئة، مما يؤدي إلى زيادة نمو السوق.
تشير كثافة اللاعبين في السوق إلى توزيع الشركات أو المؤسسات العاملة في سوق أو صناعة معينة. وهي تشير إلى عدد المنافسين (اللاعبين في السوق) الموجودين في مساحة سوق معينة نسبة إلى حجمها أو قيمتها السوقية الإجمالية.
الشركات الرئيسية العاملة في سوق جهاز تحفيز النخاع الشوكي هي:
- شركة بوسطن العلمية
- شركة نيفرو
- مختبرات أبوت
- شركة سيرتيك الطبية
- شركة ميدترونيك المحدودة
إخلاء المسؤولية : الشركات المذكورة أعلاه ليست مرتبة بأي ترتيب معين.

- احصل على نظرة عامة على أفضل اللاعبين الرئيسيين في سوق أجهزة تحفيز النخاع الشوكي
تطورات الصناعة والفرص المستقبلية:
يتم سرد المبادرات الرئيسية التي اتخذها كبار اللاعبين العاملين في سوق جهاز تحفيز النخاع الشوكي أدناه:
- في أغسطس 2022، حصلت شركة Abbott Laboratories على موافقة إدارة الغذاء والدواء الأمريكية على نظام Proclaim Plus SCS لعلاج الألم المزمن. تتيح تقنية التحفيز BurstDR للجهاز تقديم تخفيف فائق للألم. كما يوفر علاج FlexBurst360 الذي يوفر تغطية للألم عبر الجذع والأطراف؛ ويمكن برمجة الجهاز وفقًا للاحتياجات العلاجية المتطورة للمريض.
- في ديسمبر 2022، سيتوفر نظام تحفيز النخاع الشوكي (SCS) من شركة Abbott Laboratories لعلاج الألم المزمن. وقد وافقت إدارة الغذاء والدواء الأمريكية على تقنية تحفيز النخاع الشوكي منخفضة الجرعة BurstDR من شركة Abbott، وهي تقنية موجية منخفضة الجرعة حاصلة على براءة اختراع مع أكبر دليل سريري. بالإضافة إلى ذلك، فقد ثبت أن هذه التقنية تساعد في تقليل الألم بنسبة 23% أكثر من النتائج التي تنتجها طرق الموجات التقليدية.
المنافسة والشركات الرئيسية:
ومن بين أبرز اللاعبين العاملين في سوق أجهزة تحفيز النخاع الشوكي شركة Boston Scientific Corp؛ وشركة Nevro Corp؛ وشركة Abbott Laboratories؛ وشركة Cirtec Medical Corp؛ وشركة Medtronic Plc؛ وشركة Biotronik SE & Co KG؛ وشركة Curonix LLC؛ وشركة Nalu Medical, Inc.؛ وشركة Synapse Biomedical Inc. وتركز هذه الشركات على إطلاق منتجات جديدة والتوسع الجغرافي لتلبية الطلب العالمي من المستهلكين وزيادة نطاق منتجاتها في محافظ المنتجات المتخصصة. ويتيح لها وجودها العالمي خدمة قاعدة كبيرة من العملاء، مما يسهل بالتالي توسيع السوق.
- التحليل التاريخي (سنتان)، السنة الأساسية، التوقعات (7 سنوات) مع معدل النمو السنوي المركب
- تحليل PEST و SWOT
- حجم السوق والقيمة / الحجم - عالميًا وإقليميًا وقطريًا
- الصناعة والمنافسة
- مجموعة بيانات Excel


Report Coverage
Revenue forecast, Company Analysis, Industry landscape, Growth factors, and Trends

Segment Covered
This text is related
to segments covered.

Regional Scope
North America, Europe, Asia Pacific, Middle East & Africa, South & Central America

Country Scope
This text is related
to country scope.
الأسئلة الشائعة
Based on product type, the spinal cord stimulator device market is bifurcated into rechargeable and non-rechargeable. The rechargeable segment held a larger market share in 2022 and is expected to record a significant CAGR during 2022–2030. In terms of end users, the spinal cord stimulator device market is categorized into hospitals, ambulatory surgery centers, and others. The hospital segment held the largest share of the market in 2022 and is anticipated to register the highest CAGR during 2022–2030.
Based on geography, the spinal cord stimulator device market is segmented into North America (the US, Canada, and Mexico), Europe (the UK, Germany, France, Italy, Spain, and the Rest of Europe), Asia Pacific (China, Japan, India, South Korea, Australia, and the Rest of Asia Pacific), the Middle East & Africa (the UAE, Saudi Arabia, South Africa, and Rest of the Middle East & Africa), and South & Central America (Brazil, Argentina, and the Rest of South & Central America). North America is the largest contributor to the growth of the global spinal cord stimulator device market. Asia Pacific is expected to register the highest CAGR in the spinal cord stimulator device market from 2022 to 2030.
The spinal cord stimulator device market majorly consists of players such as Boston Scientific Corp, Nevro Corp, Abbott Laboratories, Cirtec Medical Corp, Medtronic Plc, Biotronik SE & Co KG, Curonix LLC, Nalu Medical Inc, and Synapse Biomedical Inc
The increasing cases of spinal cord injuries and strategic initiatives by companies bolster the spinal cord stimulator devices market size. However, the high cost associated with spinal cord stimulator devices hinders the market growth.
A spinal cord stimulation device is an implanted device that relieves pain by transmitting low-level electrical signals directly into the spinal cord. The stimulator is mostly used after nonsurgical pain treatments fail to provide sufficient relief. Additionally, the device can improve the overall quality of life and sleep. As it is typically prescribed along with other pain management treatments, it effectively suppresses the need for pain medicines. The spinal cord stimulator device market size is expanding with the rising number of spinal cord injuries (SCIs) and the availability of innovative treatments.
Trends and growth analysis reports related to Life Sciences : READ MORE..
The List of Companies - Spinal Cord Stimulator Device Market
- Boston Scientific Corp
- Nevro Corp
- Abbott Laboratories
- Cirtec Medical Corp
- Medtronic Plc
- Biotronik SE & Co KG
- Curonix LLC
- Nalu Medical, Inc.
- Synapse Biomedical Inc
The Insight Partners performs research in 4 major stages: Data Collection & Secondary Research, Primary Research, Data Analysis and Data Triangulation & Final Review.
- Data Collection and Secondary Research:
As a market research and consulting firm operating from a decade, we have published and advised several client across the globe. First step for any study will start with an assessment of currently available data and insights from existing reports. Further, historical and current market information is collected from Investor Presentations, Annual Reports, SEC Filings, etc., and other information related to company’s performance and market positioning are gathered from Paid Databases (Factiva, Hoovers, and Reuters) and various other publications available in public domain.
Several associations trade associates, technical forums, institutes, societies and organization are accessed to gain technical as well as market related insights through their publications such as research papers, blogs and press releases related to the studies are referred to get cues about the market. Further, white papers, journals, magazines, and other news articles published in last 3 years are scrutinized and analyzed to understand the current market trends.
- Primary Research:
The primarily interview analysis comprise of data obtained from industry participants interview and answers to survey questions gathered by in-house primary team.
For primary research, interviews are conducted with industry experts/CEOs/Marketing Managers/VPs/Subject Matter Experts from both demand and supply side to get a 360-degree view of the market. The primary team conducts several interviews based on the complexity of the markets to understand the various market trends and dynamics which makes research more credible and precise.
A typical research interview fulfils the following functions:
- Provides first-hand information on the market size, market trends, growth trends, competitive landscape, and outlook
- Validates and strengthens in-house secondary research findings
- Develops the analysis team’s expertise and market understanding
Primary research involves email interactions and telephone interviews for each market, category, segment, and sub-segment across geographies. The participants who typically take part in such a process include, but are not limited to:
- Industry participants: VPs, business development managers, market intelligence managers and national sales managers
- Outside experts: Valuation experts, research analysts and key opinion leaders specializing in the electronics and semiconductor industry.
Below is the breakup of our primary respondents by company, designation, and region:

Once we receive the confirmation from primary research sources or primary respondents, we finalize the base year market estimation and forecast the data as per the macroeconomic and microeconomic factors assessed during data collection.
- Data Analysis:
Once data is validated through both secondary as well as primary respondents, we finalize the market estimations by hypothesis formulation and factor analysis at regional and country level.
- Macro-Economic Factor Analysis:
We analyse macroeconomic indicators such the gross domestic product (GDP), increase in the demand for goods and services across industries, technological advancement, regional economic growth, governmental policies, the influence of COVID-19, PEST analysis, and other aspects. This analysis aids in setting benchmarks for various nations/regions and approximating market splits. Additionally, the general trend of the aforementioned components aid in determining the market's development possibilities.
- Country Level Data:
Various factors that are especially aligned to the country are taken into account to determine the market size for a certain area and country, including the presence of vendors, such as headquarters and offices, the country's GDP, demand patterns, and industry growth. To comprehend the market dynamics for the nation, a number of growth variables, inhibitors, application areas, and current market trends are researched. The aforementioned elements aid in determining the country's overall market's growth potential.
- Company Profile:
The “Table of Contents” is formulated by listing and analyzing more than 25 - 30 companies operating in the market ecosystem across geographies. However, we profile only 10 companies as a standard practice in our syndicate reports. These 10 companies comprise leading, emerging, and regional players. Nonetheless, our analysis is not restricted to the 10 listed companies, we also analyze other companies present in the market to develop a holistic view and understand the prevailing trends. The “Company Profiles” section in the report covers key facts, business description, products & services, financial information, SWOT analysis, and key developments. The financial information presented is extracted from the annual reports and official documents of the publicly listed companies. Upon collecting the information for the sections of respective companies, we verify them via various primary sources and then compile the data in respective company profiles. The company level information helps us in deriving the base number as well as in forecasting the market size.
- Developing Base Number:
Aggregation of sales statistics (2020-2022) and macro-economic factor, and other secondary and primary research insights are utilized to arrive at base number and related market shares for 2022. The data gaps are identified in this step and relevant market data is analyzed, collected from paid primary interviews or databases. On finalizing the base year market size, forecasts are developed on the basis of macro-economic, industry and market growth factors and company level analysis.
- Data Triangulation and Final Review:
The market findings and base year market size calculations are validated from supply as well as demand side. Demand side validations are based on macro-economic factor analysis and benchmarks for respective regions and countries. In case of supply side validations, revenues of major companies are estimated (in case not available) based on industry benchmark, approximate number of employees, product portfolio, and primary interviews revenues are gathered. Further revenue from target product/service segment is assessed to avoid overshooting of market statistics. In case of heavy deviations between supply and demand side values, all thes steps are repeated to achieve synchronization.
We follow an iterative model, wherein we share our research findings with Subject Matter Experts (SME’s) and Key Opinion Leaders (KOLs) until consensus view of the market is not formulated – this model negates any drastic deviation in the opinions of experts. Only validated and universally acceptable research findings are quoted in our reports.
We have important check points that we use to validate our research findings – which we call – data triangulation, where we validate the information, we generate from secondary sources with primary interviews and then we re-validate with our internal data bases and Subject matter experts. This comprehensive model enables us to deliver high quality, reliable data in shortest possible time.


 احصل على عينة مجانية لهذا التقرير