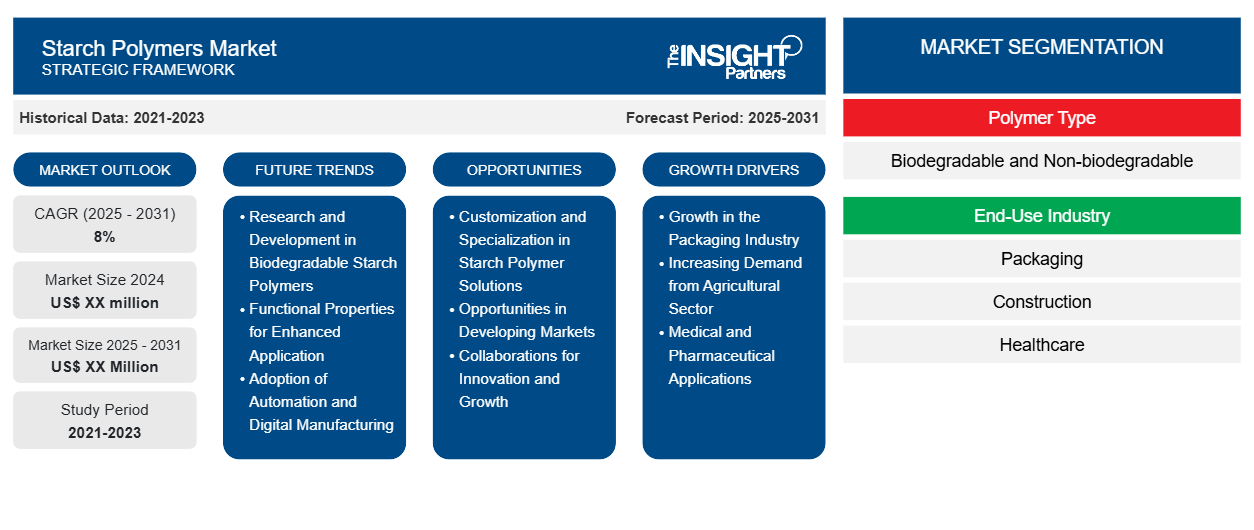
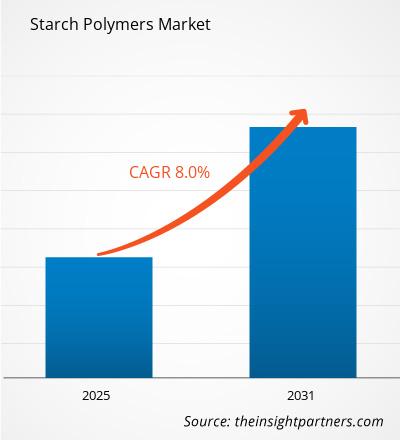
من المتوقع أن يسجل سوق البوليمرات النشوية معدل نمو سنوي مركب بنسبة 8٪ من عام 2023 إلى عام 2031، مع توسع حجم السوق من XX مليون دولار أمريكي في عام 2023 إلى XX مليون دولار أمريكي بحلول عام 2031.
تم تقسيم التقرير حسب نوع البوليمر (قابل للتحلل وغير قابل للتحلل). يقدم التقرير أيضًا تحليلًا يعتمد على صناعة الاستخدام النهائي (التعبئة والتغليف والبناء والرعاية الصحية والمنسوجات والزراعة وغيرها). يتم تقسيم التحليل العالمي بشكل أكبر على المستوى الإقليمي والدول الرئيسية. يتم تغطية حجم السوق والتوقعات على المستويات العالمية والإقليمية والقطرية لجميع قطاعات السوق الرئيسية ضمن النطاق. يقدم التقرير القيمة بالدولار الأمريكي للتحليل والقطاعات المذكورة أعلاه. يقدم التقرير إحصائيات رئيسية عن حالة السوق للاعبين الرئيسيين في السوق ويعرض اتجاهات السوق والفرص.
غرض التقرير
يهدف تقرير سوق البوليمرات النشوية الصادر عن The Insight Partners إلى وصف المشهد الحالي والنمو المستقبلي وأهم العوامل الدافعة والتحديات والفرص. سيوفر هذا رؤى لمختلف أصحاب المصلحة في الأعمال التجارية، مثل:
- مزودي/مصنعي التكنولوجيا: لفهم ديناميكيات السوق المتطورة ومعرفة فرص النمو المحتملة، وتمكينهم من اتخاذ قرارات استراتيجية مستنيرة.
- المستثمرون: إجراء تحليل شامل للاتجاهات فيما يتعلق بمعدل نمو السوق، وتوقعات السوق المالية، والفرص المتاحة عبر سلسلة القيمة.
- الهيئات التنظيمية: لتنظيم السياسات ومراقبة الأنشطة في السوق بهدف تقليل الانتهاكات والحفاظ على ثقة المستثمرين والحفاظ على سلامة السوق واستقرارها.
تجزئة سوق بوليمرات النشا
نوع البوليمر
- قابلة للتحلل وغير قابلة للتحلل
صناعة الاستخدام النهائي
- التغليف
- بناء
- الرعاية الصحية
- المنسوجات
- الزراعة وغيرها
قم بتخصيص هذا التقرير ليناسب متطلباتك
ستحصل على تخصيص لأي تقرير - مجانًا - بما في ذلك أجزاء من هذا التقرير، أو تحليل على مستوى الدولة، وحزمة بيانات Excel، بالإضافة إلى الاستفادة من العروض والخصومات الرائعة للشركات الناشئة والجامعات
سوق البوليمرات النشوية: رؤى استراتيجية
- احصل على أهم اتجاهات السوق الرئيسية لهذا التقرير.ستتضمن هذه العينة المجانية تحليلاً للبيانات، بدءًا من اتجاهات السوق وحتى التقديرات والتوقعات.
محركات نمو سوق البوليمرات النشوية
- النمو في صناعة التعبئة والتغليف: يعد النمو في صناعة التعبئة والتغليف عاملاً رئيسيًا في سوق بوليمرات النشا. أصبحت البوليمرات القائمة على النشا تحظى بشعبية متزايدة في إنتاج مواد التعبئة والتغليف القابلة للتحلل البيولوجي والتحويل إلى سماد، مثل الأكياس والأغشية والحاويات، استجابة لمتطلبات البيئة الخضراء والمستدامة. وقد تطور اعتماد مثل هذه الأنواع من بوليمرات النشا في هذه الصناعة نحو استبدال مواد التعبئة والتغليف المستخدمة تقليديًا بالبلاستيك.compostable packaging materials, such as bags, films, and containers, in response to the requirement for a green and sustainable environment. The adoption of such types of starch polymers in this industry has developed toward replacing packaging traditionally used with plastics.
- الطلب المتزايد من القطاع الزراعي: يعد القطاع الزراعي أيضًا محركًا مهمًا لسوق بوليمرات النشا. يشمل استخدام البوليمرات القائمة على النشا في الزراعة أغشية التغطية، وطلاء البذور، وتعديلات التربة. في الزراعة، كان هناك ارتفاع سريع في استخدام بوليمرات النشا بسبب الحاجة إلى بدائل مستدامة وقابلة للتحلل البيولوجي.
- التطبيقات الطبية والصيدلانية: يستمد سوق بوليمرات النشا نموًا كبيرًا من الصناعات الطبية والصيدلانية. تستخدم البوليمرات القائمة على النشا في الطب اليوم في العديد من التطبيقات، بما في ذلك استخدامها في أنظمة توصيل الأدوية، وضمادات الجروح، والأجهزة القابلة للزرع لأنها متوافقة بيولوجيًا وقابلة للتحلل البيولوجي. ويدفع هذا القطاع أيضًا إلى تبني بوليمرات النشا في هذا المجال من خلال الطلب المتزايد على حلول جديدة وأكثر كفاءة للمشاكل الطبية.
الاتجاهات المستقبلية لسوق البوليمرات النشوية
- البحث والتطوير في مجال البوليمرات النشوية القابلة للتحلل البيولوجي: لقد تقدم البحث في مجال البوليمرات النشوية القابلة للتحلل البيولوجي في السنوات القليلة الماضية. ويهدف إلى توفير أداء أفضل وعمر افتراضي أفضل وصديق للبيئة لمثل هذه الأنواع من المواد، مع التركيز على زيادة الطلب على البدائل الأكثر خضرة مقارنة بالبلاستيك التقليدي.
- الخصائص الوظيفية للتطبيق المعزز: علاوة على ذلك، يستخدم منتجو بوليمر النشا الخصائص الوظيفية في منتجاتهم لزيادة مساحة التطبيق. ويشمل ذلك تطوير بوليمرات النشا ذات الاستقرار الحراري المحسن، والخصائص الميكانيكية المعززة، وخصائص الحاجز الخاصة لتناسب المتطلبات المختلفة للصناعات النهائية.
- اعتماد الأتمتة والتصنيع الرقمي: تتجه الصناعة نحو طريقة آلية ورقمية لتصنيع منتجات البوليمر النشوي، مما يحسن الأداء ومراقبة الجودة والفعالية من حيث التكلفة. كما أن التقنيات الحديثة، مثل الروبوتات وتحليلات البيانات وأنظمة التصنيع الذكية المطبقة في الإنتاج، من شأنها أن تساعد الشركات المصنعة على تبسيط العمليات والاستجابة بسرعة لمتطلبات السوق.
فرص سوق البوليمرات النشوية
- التخصيص والتخصص في حلول البوليمر النشوي: لقد أعقب التخصص المتزايد للصناعات الحاجة إلى حلول بوليمر نشوي أكثر تخصيصًا أو مصممة خصيصًا. ويستفيد المصنعون من متطلبات العملاء من خلال تطوير البوليمرات القائمة على النشا والتي تستهدف قطاعات محددة من الاستخدام النهائي، بما في ذلك التعبئة والتغليف والزراعة والتطبيقات الطبية.
- الفرص المتاحة في الأسواق النامية: هناك أسواق نامية تتمتع بإمكانات نمو عالية لسوق البوليمرات النشوية بسبب الطلب المتزايد على المواد المستدامة والفعّالة من حيث التكلفة. وبالتالي، وبدون تغيير تركيبة المنتجات، بل مجرد تخصيص استراتيجيات التسويق وفقًا لاحتياجات معينة وتفضيلات هذه الأسواق النامية، يمكن للمصنعين بالتالي الحصول على المزيد من فرص الإيرادات وزيادة بصمتهم العالمية.
- التعاون من أجل الابتكار والنمو: هناك فرص محتملة لمصنعي بوليمرات النشا للتعاون مع مؤسسات البحث والجامعات وغيرها من الجهات الفاعلة في الصناعة لتعزيز الابتكار وتطوير تطبيقات جديدة للمواد القائمة على النشا. ومن شأن هذا التعاون أن يؤدي ليس فقط إلى تركيبات جديدة لبوليمرات النشا ولكن أيضًا إلى تحسين عمليات الإنتاج وفتح قطاعات سوقية جديدة.
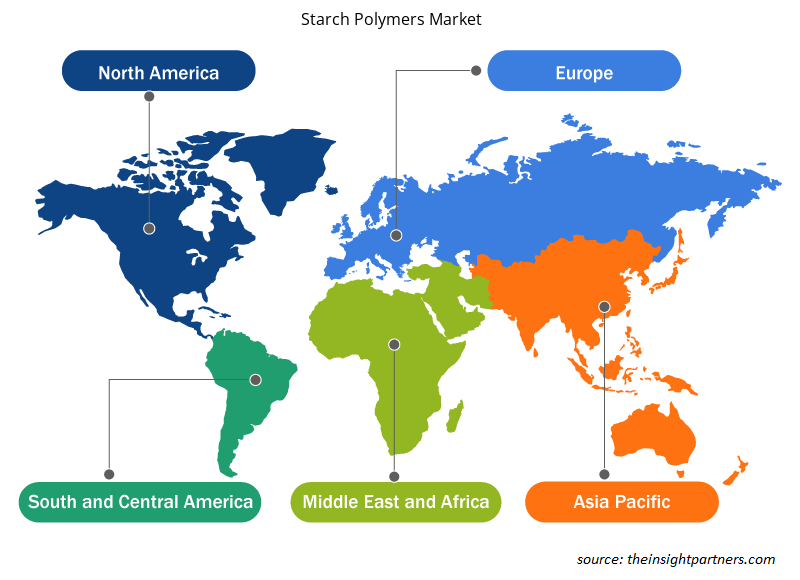
رؤى إقليمية حول سوق البوليمرات النشوية
لقد قام المحللون في Insight Partners بشرح الاتجاهات والعوامل الإقليمية المؤثرة على سوق بوليمرات النشا طوال فترة التوقعات بشكل شامل. يناقش هذا القسم أيضًا قطاعات سوق بوليمرات النشا والجغرافيا في جميع أنحاء أمريكا الشمالية وأوروبا ومنطقة آسيا والمحيط الهادئ والشرق الأوسط وأفريقيا وأمريكا الجنوبية والوسطى.
- احصل على البيانات الإقليمية المحددة لسوق بوليمرات النشا
نطاق تقرير سوق البوليمرات النشوية
| سمة التقرير | تفاصيل |
|---|---|
| حجم السوق في عام 2023 | XX مليون دولار أمريكي |
| حجم السوق بحلول عام 2031 | XX مليون دولار أمريكي |
| معدل النمو السنوي المركب العالمي (2023 - 2031) | 8% |
| البيانات التاريخية | 2021-2022 |
| فترة التنبؤ | 2024-2031 |
| القطاعات المغطاة | حسب نوع البوليمر
|
| المناطق والدول المغطاة | أمريكا الشمالية
|
| قادة السوق وملفات تعريف الشركات الرئيسية |
|
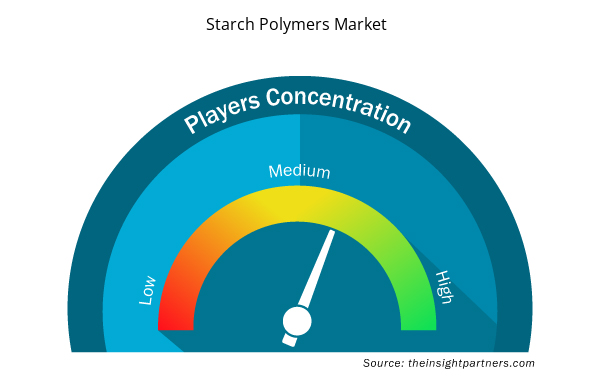
كثافة اللاعبين في سوق بوليمرات النشا: فهم تأثيرها على ديناميكيات الأعمال
يشهد سوق البوليمرات النشوية نموًا سريعًا، مدفوعًا بالطلب المتزايد من المستخدم النهائي بسبب عوامل مثل تفضيلات المستهلكين المتطورة والتقدم التكنولوجي والوعي المتزايد بفوائد المنتج. ومع ارتفاع الطلب، تعمل الشركات على توسيع عروضها والابتكار لتلبية احتياجات المستهلكين والاستفادة من الاتجاهات الناشئة، مما يؤدي إلى زيادة نمو السوق.
تشير كثافة اللاعبين في السوق إلى توزيع الشركات أو المؤسسات العاملة في سوق أو صناعة معينة. وهي تشير إلى عدد المنافسين (اللاعبين في السوق) الموجودين في مساحة سوق معينة نسبة إلى حجمها أو قيمتها السوقية الإجمالية.
الشركات الرئيسية العاملة في سوق البوليمرات النشوية هي:
- درجة حيوية
- بي أو بي
- بيوتيك
- نشا الذرة الياباني
- ليفان
إخلاء المسؤولية : الشركات المذكورة أعلاه ليست مرتبة بأي ترتيب معين.
- احصل على نظرة عامة على أهم اللاعبين الرئيسيين في سوق بوليمرات النشا
نقاط البيع الرئيسية
- التغطية الشاملة: يغطي التقرير بشكل شامل تحليل المنتجات والخدمات والأنواع والمستخدمين النهائيين لسوق البوليمرات النشوية، مما يوفر صورة شاملة.
- تحليل الخبراء: تم تجميع التقرير على أساس الفهم العميق لخبراء الصناعة والمحللين.
- معلومات محدثة: يضمن التقرير أهمية الأعمال التجارية بسبب تغطيته للمعلومات الحديثة واتجاهات البيانات.
- خيارات التخصيص: يمكن تخصيص هذا التقرير لتلبية متطلبات العملاء المحددة وبما يتناسب مع استراتيجيات العمل بشكل مناسب.
وبالتالي، يمكن أن يساعد تقرير البحث حول سوق بوليمرات النشا في تمهيد الطريق لفك شفرة وفهم سيناريو الصناعة وآفاق النمو. ورغم وجود بعض المخاوف المشروعة، فإن الفوائد الإجمالية لهذا التقرير تميل إلى التفوق على العيوب.
- التحليل التاريخي (سنتان)، السنة الأساسية، التوقعات (7 سنوات) مع معدل النمو السنوي المركب
- تحليل PEST و SWOT
- حجم السوق والقيمة / الحجم - عالميًا وإقليميًا وقطريًا
- الصناعة والمنافسة
- مجموعة بيانات Excel


Report Coverage
Revenue forecast, Company Analysis, Industry landscape, Growth factors, and Trends

Segment Covered
This text is related
to segments covered.

Regional Scope
North America, Europe, Asia Pacific, Middle East & Africa, South & Central America

Country Scope
This text is related
to country scope.
الأسئلة الشائعة
Advancements in biodegradable starch polymers is expected to be the key market trends
The report can be delivered in PDF/Word format, we can also share excel data sheet based on request.
On the basis of geography, the starch polymers market is classified into North America, Europe, Asia Pacific, Middle East and Africa, and South and Central America
Rodenberg; Japan Corn Starch; Novamont; Biotec; United Biopolymers SA are some of the key players operating in the starch polymers market
Growth in the packaging industry is driving the market growth
The Starch Polymers Market is estimated to witness a CAGR of 8% from 2023 to 2031
Trends and growth analysis reports related to Chemicals and Materials : READ MORE..
1. Biograde
2. BIOP
3. Biotec
4. Japan Corn Starch
5. Livan
6. Novamont
7. Plantic
8. PSM
9. Rodenberg
10. Wuhun Huali Enviornment Protection Sci and Tech
The Insight Partners performs research in 4 major stages: Data Collection & Secondary Research, Primary Research, Data Analysis and Data Triangulation & Final Review.
- Data Collection and Secondary Research:
As a market research and consulting firm operating from a decade, we have published and advised several client across the globe. First step for any study will start with an assessment of currently available data and insights from existing reports. Further, historical and current market information is collected from Investor Presentations, Annual Reports, SEC Filings, etc., and other information related to company’s performance and market positioning are gathered from Paid Databases (Factiva, Hoovers, and Reuters) and various other publications available in public domain.
Several associations trade associates, technical forums, institutes, societies and organization are accessed to gain technical as well as market related insights through their publications such as research papers, blogs and press releases related to the studies are referred to get cues about the market. Further, white papers, journals, magazines, and other news articles published in last 3 years are scrutinized and analyzed to understand the current market trends.
- Primary Research:
The primarily interview analysis comprise of data obtained from industry participants interview and answers to survey questions gathered by in-house primary team.
For primary research, interviews are conducted with industry experts/CEOs/Marketing Managers/VPs/Subject Matter Experts from both demand and supply side to get a 360-degree view of the market. The primary team conducts several interviews based on the complexity of the markets to understand the various market trends and dynamics which makes research more credible and precise.
A typical research interview fulfils the following functions:
- Provides first-hand information on the market size, market trends, growth trends, competitive landscape, and outlook
- Validates and strengthens in-house secondary research findings
- Develops the analysis team’s expertise and market understanding
Primary research involves email interactions and telephone interviews for each market, category, segment, and sub-segment across geographies. The participants who typically take part in such a process include, but are not limited to:
- Industry participants: VPs, business development managers, market intelligence managers and national sales managers
- Outside experts: Valuation experts, research analysts and key opinion leaders specializing in the electronics and semiconductor industry.
Below is the breakup of our primary respondents by company, designation, and region:

Once we receive the confirmation from primary research sources or primary respondents, we finalize the base year market estimation and forecast the data as per the macroeconomic and microeconomic factors assessed during data collection.
- Data Analysis:
Once data is validated through both secondary as well as primary respondents, we finalize the market estimations by hypothesis formulation and factor analysis at regional and country level.
- Macro-Economic Factor Analysis:
We analyse macroeconomic indicators such the gross domestic product (GDP), increase in the demand for goods and services across industries, technological advancement, regional economic growth, governmental policies, the influence of COVID-19, PEST analysis, and other aspects. This analysis aids in setting benchmarks for various nations/regions and approximating market splits. Additionally, the general trend of the aforementioned components aid in determining the market's development possibilities.
- Country Level Data:
Various factors that are especially aligned to the country are taken into account to determine the market size for a certain area and country, including the presence of vendors, such as headquarters and offices, the country's GDP, demand patterns, and industry growth. To comprehend the market dynamics for the nation, a number of growth variables, inhibitors, application areas, and current market trends are researched. The aforementioned elements aid in determining the country's overall market's growth potential.
- Company Profile:
The “Table of Contents” is formulated by listing and analyzing more than 25 - 30 companies operating in the market ecosystem across geographies. However, we profile only 10 companies as a standard practice in our syndicate reports. These 10 companies comprise leading, emerging, and regional players. Nonetheless, our analysis is not restricted to the 10 listed companies, we also analyze other companies present in the market to develop a holistic view and understand the prevailing trends. The “Company Profiles” section in the report covers key facts, business description, products & services, financial information, SWOT analysis, and key developments. The financial information presented is extracted from the annual reports and official documents of the publicly listed companies. Upon collecting the information for the sections of respective companies, we verify them via various primary sources and then compile the data in respective company profiles. The company level information helps us in deriving the base number as well as in forecasting the market size.
- Developing Base Number:
Aggregation of sales statistics (2020-2022) and macro-economic factor, and other secondary and primary research insights are utilized to arrive at base number and related market shares for 2022. The data gaps are identified in this step and relevant market data is analyzed, collected from paid primary interviews or databases. On finalizing the base year market size, forecasts are developed on the basis of macro-economic, industry and market growth factors and company level analysis.
- Data Triangulation and Final Review:
The market findings and base year market size calculations are validated from supply as well as demand side. Demand side validations are based on macro-economic factor analysis and benchmarks for respective regions and countries. In case of supply side validations, revenues of major companies are estimated (in case not available) based on industry benchmark, approximate number of employees, product portfolio, and primary interviews revenues are gathered. Further revenue from target product/service segment is assessed to avoid overshooting of market statistics. In case of heavy deviations between supply and demand side values, all thes steps are repeated to achieve synchronization.
We follow an iterative model, wherein we share our research findings with Subject Matter Experts (SME’s) and Key Opinion Leaders (KOLs) until consensus view of the market is not formulated – this model negates any drastic deviation in the opinions of experts. Only validated and universally acceptable research findings are quoted in our reports.
We have important check points that we use to validate our research findings – which we call – data triangulation, where we validate the information, we generate from secondary sources with primary interviews and then we re-validate with our internal data bases and Subject matter experts. This comprehensive model enables us to deliver high quality, reliable data in shortest possible time.
 احصل على عينة مجانية لهذا التقرير