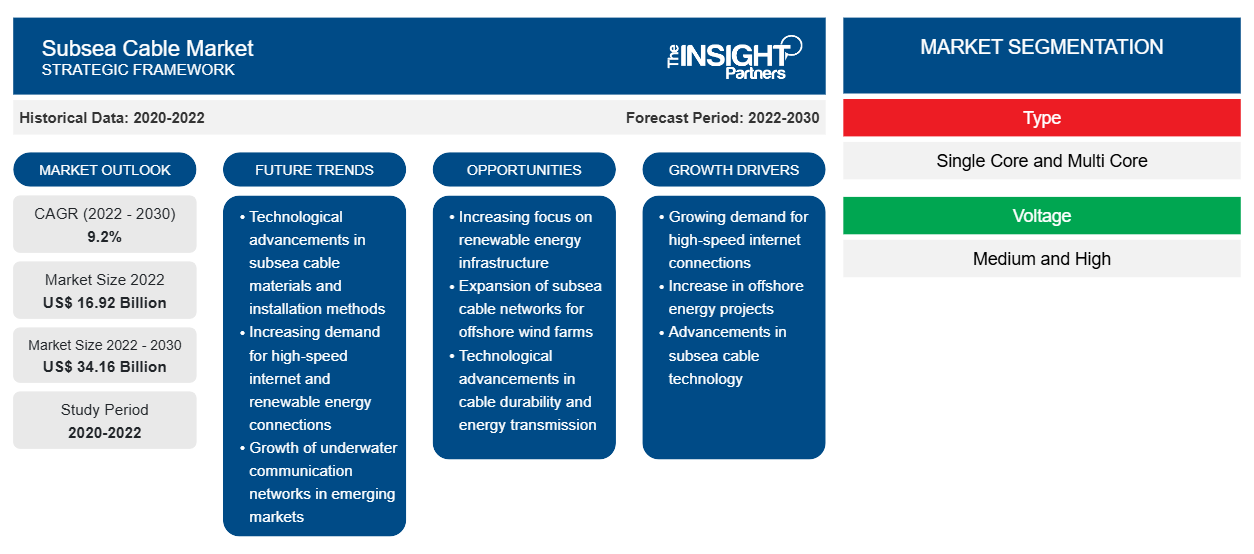
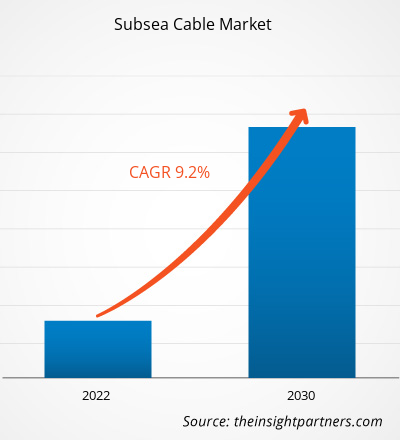
[تقرير بحثي] بلغت قيمة سوق الكابلات البحرية 16.92 مليار دولار أمريكي في عام 2022 ومن المتوقع أن تصل إلى 34.16 مليار دولار أمريكي بحلول عام 2030؛ ومن المتوقع أن تسجل معدل نمو سنوي مركب بنسبة 9.2٪ من عام 2022 إلى عام 2030.
وجهة نظر المحلل:
الطلب المتزايد على الإنترنت والهواتف الذكية بين المستهلكين، والاستثمارات المتزايدة في أنظمة الكابلات الجديدة، والاعتماد المتزايد على تقنية الحوسبة السحابية هي بعض العوامل التي تدفع نمو سوق الكابلات البحرية . تُستخدم الكابلات البحرية لنقل كميات هائلة من البيانات بسرعة وربط مختلف البلدان في جميع أنحاء العالم. ومع ذلك، فإن هجمات الأمن السيبراني المتزايدة والتكلفة العالية المرتبطة بتثبيت الكابلات البحرية تعيق نمو السوق. علاوة على ذلك، فإن الحاجة المتزايدة إلى تدفق البيانات والاتصالات تعزز نمو السوق في جميع أنحاء العالم. كما من المتوقع أن يؤدي العدد المتزايد من المشاريع الجديدة المتعلقة بتثبيت الكابلات البحرية إلى خلق العديد من فرص النمو الجديدة للسوق خلال فترة التنبؤ.
نظرة عامة على السوق:
الكابلات البحرية، المعروفة أيضًا باسم الكابلات البحرية، هي أسلاك ألياف ضوئية طويلة توضع على قاع البحر وتربط بين نقطتي هبوط أو أكثر. يبلغ طول هذه الكابلات آلاف الأميال وتستخدم لنقل إشارات الاتصالات من نقطة إلى أخرى. تعد الكابلات البحرية مكونات أساسية للبنية التحتية العالمية للاتصالات مثل ربط القارات وكابلات الإنترنت وتسهيل الاتصالات في جميع أنحاء العالم. تُستخدم هذه الكابلات في المقام الأول لنقل البيانات والاتصالات عن بعد من خلال السماح بالنقل السريع للبيانات عالميًا.
قم بتخصيص هذا التقرير ليناسب متطلباتك
ستحصل على تخصيص لأي تقرير - مجانًا - بما في ذلك أجزاء من هذا التقرير، أو تحليل على مستوى الدولة، وحزمة بيانات Excel، بالإضافة إلى الاستفادة من العروض والخصومات الرائعة للشركات الناشئة والجامعات
- احصل على أهم اتجاهات السوق الرئيسية لهذا التقرير.ستتضمن هذه العينة المجانية تحليلاً للبيانات، بدءًا من اتجاهات السوق وحتى التقديرات والتوقعات.
محرك السوق:
نمو حركة الإنترنت يحرك سوق الكابلات البحرية
إن الاستخدام المتزايد للإنترنت في جميع أنحاء العالم يقود السوق العالمية. وفقًا للمجلس الأطلسي، فإن أكثر من 97٪ من حركة الإنترنت العالمية تعتمد على الكابلات البحرية، والتي تتزايد بسرعة. يرتبط العالم بالإنترنت، ويعتمد عليه الجميع تقريبًا بشكل كبير لإدارة أنشطتهم اليومية، مما يزيد من الحاجة إلى خدمات الإنترنت بين المستهلكين. وفقًا للاتحاد الدولي للاتصالات، سيبلغ عدد مستخدمي الإنترنت في العالم 5.4 مليار بحلول نهاية عام 2023، وهو ما يغطي 67٪ من سكان العالم الذين يستخدمون الإنترنت. هناك نمو سريع في الطلب على سرعة النطاق الترددي السريع بين المستهلكين. علاوة على ذلك، يتزايد انتشار الهواتف الذكية في جميع أنحاء العالم بسبب ارتفاع عدد مستخدمي الإنترنت. على سبيل المثال، وفقًا لجمعية GSM، سيكون هناك 5 مليارات مستخدم للإنترنت عبر الهاتف المحمول في جميع أنحاء العالم بحلول عام 2025، و8 مليارات اتصال بالهواتف الذكية بحلول عام 2027، و9.5 مليار اتصال بالهواتف المحمولة بحلول عام 2030. وبالتالي، فإن التبني المتزايد للهواتف الذكية يعزز حركة الإنترنت، مما يدفع نمو سوق الكابلات البحرية العالمية.
تقسيم التقرير ونطاقه:
يتم تقسيم سوق الكابلات البحرية على أساس النوع والجهد والعرض والتطبيق. بناءً على النوع، يتم تقسيم السوق إلى نواة واحدة ومتعددة النواة. من حيث الجهد، يتم تصنيف السوق إلى متوسط وعالي. بناءً على العرض، يتم تقسيم سوق الكابلات البحرية إلىخدمات التركيب وخدمات الصيانة والترقية. على أساس التطبيق، يتم تقسيم السوق إلى الاتصالات والطاقة. حسب المنطقة، يتم تقسيم سوق الكابلات البحرية إلى أمريكا الشمالية وأوروبا وآسيا والمحيط الهادئ (APAC) والشرق الأوسط وأفريقيا (MEA) وأمريكا الجنوبية (SAM).
التحليل القطاعي:
بناءً على العرض، ينقسم السوق إلىخدمات التركيب وخدمات الصيانة والتحديث. من المتوقع أن يتطور قطاع خدمات الصيانة والتحديث بوتيرة كبيرة خلال الفترة المتوقعة بسبب التكلفة العالية لتركيب الكابلات. عادة ما تستغرق صيانة وتحديث الكابلات البحرية وقتًا أقل (حتى ثمانية أشهر) وهي أرخص من التركيبات الجديدة. علاوة على ذلك، تعد الكابلات المثبتة أصلًا قيمًا للأمة، ويسمح تنفيذ التقنيات الجديدة للمستخدم باستخدام الكابل الأصلي، سواء من حيث التصميم أو السعة.
التحليل الإقليمي:
استحوذت منطقة آسيا والمحيط الهادئ على أكبر حصة في سوق الكابلات البحرية في عام 2022. وتنقسم سوق آسيا والمحيط الهادئ إلى أستراليا والصين واليابان والهند وكوريا الجنوبية وبقية منطقة آسيا والمحيط الهادئ. تساهم المنطقة بحصة ملحوظة في السوق العالمية بسبب التبني العالي والاستثمارات في الكابلات البحرية في المنطقة. يؤدي ارتفاع عدد السكان في دول مثل الصين والهند إلى زيادة عدد مستخدمي الإنترنت في المنطقة، وهو ما يحرك السوق. يتم توليد حوالي نصف حركة الإنترنت العالمية من قبل المستهلكين، وخاصة من منطقة آسيا والمحيط الهادئ، مما يغذي الطلب على الكابلات البحرية. إن الحاجة المتزايدة إلى خدمات إنترنت أسرع في منطقة المحيط الهادئ، بسبب كابل الاتصالات البحرية المحدود في المنطقة، تشجع الحكومات على تطوير أنظمة كابلات جديدة في المنطقة. على سبيل المثال، في يوليو 2023، وقعت اليابان مذكرة تعاون مع الاتحاد الأوروبي لتطوير الكابلات البحرية في القطب الشمالي. تعمل هذه الكابلات على تعزيز الاتصال من خلال تسريع حركة الإنترنت في جميع أنحاء العالم ومن المتوقع أن تكون جاهزة للعمل بحلول عام 2026.
علاوة على ذلك، أصبحت منطقة آسيا والمحيط الهادئ بشكل متزايد مركزًا للاستثمارات المباشرة في البنية التحتية للكابلات البحرية. على سبيل المثال، تلقى نظام كابل الألياف الضوئية 4/6/8 بطول 3200 كيلومتر بين تشيناي وسنغافورة استثمارًا بقيمة 100 مليار دولار أمريكي من حكومتي البلدين لجعل الكابل جاهزًا للتشغيل في عام 2021. بالإضافة إلى ذلك، تتعاون العديد من شركات التكنولوجيا العملاقة مثل Google وMicrosoft وFacebook مع شركات الكابلات البحرية لتطوير مشاريع جديدة. على سبيل المثال، في يناير 2022، دخلت Google، كمستثمر، في شراكة مع AARNet وSingtel وIndosat Ooredoo وSubPartners وTelstra في مشروع كابل بحري جديد يربط اليابان بأستراليا عبر غوام.
نظرة إقليمية على سوق الكابلات البحرية
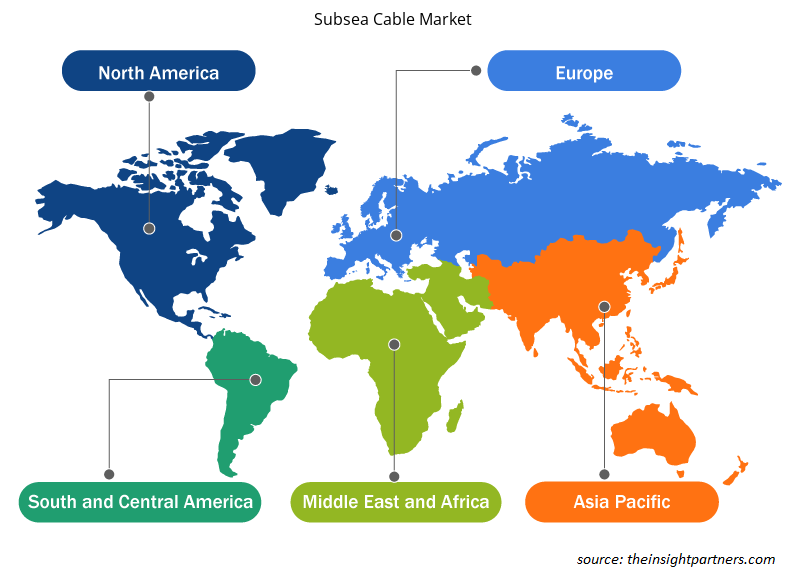
لقد قام المحللون في Insight Partners بشرح الاتجاهات والعوامل الإقليمية المؤثرة على سوق الكابلات البحرية طوال فترة التوقعات بشكل شامل. يناقش هذا القسم أيضًا قطاعات سوق الكابلات البحرية والجغرافيا في جميع أنحاء أمريكا الشمالية وأوروبا ومنطقة آسيا والمحيط الهادئ والشرق الأوسط وأفريقيا وأمريكا الجنوبية والوسطى.

- احصل على البيانات الإقليمية المحددة لسوق الكابلات البحرية
نطاق تقرير سوق الكابلات البحرية
| سمة التقرير | تفاصيل |
|---|---|
| حجم السوق في عام 2022 | 16.92 مليار دولار أمريكي |
| حجم السوق بحلول عام 2030 | 34.16 مليار دولار أمريكي |
| معدل النمو السنوي المركب العالمي (2022 - 2030) | 9.2% |
| البيانات التاريخية | 2020-2022 |
| فترة التنبؤ | 2022-2030 |
| القطاعات المغطاة | حسب النوع
|
| المناطق والدول المغطاة | أمريكا الشمالية
|
| قادة السوق وملفات تعريف الشركات الرئيسية |
|
كثافة اللاعبين في السوق: فهم تأثيرها على ديناميكيات الأعمال
يشهد سوق الكابلات البحرية نموًا سريعًا، مدفوعًا بالطلب المتزايد من المستخدم النهائي بسبب عوامل مثل تفضيلات المستهلكين المتطورة والتقدم التكنولوجي والوعي المتزايد بفوائد المنتج. ومع ارتفاع الطلب، تعمل الشركات على توسيع عروضها والابتكار لتلبية احتياجات المستهلكين والاستفادة من الاتجاهات الناشئة، مما يؤدي إلى زيادة نمو السوق.
تشير كثافة اللاعبين في السوق إلى توزيع الشركات أو المؤسسات العاملة في سوق أو صناعة معينة. وهي تشير إلى عدد المنافسين (اللاعبين في السوق) الموجودين في مساحة سوق معينة نسبة إلى حجمها أو قيمتها السوقية الإجمالية.
الشركات الرئيسية العاملة في سوق الكابلات البحرية هي:
- نوكيا
- شركة سوبكوم المحدودة
- شركة NEC
- بريسميان سبا
- شركة إن كي تي إيه إس
إخلاء المسؤولية : الشركات المذكورة أعلاه ليست مرتبة بأي ترتيب معين.

- احصل على نظرة عامة على أهم اللاعبين الرئيسيين في سوق الكابلات البحرية
تحليل اللاعب الرئيسي:
ومن بين اللاعبين الرئيسيين في سوق الكابلات البحرية التي تم تناولها في التقرير: Nokia؛ SubCom, LLC؛ NEC Corporation؛ Prysmian SpA؛ NKT A/S؛ Furukawa Electric Co., Ltd.؛ Hengtong Group Co., Ltd.؛ Ciena Corporation؛ ZTT Cable؛ وJDR Cable Systems Ltd.
التطورات الأخيرة:
يتبنى اللاعبون في السوق على نطاق واسع استراتيجيات غير عضوية وعضوية. وفيما يلي بعض التطورات الرئيسية الأخيرة في السوق:
- في نوفمبر 2022، حصلت شركة ريلاينس إندستريز المحدودة على موافقة لنشر أكبر كابل بحري في العالم يربط بين سنغافورة وأوروبا. ومن المتوقع أن يبدأ تشغيل الكابلين البحريين، India-Europe-Xpress (IEX) وIndia-Asia-Xpress (IAX)، بين عامي 2023 و2024.
- في ديسمبر 2022، وقعت شركة الاتصالات الكوبية اتفاقية مع شركة أورانج لدمج مشروع أريماو مع نظام الكابلات ARCOS-1 في كوجيمار بكوبا. وتخطط الشركتان أيضًا لتجهيز المشروع للخدمة بحلول نهاية عام 2023.
- في أكتوبر 2021، أعلنت شركة NEC Corporation أن شركتها التابعة OCC Corporation تعاونت مع شركة Sumitomo Electric Industries Ltd. لتطوير كابل بحري للألياف الضوئية يبلغ طوله أربعة ملايين متر لصالح Facebook. يعمل نظام الكابل هذا على زيادة عدد قنوات البيانات المستقلة من خلال تمكين تقنية تقسيم الفضاء البحري المتعدد (SDM) من الجيل التالي.
- التحليل التاريخي (سنتان)، السنة الأساسية، التوقعات (7 سنوات) مع معدل النمو السنوي المركب
- تحليل PEST و SWOT
- حجم السوق والقيمة / الحجم - عالميًا وإقليميًا وقطريًا
- الصناعة والمنافسة
- مجموعة بيانات Excel


Report Coverage
Revenue forecast, Company Analysis, Industry landscape, Growth factors, and Trends

Segment Covered
This text is related
to segments covered.

Regional Scope
North America, Europe, Asia Pacific, Middle East & Africa, South & Central America

Country Scope
This text is related
to country scope.
الأسئلة الشائعة
Europe is expected to register highest CAGR in the subsea cable market during the forecast period (2022-2030)
Communication segment is expected to hold a major market share of subsea cable market in 2022
US, China, UK, and Germany are expected to register high growth rate during the forecast period
The US is expected to hold a major market share of subsea cable market in 2022
Nokia, SubCom, LLC, NEC Corporation, Prysmian S.p.A, NKT A/S, Furukawa Electric Co., Ltd., Hengtong Group Co.,Ltd., Ciena Corporation, ZTT Cable, and JDR Cable Systems Ltd. are the key market players expected to hold a major market share of subsea cable market in 2022
Growing Adoption of 5G and IoT Technologies
The estimated global market size for the subsea cable market in 2022 is expected to be around US$ 16.92 billion
Trends and growth analysis reports related to Electronics and Semiconductor : READ MORE..
The List of Companies - Subsea Cable Market
- Nokia
- SubCom, LLC
- NEC Corporation
- Prysmian S.p.A
- NKT A/S
- Furukawa Electric Co., Ltd.
- Hengtong Group Co., Ltd.
- Ciena Corporation
- ZTT Cable
- JDR Cable Systems Ltd.
The Insight Partners performs research in 4 major stages: Data Collection & Secondary Research, Primary Research, Data Analysis and Data Triangulation & Final Review.
- Data Collection and Secondary Research:
As a market research and consulting firm operating from a decade, we have published and advised several client across the globe. First step for any study will start with an assessment of currently available data and insights from existing reports. Further, historical and current market information is collected from Investor Presentations, Annual Reports, SEC Filings, etc., and other information related to company’s performance and market positioning are gathered from Paid Databases (Factiva, Hoovers, and Reuters) and various other publications available in public domain.
Several associations trade associates, technical forums, institutes, societies and organization are accessed to gain technical as well as market related insights through their publications such as research papers, blogs and press releases related to the studies are referred to get cues about the market. Further, white papers, journals, magazines, and other news articles published in last 3 years are scrutinized and analyzed to understand the current market trends.
- Primary Research:
The primarily interview analysis comprise of data obtained from industry participants interview and answers to survey questions gathered by in-house primary team.
For primary research, interviews are conducted with industry experts/CEOs/Marketing Managers/VPs/Subject Matter Experts from both demand and supply side to get a 360-degree view of the market. The primary team conducts several interviews based on the complexity of the markets to understand the various market trends and dynamics which makes research more credible and precise.
A typical research interview fulfils the following functions:
- Provides first-hand information on the market size, market trends, growth trends, competitive landscape, and outlook
- Validates and strengthens in-house secondary research findings
- Develops the analysis team’s expertise and market understanding
Primary research involves email interactions and telephone interviews for each market, category, segment, and sub-segment across geographies. The participants who typically take part in such a process include, but are not limited to:
- Industry participants: VPs, business development managers, market intelligence managers and national sales managers
- Outside experts: Valuation experts, research analysts and key opinion leaders specializing in the electronics and semiconductor industry.
Below is the breakup of our primary respondents by company, designation, and region:

Once we receive the confirmation from primary research sources or primary respondents, we finalize the base year market estimation and forecast the data as per the macroeconomic and microeconomic factors assessed during data collection.
- Data Analysis:
Once data is validated through both secondary as well as primary respondents, we finalize the market estimations by hypothesis formulation and factor analysis at regional and country level.
- Macro-Economic Factor Analysis:
We analyse macroeconomic indicators such the gross domestic product (GDP), increase in the demand for goods and services across industries, technological advancement, regional economic growth, governmental policies, the influence of COVID-19, PEST analysis, and other aspects. This analysis aids in setting benchmarks for various nations/regions and approximating market splits. Additionally, the general trend of the aforementioned components aid in determining the market's development possibilities.
- Country Level Data:
Various factors that are especially aligned to the country are taken into account to determine the market size for a certain area and country, including the presence of vendors, such as headquarters and offices, the country's GDP, demand patterns, and industry growth. To comprehend the market dynamics for the nation, a number of growth variables, inhibitors, application areas, and current market trends are researched. The aforementioned elements aid in determining the country's overall market's growth potential.
- Company Profile:
The “Table of Contents” is formulated by listing and analyzing more than 25 - 30 companies operating in the market ecosystem across geographies. However, we profile only 10 companies as a standard practice in our syndicate reports. These 10 companies comprise leading, emerging, and regional players. Nonetheless, our analysis is not restricted to the 10 listed companies, we also analyze other companies present in the market to develop a holistic view and understand the prevailing trends. The “Company Profiles” section in the report covers key facts, business description, products & services, financial information, SWOT analysis, and key developments. The financial information presented is extracted from the annual reports and official documents of the publicly listed companies. Upon collecting the information for the sections of respective companies, we verify them via various primary sources and then compile the data in respective company profiles. The company level information helps us in deriving the base number as well as in forecasting the market size.
- Developing Base Number:
Aggregation of sales statistics (2020-2022) and macro-economic factor, and other secondary and primary research insights are utilized to arrive at base number and related market shares for 2022. The data gaps are identified in this step and relevant market data is analyzed, collected from paid primary interviews or databases. On finalizing the base year market size, forecasts are developed on the basis of macro-economic, industry and market growth factors and company level analysis.
- Data Triangulation and Final Review:
The market findings and base year market size calculations are validated from supply as well as demand side. Demand side validations are based on macro-economic factor analysis and benchmarks for respective regions and countries. In case of supply side validations, revenues of major companies are estimated (in case not available) based on industry benchmark, approximate number of employees, product portfolio, and primary interviews revenues are gathered. Further revenue from target product/service segment is assessed to avoid overshooting of market statistics. In case of heavy deviations between supply and demand side values, all thes steps are repeated to achieve synchronization.
We follow an iterative model, wherein we share our research findings with Subject Matter Experts (SME’s) and Key Opinion Leaders (KOLs) until consensus view of the market is not formulated – this model negates any drastic deviation in the opinions of experts. Only validated and universally acceptable research findings are quoted in our reports.
We have important check points that we use to validate our research findings – which we call – data triangulation, where we validate the information, we generate from secondary sources with primary interviews and then we re-validate with our internal data bases and Subject matter experts. This comprehensive model enables us to deliver high quality, reliable data in shortest possible time.


 احصل على عينة مجانية لهذا التقرير