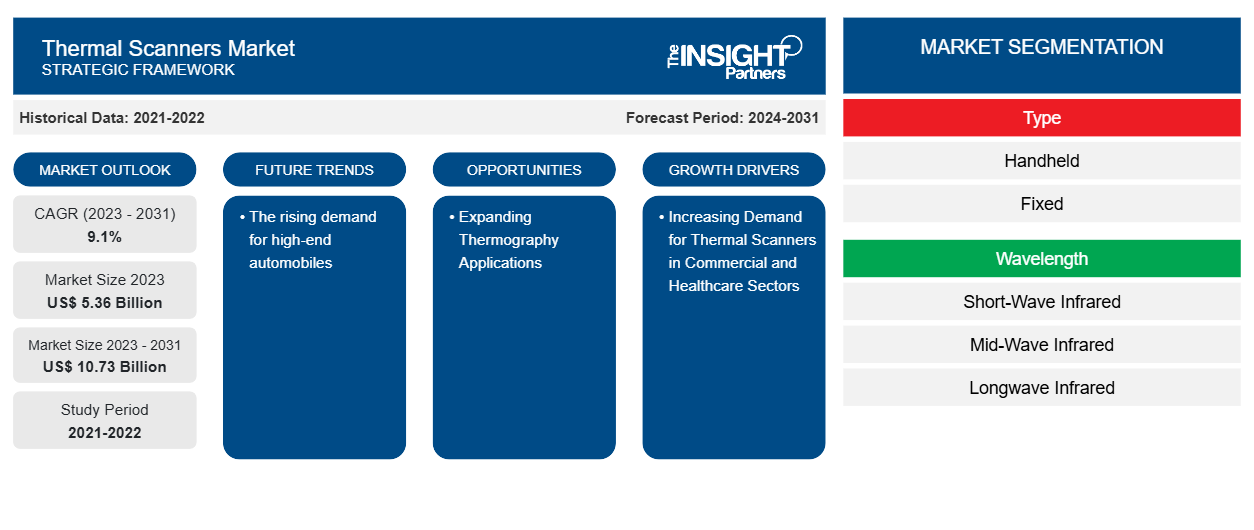
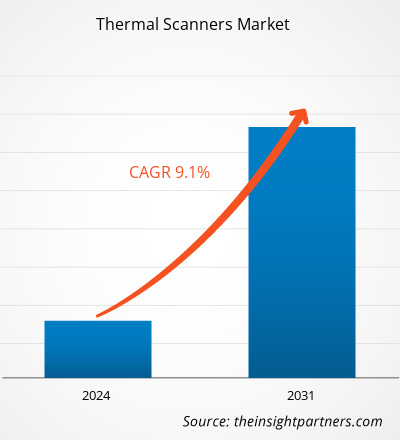
من المتوقع أن يصل حجم سوق الماسحات الضوئية الحرارية إلى 10.73 مليار دولار أمريكي بحلول عام 2031 من 5.36 مليار دولار أمريكي في عام 2023. ومن المتوقع أن يسجل السوق معدل نمو سنوي مركب بنسبة 9.1٪ في الفترة 2023-2031. ومن المرجح أن يظل الطلب المتزايد على السيارات الفاخرة اتجاهًا رئيسيًا في سوق الماسحات الضوئية الحرارية.
تحليل سوق الماسحات الحرارية
يشهد سوق الماسحات الحرارية نموًا سريعًا بسبب الطلب المتزايد على الماسحات الحرارية في القطاعات التجارية والصحية وزيادة الاستثمار في البحث والتطوير لتطوير ماسحات حرارية مبتكرة. يتوسع السوق بشكل مطرد، مدفوعًا بالتركيب المتزايد في مختلف الأماكن العامة بما في ذلك المطارات والمستشفيات وغيرها لأغراض الكشف. علاوة على ذلك، فإن توسيع تطبيقات التصوير الحراري والتقدم التكنولوجي ودمج الذكاء الاصطناعي وتقنيات التعرف على الوجه توفر فرصًا مربحة لنمو السوق.
نظرة عامة على سوق الماسحات الحرارية
إن أجهزة المسح الحراري بالأشعة تحت الحمراء هي أجهزة تصوير غير جراحية تكتشف الحرارة التي يولدها أي جسم وتحولها إلى إشارات كهربائية. وقد نمت تطبيقاتها على مر الزمن في مجموعة متنوعة من البيئات، بما في ذلك العمليات الصناعية ومراكز العلاج ومختبرات الأبحاث وإنفاذ القانون من قبل الشرطة، وغيرها. وقد أدى تنوع ونمو العديد من التطبيقات إلى زيادة مبيعات أجهزة المسح الحراري عبر العديد من الاقتصادات في السنوات الأخيرة.
قم بتخصيص هذا التقرير ليناسب متطلباتك
ستحصل على تخصيص لأي تقرير - مجانًا - بما في ذلك أجزاء من هذا التقرير، أو تحليل على مستوى الدولة، وحزمة بيانات Excel، بالإضافة إلى الاستفادة من العروض والخصومات الرائعة للشركات الناشئة والجامعات
سوق الماسحات الحرارية:
- احصل على أهم اتجاهات السوق الرئيسية لهذا التقرير.ستتضمن هذه العينة المجانية تحليلاً للبيانات، بدءًا من اتجاهات السوق وحتى التقديرات والتوقعات.
محركات وفرص سوق الماسحات الحرارية
الطلب المتزايد على أجهزة المسح الحراري في القطاعات التجارية والصحية هو المحرك للسوق
تحظى الماسحات الضوئية الحرارية بطلب كبير في القطاعات التجارية والصحية لتطبيقات الأمن والمراقبة. إن الحاجة المتزايدة لتطبيقات الأمن والمراقبة المرتبطة بالحاجة العالية لمزيد من الأمان بين الموظفين والمقيمين هي التي تدفع السوق. توفر الماسحات الضوئية الحرارية عائدًا مرتفعًا على الاستثمار (ROI) للمستخدمين نظرًا لتوفرها بتكلفة منخفضة مقارنة بأنظمة CCTV . إن التكاليف الإجمالية لتثبيت نظام أمان قائم على الكاميرا الحرارية أقل بكثير من تكاليف نظام CCTV، مما يزيد من اعتماده في القطاعات التجارية والصحية. ومع ذلك، من المتوقع أن يؤدي زيادة الاستثمار في أنظمة البنية التحتية من قبل القطاعات التجارية والصحية، جنبًا إلى جنب مع متطلبات المراقبة المهنية، إلى دفع السوق.
التوسع في تطبيقات التصوير الحراري – فرصة في سوق الماسحات الحرارية
تُستخدم تقنية التصوير الحراري على نطاق واسع في الصناعة الطبية لمراقبة ضغط الدم وجراحة القلب وتشخيص أمراض الكبد واكتشاف سرطان الثدي وغيرها. يستخدم تطبيق التصوير الحراري كاميرا الأشعة تحت الحمراء المنتشرة في ماسح حراري للمساعدة في اكتشاف تدفق الدم وأنماط الحرارة في أنسجة الجسم. علاوة على ذلك، فإن الإنفاق المتزايد من الصناعة الطبية وزيادة أنشطة البحث والتطوير نحو تطوير الماسحات الحرارية المتقدمة تولد فرص نمو كبيرة للسوق خلال فترة التنبؤ.
تقرير تحليل تجزئة سوق الماسحات الحرارية
إن القطاعات الرئيسية التي ساهمت في اشتقاق تحليل سوق الماسحات الضوئية الحرارية هي النوع والطول الموجي والاستخدام النهائي.
- وفقًا للنوع، ينقسم سوق الماسحات الحرارية إلى محمولة وثابتة. احتلت الشريحة الثابتة حصة سوقية أكبر في عام 2023.
- على أساس الطول الموجي، يتم تقسيم سوق الماسحات الحرارية إلى الأشعة تحت الحمراء ذات الموجة القصيرة، والأشعة تحت الحمراء ذات الموجة المتوسطة، والأشعة تحت الحمراء ذات الموجة الطويلة. احتلت شريحة الأشعة تحت الحمراء ذات الموجة الطويلة حصة سوقية أكبر في عام 2023.
- من حيث الاستخدام النهائي، يتم تصنيف السوق على أنها صناعية، وفضائية ودفاعية، وسيارات، ونفط وغاز، وغيرها. احتل قطاع الفضاء والدفاع حصة سوقية أكبر في عام 2023.
تحليل حصة سوق الماسحات الحرارية حسب المنطقة الجغرافية
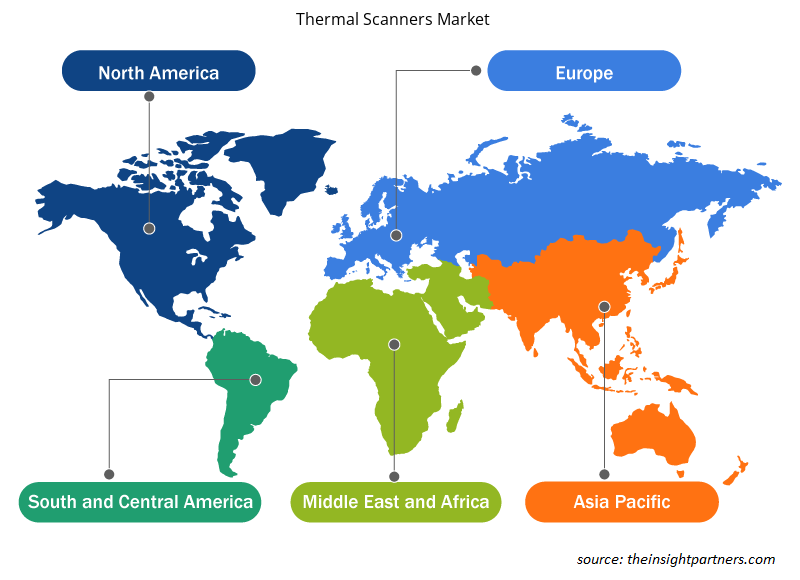
ينقسم النطاق الجغرافي لتقرير سوق الماسحات الحرارية بشكل أساسي إلى خمس مناطق: أمريكا الشمالية، ومنطقة آسيا والمحيط الهادئ، وأوروبا، والشرق الأوسط وأفريقيا، وأمريكا الجنوبية/أمريكا الجنوبية والوسطى. ومن حيث الإيرادات، استحوذت أمريكا الشمالية على أكبر حصة في سوق الماسحات الحرارية، وذلك بسبب توسع صناعة الطيران والدفاع.
من المتوقع أن يتوسع السوق في منطقة آسيا والمحيط الهادئ في المستقبل القريب، ويعزى ذلك إلى العديد من البائعين الذين يقدمون حلولاً منخفضة التكلفة، مما يزيد الطلب على الماسحات الضوئية الحرارية بين المستخدمين النهائيين. إن زيادة الاستثمار وتوسيع العديد من الصناعات، بما في ذلك الصناعة والفضاء والدفاع والسيارات والنفط والغاز وغيرها، تخلق فرصًا في السوق. تعتمد هذه الصناعات بشكل كبير على الماسحات الضوئية الحرارية لأغراض المراقبة، مما يدفع إلى الإنتاج الضخم. وبالتالي تعزيز السوق خلال فترة التنبؤ.
رؤى إقليمية حول سوق الماسحات الحرارية
لقد قام المحللون في Insight Partners بشرح الاتجاهات والعوامل الإقليمية المؤثرة على سوق الماسحات الضوئية الحرارية طوال فترة التوقعات بشكل شامل. يناقش هذا القسم أيضًا قطاعات سوق الماسحات الضوئية الحرارية والجغرافيا في جميع أنحاء أمريكا الشمالية وأوروبا ومنطقة آسيا والمحيط الهادئ والشرق الأوسط وأفريقيا وأمريكا الجنوبية والوسطى.
- احصل على البيانات الإقليمية المحددة لسوق الماسحات الحرارية
نطاق تقرير سوق الماسحات الحرارية
| سمة التقرير | تفاصيل |
|---|---|
| حجم السوق في عام 2023 | 5.36 مليار دولار أمريكي |
| حجم السوق بحلول عام 2031 | 10.73 مليار دولار أمريكي |
| معدل النمو السنوي المركب العالمي (2023 - 2031) | 9.1% |
| البيانات التاريخية | 2021-2022 |
| فترة التنبؤ | 2024-2031 |
| القطاعات المغطاة | حسب النوع
|
| المناطق والدول المغطاة | أمريكا الشمالية
|
| قادة السوق وملفات تعريف الشركات الرئيسية |
|
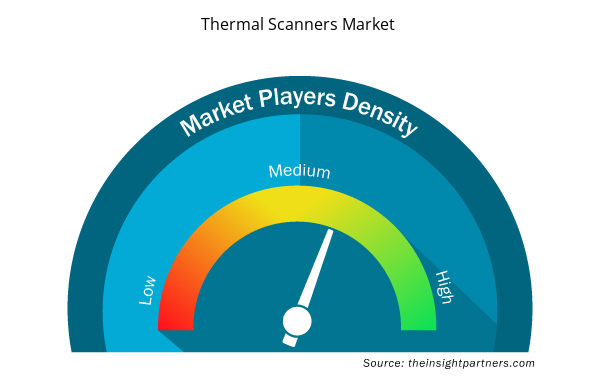
كثافة اللاعبين في سوق الماسحات الضوئية الحرارية: فهم تأثيرها على ديناميكيات الأعمال
يشهد سوق الماسحات الحرارية نموًا سريعًا، مدفوعًا بالطلب المتزايد من المستخدم النهائي بسبب عوامل مثل تفضيلات المستهلكين المتطورة والتقدم التكنولوجي والوعي المتزايد بفوائد المنتج. ومع ارتفاع الطلب، تعمل الشركات على توسيع عروضها والابتكار لتلبية احتياجات المستهلكين والاستفادة من الاتجاهات الناشئة، مما يؤدي إلى زيادة نمو السوق.
تشير كثافة اللاعبين في السوق إلى توزيع الشركات أو المؤسسات العاملة في سوق أو صناعة معينة. وهي تشير إلى عدد المنافسين (اللاعبين في السوق) الموجودين في مساحة سوق معينة نسبة إلى حجمها أو قيمتها السوقية الإجمالية.
الشركات الرئيسية العاملة في سوق الماسحات الضوئية الحرارية هي:
- شركة فلير سيستمز
- شركة أميتك
- شركة روبرت بوش المحدودة
- 3م
- ليوناردو
- الصناعات الكهربائية والبصرية
إخلاء المسؤولية : الشركات المذكورة أعلاه ليست مرتبة بأي ترتيب معين.
- احصل على نظرة عامة على أهم اللاعبين الرئيسيين في سوق الماسحات الحرارية
أخبار سوق الماسحات الحرارية والتطورات الأخيرة
يتم تقييم سوق الماسحات الحرارية من خلال جمع البيانات النوعية والكمية بعد البحث الأولي والثانوي، والتي تتضمن منشورات الشركات المهمة وبيانات الجمعيات وقواعد البيانات. فيما يلي قائمة بالتطورات في سوق الماسحات الحرارية والاستراتيجيات:
- في يناير 2024، ستقدم شركة Valeo وTeledyne FLIR أول تقنية تصوير حراري من المستوى B لسلامة السيارات (ASIL) لأنظمة ADAS للرؤية الليلية. سيكمل هذا النظام مجموعة أجهزة الاستشعار الكبيرة من Valeo ويعتمد على مجموعة برامج ADAS من Valeo لدعم وظائف مثل الكبح التلقائي في حالات الطوارئ (AEB) في الليل للمركبات الخاصة والتجارية وكذلك للسيارات ذاتية القيادة. (المصدر: Valeo، بيان صحفي، 2024)
تقرير سوق الماسحات الحرارية والتغطية والنتائج المتوقعة
يوفر تقرير "حجم سوق الماسحات الضوئية الحرارية والتوقعات (2021-2031)" تحليلاً مفصلاً للسوق يغطي المجالات التالية:
- حجم السوق والتوقعات على المستويات العالمية والإقليمية والوطنية لجميع قطاعات السوق الرئيسية التي يغطيها النطاق
- ديناميكيات السوق مثل المحركات والقيود والفرص الرئيسية
- الاتجاهات المستقبلية الرئيسية
- تحليل مفصل لقوى PEST/Porter الخمس وSWOT
- تحليل السوق العالمي والإقليمي الذي يغطي اتجاهات السوق الرئيسية واللاعبين الرئيسيين واللوائح والتطورات الأخيرة في السوق
- تحليل المشهد الصناعي والمنافسة الذي يغطي تركيز السوق، وتحليل خريطة الحرارة، واللاعبين البارزين، والتطورات الأخيرة
- ملفات تعريف الشركة التفصيلية
- التحليل التاريخي (سنتان)، السنة الأساسية، التوقعات (7 سنوات) مع معدل النمو السنوي المركب
- تحليل PEST و SWOT
- حجم السوق والقيمة / الحجم - عالميًا وإقليميًا وقطريًا
- الصناعة والمنافسة
- مجموعة بيانات Excel


- Aerosol Paints Market
- Pharmacovigilance and Drug Safety Software Market
- Analog-to-Digital Converter Market
- Medical and Research Grade Collagen Market
- Small Internal Combustion Engine Market
- Cell Line Development Market
- Underwater Connector Market
- Greens Powder Market
- Industrial Valves Market
- Hummus Market

Report Coverage
Revenue forecast, Company Analysis, Industry landscape, Growth factors, and Trends

Segment Covered
This text is related
to segments covered.

Regional Scope
North America, Europe, Asia Pacific, Middle East & Africa, South & Central America

Country Scope
This text is related
to country scope.
الأسئلة الشائعة
The incremental growth expected to be recorded for the global thermal scanners market during the forecast period is US$ 5.37 billion.
The key players holding majority shares in the global thermal scanners market are FLIR Systems, Inc., AMETEK Inc., Robert Bosch GmbH, 3M, and Leonardo.
The global thermal scanners market is expected to reach US$ 10.73 billion by 2031.
The rising demand for high-end automobiles to play a significant role in the global thermal scanners market in the coming years.
The increasing demand for thermal scanners in commercial and healthcare sectors and increasing investment in research & development for developing innovative thermal scanners are the major factors that propel the global thermal scanners market.
The global thermal scanners market was estimated to be US$ 5.36 billion in 2023 and is expected to grow at a CAGR of 9.1% during the forecast period 2023 - 2031.
Trends and growth analysis reports related to Electronics and Semiconductor : READ MORE..
The Insight Partners performs research in 4 major stages: Data Collection & Secondary Research, Primary Research, Data Analysis and Data Triangulation & Final Review.
- Data Collection and Secondary Research:
As a market research and consulting firm operating from a decade, we have published and advised several client across the globe. First step for any study will start with an assessment of currently available data and insights from existing reports. Further, historical and current market information is collected from Investor Presentations, Annual Reports, SEC Filings, etc., and other information related to company’s performance and market positioning are gathered from Paid Databases (Factiva, Hoovers, and Reuters) and various other publications available in public domain.
Several associations trade associates, technical forums, institutes, societies and organization are accessed to gain technical as well as market related insights through their publications such as research papers, blogs and press releases related to the studies are referred to get cues about the market. Further, white papers, journals, magazines, and other news articles published in last 3 years are scrutinized and analyzed to understand the current market trends.
- Primary Research:
The primarily interview analysis comprise of data obtained from industry participants interview and answers to survey questions gathered by in-house primary team.
For primary research, interviews are conducted with industry experts/CEOs/Marketing Managers/VPs/Subject Matter Experts from both demand and supply side to get a 360-degree view of the market. The primary team conducts several interviews based on the complexity of the markets to understand the various market trends and dynamics which makes research more credible and precise.
A typical research interview fulfils the following functions:
- Provides first-hand information on the market size, market trends, growth trends, competitive landscape, and outlook
- Validates and strengthens in-house secondary research findings
- Develops the analysis team’s expertise and market understanding
Primary research involves email interactions and telephone interviews for each market, category, segment, and sub-segment across geographies. The participants who typically take part in such a process include, but are not limited to:
- Industry participants: VPs, business development managers, market intelligence managers and national sales managers
- Outside experts: Valuation experts, research analysts and key opinion leaders specializing in the electronics and semiconductor industry.
Below is the breakup of our primary respondents by company, designation, and region:

Once we receive the confirmation from primary research sources or primary respondents, we finalize the base year market estimation and forecast the data as per the macroeconomic and microeconomic factors assessed during data collection.
- Data Analysis:
Once data is validated through both secondary as well as primary respondents, we finalize the market estimations by hypothesis formulation and factor analysis at regional and country level.
- Macro-Economic Factor Analysis:
We analyse macroeconomic indicators such the gross domestic product (GDP), increase in the demand for goods and services across industries, technological advancement, regional economic growth, governmental policies, the influence of COVID-19, PEST analysis, and other aspects. This analysis aids in setting benchmarks for various nations/regions and approximating market splits. Additionally, the general trend of the aforementioned components aid in determining the market's development possibilities.
- Country Level Data:
Various factors that are especially aligned to the country are taken into account to determine the market size for a certain area and country, including the presence of vendors, such as headquarters and offices, the country's GDP, demand patterns, and industry growth. To comprehend the market dynamics for the nation, a number of growth variables, inhibitors, application areas, and current market trends are researched. The aforementioned elements aid in determining the country's overall market's growth potential.
- Company Profile:
The “Table of Contents” is formulated by listing and analyzing more than 25 - 30 companies operating in the market ecosystem across geographies. However, we profile only 10 companies as a standard practice in our syndicate reports. These 10 companies comprise leading, emerging, and regional players. Nonetheless, our analysis is not restricted to the 10 listed companies, we also analyze other companies present in the market to develop a holistic view and understand the prevailing trends. The “Company Profiles” section in the report covers key facts, business description, products & services, financial information, SWOT analysis, and key developments. The financial information presented is extracted from the annual reports and official documents of the publicly listed companies. Upon collecting the information for the sections of respective companies, we verify them via various primary sources and then compile the data in respective company profiles. The company level information helps us in deriving the base number as well as in forecasting the market size.
- Developing Base Number:
Aggregation of sales statistics (2020-2022) and macro-economic factor, and other secondary and primary research insights are utilized to arrive at base number and related market shares for 2022. The data gaps are identified in this step and relevant market data is analyzed, collected from paid primary interviews or databases. On finalizing the base year market size, forecasts are developed on the basis of macro-economic, industry and market growth factors and company level analysis.
- Data Triangulation and Final Review:
The market findings and base year market size calculations are validated from supply as well as demand side. Demand side validations are based on macro-economic factor analysis and benchmarks for respective regions and countries. In case of supply side validations, revenues of major companies are estimated (in case not available) based on industry benchmark, approximate number of employees, product portfolio, and primary interviews revenues are gathered. Further revenue from target product/service segment is assessed to avoid overshooting of market statistics. In case of heavy deviations between supply and demand side values, all thes steps are repeated to achieve synchronization.
We follow an iterative model, wherein we share our research findings with Subject Matter Experts (SME’s) and Key Opinion Leaders (KOLs) until consensus view of the market is not formulated – this model negates any drastic deviation in the opinions of experts. Only validated and universally acceptable research findings are quoted in our reports.
We have important check points that we use to validate our research findings – which we call – data triangulation, where we validate the information, we generate from secondary sources with primary interviews and then we re-validate with our internal data bases and Subject matter experts. This comprehensive model enables us to deliver high quality, reliable data in shortest possible time.
 احصل على عينة مجانية لهذا التقرير