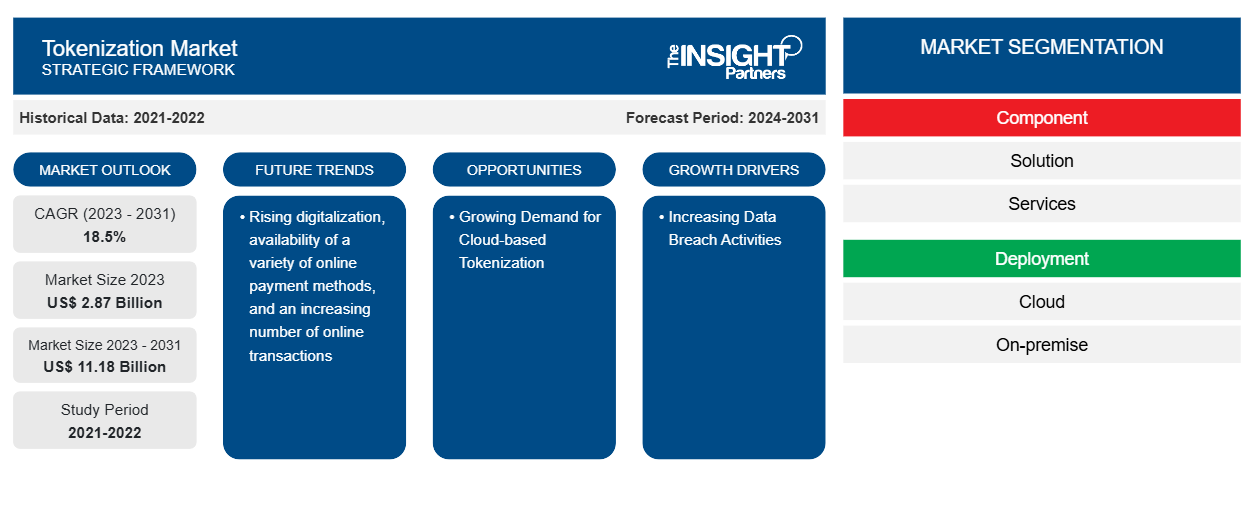
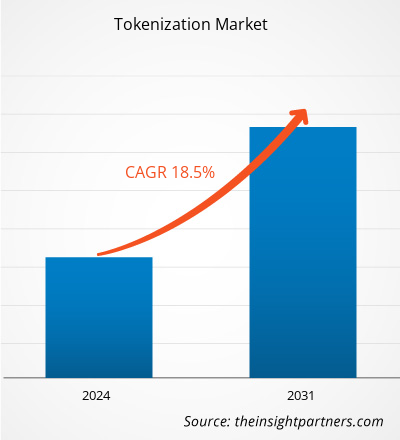
من المتوقع أن يصل حجم سوق التوكنات إلى 11.18 مليار دولار أمريكي بحلول عام 2031 من 2.87 مليار دولار أمريكي في عام 2023. ومن المتوقع أن يسجل السوق معدل نمو سنوي مركب بنسبة 18.5٪ في الفترة 2023-2031. ومن المرجح أن يظل التحول الرقمي المتزايد وتوافر مجموعة متنوعة من طرق الدفع عبر الإنترنت والعدد المتزايد من المعاملات عبر الإنترنت اتجاهًا رئيسيًا لسوق التوكنات.
تحليل سوق التوكنات
ينمو سوق التوكن بوتيرة سريعة بسبب أنشطة خرق البيانات المتزايدة والمخاوف المتزايدة بشأن أمن البيانات بين المستهلكين في جميع أنحاء العالم. يتوسع السوق بشكل مطرد، مدفوعًا بطلب المستهلكين على الدفع بدون تلامس. علاوة على ذلك، فإن الطلب المتزايد على التوكن المستند إلى السحابة والمبادرات الحكومية للمعاملات غير النقدية توفر فرصًا مربحة لنمو سوق التوكن.
نظرة عامة على سوق الرمزية
إن عملية تحويل البيانات الحساسة إلى رموز هي عملية تبادل أو تحويل البيانات الحساسة إلى أجزاء أصغر تسمى "الرموز". ويمكن استخدامها في قاعدة بيانات أو نظام داخلي دون إخضاعها للنطاق. والرموز ليس لها قيمة جوهرية تقريبًا؛ فهي مفيدة فقط عندما تمثل شيئًا مهمًا، مثل رقم الحساب الأساسي لبطاقة الائتمان (PAN) أو رقم الضمان الاجتماعي (SSN). وتخزن معظم المؤسسات البيانات الحساسة في أنظمتها، سواء كانت معلومات بطاقة الائتمان أو المعلومات الطبية أو أرقام الضمان الاجتماعي أو أي شيء آخر يجب تأمينه وحمايته. وتتيح عملية تحويل البيانات إلى رموز للمؤسسات الاستمرار في استخدام هذه البيانات لأغراض تجارية دون المخاطرة أو الآثار المترتبة على الامتثال للاحتفاظ بالبيانات الحساسة داخليًا.
قم بتخصيص هذا التقرير ليناسب متطلباتك
ستحصل على تخصيص لأي تقرير - مجانًا - بما في ذلك أجزاء من هذا التقرير، أو تحليل على مستوى الدولة، وحزمة بيانات Excel، بالإضافة إلى الاستفادة من العروض والخصومات الرائعة للشركات الناشئة والجامعات
سوق الرمزنة:
- احصل على أهم اتجاهات السوق الرئيسية لهذا التقرير.ستتضمن هذه العينة المجانية تحليلاً للبيانات، بدءًا من اتجاهات السوق وحتى التقديرات والتوقعات.
محركات وفرص سوق التوكنات
زيادة أنشطة اختراق البيانات هي المحرك للسوق
يستهدف المجرمون الشركات التي تقبل بطاقات الخصم والائتمان. تحتوي المدفوعات التي تتم من هذه البطاقات على معلومات قيمة يمكن سرقتها. وهذا يزيد من اعتماد الرمز المميز بين الشركات لحماية المعلومات القيمة. يساعد الرمز المميز الشركات على حماية نفسها من أي عواقب مالية سلبية لسرقة البيانات. لا يحمي الرمز المميز المعلومات المالية فحسب، بل يدعم الشركات أيضًا لحماية بياناتها الشخصية من الخروقات. علاوة على ذلك، فإن التبني المتزايد لرمزية بطاقات الائتمان بين الشركات لتحسين أمان البيانات للشركات عبر الإنترنت هو محرك السوق. يوفر الرمز المميز أمان البيانات من وقت التقاط البيانات إلى التخزين من خلال القضاء على التخزين الفعلي لأرقام بطاقات الائتمان في أجهزة نقاط البيع والأنظمة الداخلية.
الطلب المتزايد على التوكنات المستندة إلى السحابة – فرصة في سوق التوكنات
إن عملية التجزئة القائمة على السحابة هي عملية تبادل البيانات الحساسة بعنصر نائب غير حساس لا رجعة فيه يُعرف باسم الرمز مع الحفاظ بشكل آمن على البيانات الأصلية الحساسة خارج الأنظمة الداخلية للشركة. تعد عملية التجزئة القائمة على السحابة أسهل في التنفيذ وأقل تكلفة من عملية التجزئة التقليدية في الموقع. يساعد هذا الشركات في تقليل المخاطر والتعرض للامتثال من خلال إزالة البيانات الحساسة من بيئات البيانات الخاصة بها. يمكن للشركات أيضًا حماية هذه البيانات مع الحفاظ على فائدة ومرونة عملياتها التجارية الحالية من خلال استخدام الرموز التي تحافظ على التنسيق والطول كعنصر نائب للبيانات الأصلية الحساسة. وهذا يخلق فرصًا كبيرة في السوق خلال فترة التنبؤ.
تقرير تحليل تجزئة سوق التجزئة
إن القطاعات الرئيسية التي ساهمت في استخلاص تحليل سوق الرمزية هي المكونات والنشر وحجم المؤسسة والقطاع الرأسي.
- بناءً على المكون، ينقسم سوق التوكنات إلى حلول وخدمات. احتل قطاع الحلول حصة سوقية أكبر في عام 2023.
- من حيث النشر، يتم تصنيف السوق إلى سحابي ومحلي. احتل قطاع السحابة حصة سوقية أكبر في عام 2023.
- على أساس حجم المؤسسة، يتم تقسيم سوق الرمز المميز إلى الشركات الصغيرة والمتوسطة الحجم والشركات الكبيرة. احتلت شريحة الشركات الصغيرة والمتوسطة الحجم حصة سوقية أكبر في عام 2023.
- من حيث القطاعات الرأسية، يتم تقسيم سوق الرمزنة إلى قطاعات BFSI، وتجزئة، وتكنولوجيا المعلومات والاتصالات، والرعاية الصحية، والحكومة، وغيرها. احتل قطاع BFSI حصة سوقية أكبر في عام 2023.
تحليل حصة سوق التوكنات حسب المنطقة الجغرافية
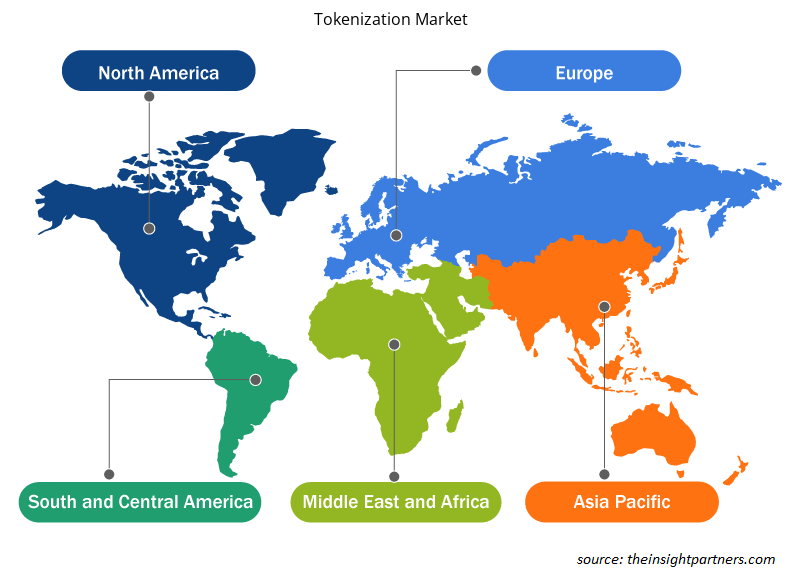
ينقسم النطاق الجغرافي لتقرير سوق التوكين بشكل أساسي إلى خمس مناطق: أمريكا الشمالية، ومنطقة آسيا والمحيط الهادئ، وأوروبا، والشرق الأوسط وأفريقيا، وأمريكا الجنوبية/أمريكا الجنوبية والوسطى.
من حيث الإيرادات، استحوذت أمريكا الشمالية على أكبر حصة في سوق الرموز المميزة، وذلك بسبب التبني السريع للتقنيات المبتكرة الجديدة والطلب المتزايد على الحلول القائمة على السحابة بين الشركات. كما أن الاستخدام المتزايد لطرق الدفع عبر الإنترنت وتزايد الشراء الآن والدفع لاحقًا باستخدام العملات المشفرة يغذي السوق. تقدم العديد من الشركات المالية في الولايات المتحدة، مثل Visa وMastercard، خدمات المعاملات عبر الإنترنت وحلول الدفع للعملاء في جميع أنحاء العالم. وهذا يزيد من الطلب على الرموز المميزة لحماية البيانات. على سبيل المثال، في أغسطس 2022، أصدرت Visa أكثر من 4 مليارات رمز شبكة عالميًا من خلال خدمة Visa Token Service (VTS) لدعم الرموز الرقمية.
رؤى إقليمية حول سوق الرمزنة
لقد قام المحللون في Insight Partners بشرح الاتجاهات والعوامل الإقليمية المؤثرة على سوق التوكين خلال فترة التوقعات بشكل شامل. يناقش هذا القسم أيضًا قطاعات سوق التوكين والجغرافيا في جميع أنحاء أمريكا الشمالية وأوروبا ومنطقة آسيا والمحيط الهادئ والشرق الأوسط وأفريقيا وأمريكا الجنوبية والوسطى.
- احصل على البيانات الإقليمية المحددة لسوق التوكنات
نطاق تقرير سوق التوكنات
| سمة التقرير | تفاصيل |
|---|---|
| حجم السوق في عام 2023 | 2.87 مليار دولار أمريكي |
| حجم السوق بحلول عام 2031 | 11.18 مليار دولار أمريكي |
| معدل النمو السنوي المركب العالمي (2023 - 2031) | 18.5% |
| البيانات التاريخية | 2021-2022 |
| فترة التنبؤ | 2024-2031 |
| القطاعات المغطاة | حسب المكون
|
| المناطق والدول المغطاة | أمريكا الشمالية
|
| قادة السوق وملفات تعريف الشركات الرئيسية |
|
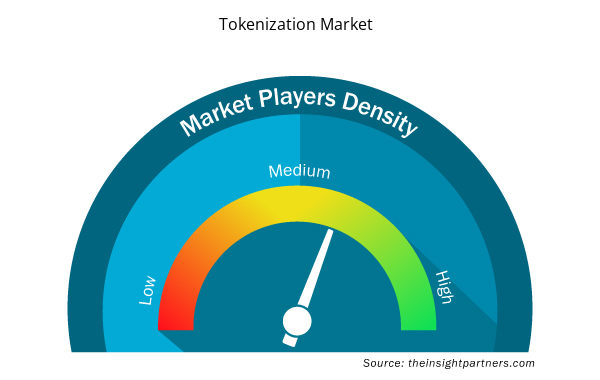
كثافة اللاعبين في سوق الرمزنة: فهم تأثيرها على ديناميكيات الأعمال
يشهد سوق الرمزنة نموًا سريعًا، مدفوعًا بالطلب المتزايد من المستخدم النهائي بسبب عوامل مثل تفضيلات المستهلك المتطورة والتقدم التكنولوجي والوعي المتزايد بفوائد المنتج. ومع ارتفاع الطلب، تعمل الشركات على توسيع عروضها والابتكار لتلبية احتياجات المستهلكين والاستفادة من الاتجاهات الناشئة، مما يؤدي إلى زيادة نمو السوق.
تشير كثافة اللاعبين في السوق إلى توزيع الشركات أو المؤسسات العاملة في سوق أو صناعة معينة. وهي تشير إلى عدد المنافسين (اللاعبين في السوق) الموجودين في مساحة سوق معينة نسبة إلى حجمها أو قيمتها السوقية الإجمالية.
الشركات الرئيسية العاملة في سوق التوكنات هي:
- شركة برودكوم
- فيوتشركس
- شركة فيسيرف
- شركة مايكرو فوكس الدولية المحدودة
- شركة أوبن تكست
- شركة سيكوينت للبرمجيات
إخلاء المسؤولية : الشركات المذكورة أعلاه ليست مرتبة بأي ترتيب معين.
- احصل على نظرة عامة على أهم اللاعبين الرئيسيين في سوق التوكنات
أخبار سوق التوكنات والتطورات الأخيرة
يتم تقييم سوق التوكنات من خلال جمع البيانات النوعية والكمية بعد البحث الأولي والثانوي، والتي تتضمن منشورات الشركات المهمة وبيانات الجمعيات وقواعد البيانات. فيما يلي قائمة بالتطورات في سوق التوكنات والاستراتيجيات:
- يناير 2024: يعلن مركز الابتكار التابع لبنك التسويات الدولية عن أول ستة مشاريع لبرنامج العمل لعام 2024، بما في ذلك المشاريع القادمة التي تركز على السلامة والأمن، والتمويل الأخضر، والبنية التحتية المالية من الجيل التالي، كما يتم التخطيط لأعمال إضافية في مجال تحليلات البيانات المتقدمة والرمزية. (المصدر: بنك التسويات الدولية، بيان صحفي، 2024)
تغطية تقرير سوق الرمزنة والمنتجات النهائية
يوفر تقرير "حجم سوق الرمز المميز والتوقعات (2021-2031)" تحليلاً مفصلاً للسوق يغطي المجالات التالية:
- حجم السوق والتوقعات على المستويات العالمية والإقليمية والوطنية لجميع قطاعات السوق الرئيسية التي يغطيها النطاق
- ديناميكيات السوق مثل المحركات والقيود والفرص الرئيسية
- الاتجاهات المستقبلية الرئيسية
- تحليل مفصل لقوى PEST/Porter الخمس وSWOT
- تحليل السوق العالمي والإقليمي الذي يغطي اتجاهات السوق الرئيسية واللاعبين الرئيسيين واللوائح والتطورات الأخيرة في السوق
- تحليل المشهد الصناعي والمنافسة الذي يغطي تركيز السوق، وتحليل خريطة الحرارة، واللاعبين البارزين، والتطورات الأخيرة
- ملفات تعريف الشركة التفصيلية
- التحليل التاريخي (سنتان)، السنة الأساسية، التوقعات (7 سنوات) مع معدل النمو السنوي المركب
- تحليل PEST و SWOT
- حجم السوق والقيمة / الحجم - عالميًا وإقليميًا وقطريًا
- الصناعة والمنافسة
- مجموعة بيانات Excel


- Online Exam Proctoring Market
- Electronic Data Interchange Market
- Drain Cleaning Equipment Market
- Pharmacovigilance and Drug Safety Software Market
- Hand Sanitizer Market
- Investor ESG Software Market
- Hydrogen Compressors Market
- Rare Neurological Disease Treatment Market
- Cosmetic Bioactive Ingredients Market
- Machine Condition Monitoring Market

Report Coverage
Revenue forecast, Company Analysis, Industry landscape, Growth factors, and Trends

Segment Covered
This text is related
to segments covered.

Regional Scope
North America, Europe, Asia Pacific, Middle East & Africa, South & Central America

Country Scope
This text is related
to country scope.
الأسئلة الشائعة
The global tokenization market was estimated to be US$ 2.87 billion in 2023 and is expected to grow at a CAGR of 18.5% during the forecast period 2023 - 2031.
The increasing data breach activities and growing data security concerns among consumers across the globe are the major factors that propel the global tokenization market.
The Rising digitalization, availability of a variety of online payment methods, and increasing number of online transactions are anticipated to play a significant role in the global tokenization market in the coming years.
The key players holding majority shares in the global tokenization market are Broadcom, Inc, FUTUREX, Fiserv, Inc., Micro Focus International plc, and OpenText Corporation.
The incremental growth expected to be recorded for the global tokenization market during the forecast period is US$ 8.31 billion.
The global tokenization market is expected to reach US$ 11.18 billion by 2031.
Trends and growth analysis reports related to Technology, Media and Telecommunications : READ MORE..
The Insight Partners performs research in 4 major stages: Data Collection & Secondary Research, Primary Research, Data Analysis and Data Triangulation & Final Review.
- Data Collection and Secondary Research:
As a market research and consulting firm operating from a decade, we have published and advised several client across the globe. First step for any study will start with an assessment of currently available data and insights from existing reports. Further, historical and current market information is collected from Investor Presentations, Annual Reports, SEC Filings, etc., and other information related to company’s performance and market positioning are gathered from Paid Databases (Factiva, Hoovers, and Reuters) and various other publications available in public domain.
Several associations trade associates, technical forums, institutes, societies and organization are accessed to gain technical as well as market related insights through their publications such as research papers, blogs and press releases related to the studies are referred to get cues about the market. Further, white papers, journals, magazines, and other news articles published in last 3 years are scrutinized and analyzed to understand the current market trends.
- Primary Research:
The primarily interview analysis comprise of data obtained from industry participants interview and answers to survey questions gathered by in-house primary team.
For primary research, interviews are conducted with industry experts/CEOs/Marketing Managers/VPs/Subject Matter Experts from both demand and supply side to get a 360-degree view of the market. The primary team conducts several interviews based on the complexity of the markets to understand the various market trends and dynamics which makes research more credible and precise.
A typical research interview fulfils the following functions:
- Provides first-hand information on the market size, market trends, growth trends, competitive landscape, and outlook
- Validates and strengthens in-house secondary research findings
- Develops the analysis team’s expertise and market understanding
Primary research involves email interactions and telephone interviews for each market, category, segment, and sub-segment across geographies. The participants who typically take part in such a process include, but are not limited to:
- Industry participants: VPs, business development managers, market intelligence managers and national sales managers
- Outside experts: Valuation experts, research analysts and key opinion leaders specializing in the electronics and semiconductor industry.
Below is the breakup of our primary respondents by company, designation, and region:

Once we receive the confirmation from primary research sources or primary respondents, we finalize the base year market estimation and forecast the data as per the macroeconomic and microeconomic factors assessed during data collection.
- Data Analysis:
Once data is validated through both secondary as well as primary respondents, we finalize the market estimations by hypothesis formulation and factor analysis at regional and country level.
- Macro-Economic Factor Analysis:
We analyse macroeconomic indicators such the gross domestic product (GDP), increase in the demand for goods and services across industries, technological advancement, regional economic growth, governmental policies, the influence of COVID-19, PEST analysis, and other aspects. This analysis aids in setting benchmarks for various nations/regions and approximating market splits. Additionally, the general trend of the aforementioned components aid in determining the market's development possibilities.
- Country Level Data:
Various factors that are especially aligned to the country are taken into account to determine the market size for a certain area and country, including the presence of vendors, such as headquarters and offices, the country's GDP, demand patterns, and industry growth. To comprehend the market dynamics for the nation, a number of growth variables, inhibitors, application areas, and current market trends are researched. The aforementioned elements aid in determining the country's overall market's growth potential.
- Company Profile:
The “Table of Contents” is formulated by listing and analyzing more than 25 - 30 companies operating in the market ecosystem across geographies. However, we profile only 10 companies as a standard practice in our syndicate reports. These 10 companies comprise leading, emerging, and regional players. Nonetheless, our analysis is not restricted to the 10 listed companies, we also analyze other companies present in the market to develop a holistic view and understand the prevailing trends. The “Company Profiles” section in the report covers key facts, business description, products & services, financial information, SWOT analysis, and key developments. The financial information presented is extracted from the annual reports and official documents of the publicly listed companies. Upon collecting the information for the sections of respective companies, we verify them via various primary sources and then compile the data in respective company profiles. The company level information helps us in deriving the base number as well as in forecasting the market size.
- Developing Base Number:
Aggregation of sales statistics (2020-2022) and macro-economic factor, and other secondary and primary research insights are utilized to arrive at base number and related market shares for 2022. The data gaps are identified in this step and relevant market data is analyzed, collected from paid primary interviews or databases. On finalizing the base year market size, forecasts are developed on the basis of macro-economic, industry and market growth factors and company level analysis.
- Data Triangulation and Final Review:
The market findings and base year market size calculations are validated from supply as well as demand side. Demand side validations are based on macro-economic factor analysis and benchmarks for respective regions and countries. In case of supply side validations, revenues of major companies are estimated (in case not available) based on industry benchmark, approximate number of employees, product portfolio, and primary interviews revenues are gathered. Further revenue from target product/service segment is assessed to avoid overshooting of market statistics. In case of heavy deviations between supply and demand side values, all thes steps are repeated to achieve synchronization.
We follow an iterative model, wherein we share our research findings with Subject Matter Experts (SME’s) and Key Opinion Leaders (KOLs) until consensus view of the market is not formulated – this model negates any drastic deviation in the opinions of experts. Only validated and universally acceptable research findings are quoted in our reports.
We have important check points that we use to validate our research findings – which we call – data triangulation, where we validate the information, we generate from secondary sources with primary interviews and then we re-validate with our internal data bases and Subject matter experts. This comprehensive model enables us to deliver high quality, reliable data in shortest possible time.
 احصل على عينة مجانية لهذا التقرير