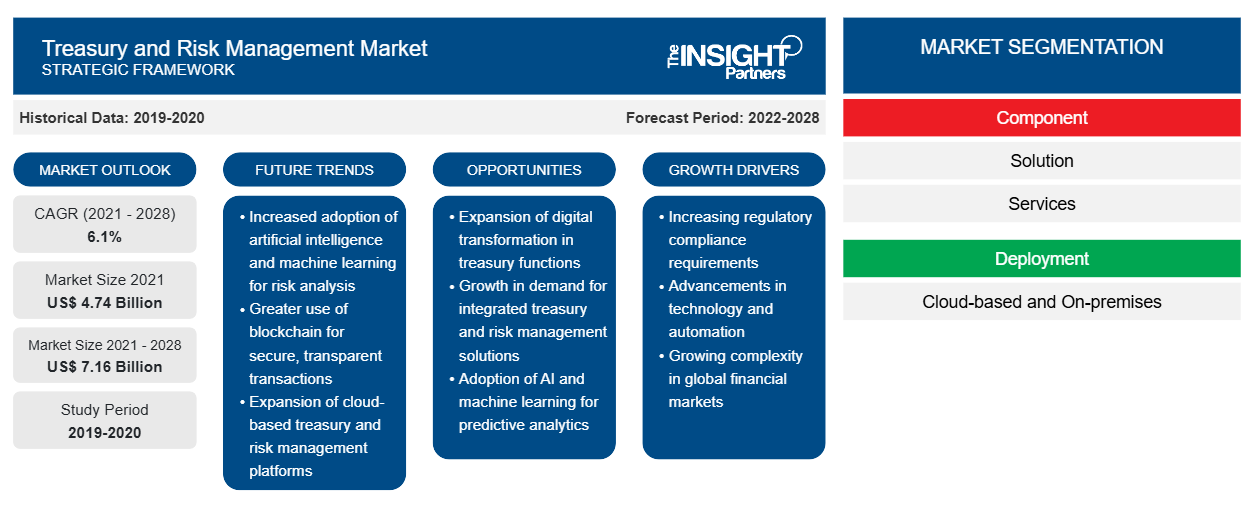
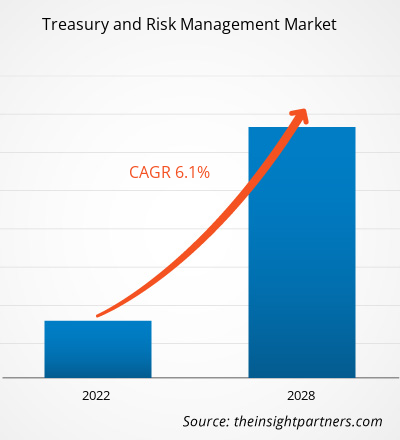
من المتوقع أن ينمو سوق الخزانة وإدارة المخاطر من 4,739.39 مليون دولار أمريكي في عام 2021 إلى 7,156.90 مليون دولار أمريكي بحلول عام 2028؛ ومن المتوقع أن ينمو بمعدل نمو سنوي مركب قدره 6.1٪ خلال الفترة 2021-2028.
يساعد الذكاء الاصطناعي (AI) صناعة التمويل على تبسيط وتحسين العمليات المختلفة، بدءًا من قرارات الائتمان إلى التحليل الكمي في إدارة المخاطر المالية والخزينة . تسهل حلول الذكاء الاصطناعي تقييمات أكثر دقة للمقترضين المحرومين تقليديًا، بما في ذلك جيل الألفية، في عملية اتخاذ القرارات الائتمانية، وبالتالي، تساعد البنوك ومقرضي الائتمان على اتخاذ قرارات تجارية أكثر ذكاءً. علاوة على ذلك، يعمل الذكاء الاصطناعي على تسهيل عملية التمويل وأتمتتها في العديد من البنوك وشركات الاستثمار وشركات إدارة الثروات. على سبيل المثال، تستخدم شركة aixigo AG حلول إدارة الثروات القائمة على الذكاء الاصطناعي لتوفير التحول الرقمي والخدمات المصرفية الخاصة والخدمات المصرفية للأفراد والمستشارين الآليين وخدمات إدارة الأصول. يستخدم برنامج المستشار الآلي لشركة aixigo AG الذكاء الاصطناعي لاستبدال المكونات البشرية في نقطة البيع أثناء عملية الاستثمار المالي. وبالمثل، تقدم شركة Synechron Inc. حلاً قائمًا على الذكاء الاصطناعي يسمى Neo لصناعة الخدمات المالية. يجمع Neo بشكل فريد بين الاستشارات الرقمية والتجارية والتكنولوجية لشركة Synechron لتوجيه المؤسسات المالية من خلال نشر حلول الذكاء الاصطناعي للتغلب على تحديات الأعمال المعقدة. لذلك، من المتوقع أن يؤدي الارتفاع في شعبية المساعدة القائمة على الذكاء الاصطناعي في البنوك وشركات الاستثمار وشركات إدارة الثروات إلى دفع حصة سوق الخزانة وإدارة المخاطر خلال الفترة المتوقعة.
قم بتخصيص هذا التقرير ليناسب متطلباتك
ستحصل على تخصيص لأي تقرير - مجانًا - بما في ذلك أجزاء من هذا التقرير، أو تحليل على مستوى الدولة، وحزمة بيانات Excel، بالإضافة إلى الاستفادة من العروض والخصومات الرائعة للشركات الناشئة والجامعات
- احصل على أهم اتجاهات السوق الرئيسية لهذا التقرير.ستتضمن هذه العينة المجانية تحليلاً للبيانات، بدءًا من اتجاهات السوق وحتى التقديرات والتوقعات.
تأثير جائحة كوفيد-19 على سوق الخزانة وإدارة المخاطر العالمية
قبل جائحة كوفيد-19، كان الطلب على حلول/خدمات إدارة الخزانة والمخاطر سائدًا بسبب الرقمنة المتنامية. على سبيل المثال، في أبريل 2019، وفقًا للمقال الذي نشرته بيزنس واير، بلغ الإنفاق على التحول الرقمي 1.18 تريليون دولار أمريكي في عام 2019، بزيادة قدرها 17.9% عن عام 2018.
وفقًا لتحليل سوق الخزانة وإدارة المخاطر، في عام 2020، أثر جائحة كوفيد-19 بشكل ملحوظ على عمليات الشركات وغير بعض الجوانب الأساسية للأعمال. أدى انتشار كوفيد-19 في عام 2020 إلى عمليات إغلاق عالمية في العديد من البلدان لتجنب الأزمة وتقليل مخاطر الإصابة. وقد أدى هذا إلى طفرة كبيرة في تبني التقنيات الرقمية لإبقاء الشركات تعمل أثناء تفشي كوفيد-19. تحولت معظم الشركات إلى البنية التحتية السحابية واستمرت في عملياتها مع الحفاظ على قيود الإغلاق. علاوة على ذلك، دفع جائحة كوفيد-19 الشركات إلى التفكير في مستقبل الخزانة المؤسسية بما يتماشى مع الرقمنة وإدارة المخاطر المتكاملة والتركيز المتجدد على تحسين التكلفة وإدارة النقد. وبالتالي، شهد اعتماد حلول/خدمات الخزانة وإدارة المخاطر ارتفاعًا في عام 2020. لذلك، كان التأثير الإجمالي لجائحة كوفيد-19 على سوق الخزانة وإدارة المخاطر إيجابيًا في عام 2020.
وفقًا لتحليل سوق إدارة الخزانة والمخاطر في عامي 2021 و2022، فإن تخفيف إجراءات الإغلاق، وتبني تقنيات الحوسبة السحابية من قبل العديد من الشركات، وانتقال المنظمات نحو الأتمتة باستخدام تقنيات مثل الذكاء الاصطناعي والتعلم الآلي لإدارة النقد، كان لها تأثير إيجابي على نمو سوق إدارة الخزانة والمخاطر. على سبيل المثال، في مايو 2021، أعلنت شركة Refinitiv وIBSFINtech عن تعاون لإطلاق حل جديد لإدارة الخزانة الآلية قائم على السحابة. سيكون الحل المسمى InTReaX حلاً لإدارة النقد والسيولة ومخاطر العملة. وبالتالي، فإن اعتماد حلول إدارة الخزانة القائمة على السحابة من قبل العديد من الشركات سيخلق فرصًا متعددة للاعبين في السوق.
بلغ حجم سوق إدارة الخزانة والمخاطر قبل جائحة كوفيد-19 نحو 4,337.46 مليون دولار أمريكي في عام 2019. وبلغ حجم السوق أثناء الجائحة نحو 4,526.57 مليون دولار أمريكي في عام 2020. وعلاوة على ذلك، بلغ حجم السوق في عام 2021 نحو 4,739.39 مليون دولار أمريكي. وبالتالي، كان التأثير الإجمالي لجائحة كوفيد-19 على السوق إيجابيًا في عام 2020.
رؤى حول سوق الخزانة وإدارة المخاطر
تزايد الطلب على خدمات التحليلات المالية
تستخدم المؤسسات أدوات التحليلات المالية للحصول على رؤى حول بعض الاتجاهات الحالية والمستقبلية لتحسين أداء أعمالها. تقدم خدمات التحليلات المالية تحليل جودة البيانات المالية، وتخطيط البيانات، وتحليلات العملاء، والتحليلات التنبؤية، وتحليل المكونات الرئيسية، وجمع البيانات المالية. تتطلب هذه التحليلات بيانات مالية مفصلة وبيانات أخرى ذات صلة لتحديد الأنماط. بناءً على هذا التحليل، تقوم المؤسسات بإجراء تنبؤات بشأن مشتريات عملائها وفترة عمل موظفيها. وبالتالي، تساعد خدمات التحليلات المالية المؤسسات على تحسين الربحية والتدفق النقدي وقيمة الأعمال. يمكنهم استخدام الرؤى المكتسبة من خلال هذه التحليلات لتحسين إيراداتهم وعملياتهم التجارية. على سبيل المثال، توفر شركة أكسنتشر بي إل سي أحدث حلول البيانات والتحليلات لمقدمي الخدمات المالية وتساعدهم في نشرها. يتضمن تحليل تقرير الخزانة وإدارة المخاطر خدمات لهذه الشركات مع تحليلات التكلفة وتحليلات أداء المؤسسة. مع التركيز الأساسي على بيانات الدخل والميزانيات العمومية وبيانات التدفق النقدي، يتم استخدام التحليل المالي لتقييم الاتجاهات الاقتصادية، ووضع السياسات المالية، وصياغة خطط الأعمال طويلة الأجل، وتحديد المشاريع أو الشركات للاستثمار. يقوم مقدمو الخدمات المالية مثل البنوك الاستثمارية بتوليد وتخزين المزيد من البيانات مقارنة بالشركات الأخرى، حيث أن التمويل هو عمل يعتمد على المعاملات بشكل كبير. تستخدم البنوك البيانات لتقدير المخاطر لتحسين الربحية الإجمالية. وبالتالي، مع الفوائد المتعددة في البنوك وشركات الاستثمار، يتزايد الطلب على خدمات التحليلات المالية بشكل كبير، وبالتالي تعزيز نمو سوق الخزانة وإدارة المخاطر.
إن وظائف الخزانة هي المستفيدة الواضحة من التحليلات المالية، والتي توفر رؤى أفضل للعملاء والمنافسين والربحية والعمليات. كما يمكن للتحليلات المالية أن تعزز قدرة المدير المالي على قيادة عملية اتخاذ القرار الاستراتيجي والتخطيط للاستثمار. وبالتالي، أصبح إنشاء منظمة مدفوعة بالتحليلات أيضًا المحرك الرئيسي للتعاون بين المدير المالي والمدير التنفيذي للمعلومات. وبالتالي، فإن الطلب على خدمات التحليلات المالية ينمو بشكل كبير، مما يدفع سوق الخزانة وإدارة المخاطر.
رؤى السوق القائمة على المكونات
بناءً على المكون، ينقسم سوق إدارة الخزانة والمخاطر إلى الحلول والخدمات. وقد تصدر قطاع الحلول السوق بحصة أكبر في عام 2020.
رؤى السوق القائمة على النشر
بناءً على النشر، ينقسم سوق إدارة الخزانة والمخاطر إلى سوق قائم على السحابة وسوق محلي. وقد قاد قطاع السحابة السوق بحصة أكبر في عام 2020.
رؤى السوق بناءً على حجم المؤسسة
بناءً على حجم المؤسسة، ينقسم سوق إدارة الخزانة والمخاطر إلى شركات صغيرة ومتوسطة الحجم وشركات كبيرة. وقد تصدرت شريحة الشركات الكبيرة السوق بحصة أكبر في عام 2020.
رؤى السوق القائمة على التطبيقات
بناءً على التطبيق، يتم تقسيم سوق إدارة الخزانة والمخاطر إلى إدارة الحسابات، وإدارة النقد والسيولة، والامتثال وإدارة المخاطر، وإدارة الموارد المالية. استحوذ قطاع إدارة النقد والسيولة على أكبر حصة سوقية في عام 2020.
رؤى السوق المستندة إلى المستخدم النهائي
بناءً على المستخدم النهائي، يتم تقسيم السوق إلى BFSI، وIT & telecom، و Retail & ecommerce، و Healthcare، و Manufacturing & cars، وغيرها. قاد قطاع BFSI سوق الخزانة وإدارة المخاطر بأكبر حصة في عام 2020.
يتبنى اللاعبون العاملون في سوق الخزانة وإدارة المخاطر استراتيجيات مثل عمليات الدمج والاستحواذ والمبادرات السوقية للحفاظ على مواقعهم في السوق. وفيما يلي قائمة ببعض التطورات التي قام بها اللاعبون الرئيسيون:
- في يوليو 2021، أطلقت FIS سلسلة جديدة من حلول إدارة المخاطر المدعومة بالذكاء الاصطناعي. أعلنت FIS عن مجموعة جديدة من المنتجات التي تم إنشاؤها بالتعاون مع C3 AI لمساعدة مؤسسات أسواق رأس المال في إدارة الامتثال التنظيمي والمخاطر بشكل أفضل باستخدام قوة بياناتها التنظيمية.
- في نوفمبر 2020، اختار بنك Lunar، وهو بنك منافس في دول الشمال الأوروبي، حل FIS القائم على السحابة في قطاع إدارة الخزانة والمخاطر بهدف الحصول على الدعم في تحسين السيولة وإدارة المخاطر والتوسع. اختار Lunar نظام Ambit Quantum السحابي الخاص من FIS لتبسيط المحاسبة التحوطية والامتثال التنظيمي. يستخدم Lunar مكتب خدمة SWIFT التابع لـ FIS لربط عمليات الخزانة والدفع الخاصة به بالشركاء المصرفيين من خلال SWIFT وغيرها من البورصات والشبكات الصناعية.
رؤى إقليمية حول سوق الخزانة وإدارة المخاطر
لقد قام المحللون في Insight Partners بشرح الاتجاهات والعوامل الإقليمية المؤثرة على سوق الخزانة وإدارة المخاطر طوال فترة التوقعات بشكل شامل. يناقش هذا القسم أيضًا قطاعات سوق الخزانة وإدارة المخاطر والجغرافيا في جميع أنحاء أمريكا الشمالية وأوروبا ومنطقة آسيا والمحيط الهادئ والشرق الأوسط وأفريقيا وأمريكا الجنوبية والوسطى.
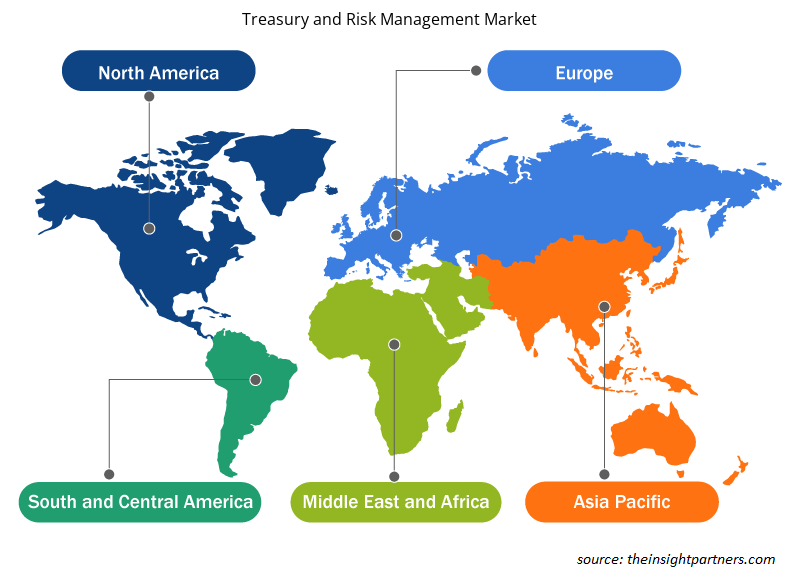
- احصل على البيانات الإقليمية المحددة لسوق الخزانة وإدارة المخاطر
نطاق تقرير سوق الخزانة وإدارة المخاطر
سمة التقرير | تفاصيل |
---|---|
حجم السوق في عام 2021 | 4.74 مليار دولار أمريكي |
حجم السوق بحلول عام 2028 | 7.16 مليار دولار أمريكي |
معدل النمو السنوي المركب العالمي (2021 - 2028) | 6.1% |
البيانات التاريخية | 2019-2020 |
فترة التنبؤ | 2022-2028 |
القطاعات المغطاة | حسب المكون
|
المناطق والدول المغطاة | أمريكا الشمالية
|
قادة السوق وملفات تعريف الشركات الرئيسية |
|
كثافة اللاعبين في السوق: فهم تأثيرها على ديناميكيات الأعمال
يشهد سوق إدارة الخزانة والمخاطر نموًا سريعًا، مدفوعًا بالطلب المتزايد من المستخدم النهائي بسبب عوامل مثل تفضيلات المستهلكين المتطورة والتقدم التكنولوجي والوعي المتزايد بفوائد المنتج. ومع ارتفاع الطلب، تعمل الشركات على توسيع عروضها والابتكار لتلبية احتياجات المستهلكين والاستفادة من الاتجاهات الناشئة، مما يؤدي إلى زيادة نمو السوق.
تشير كثافة اللاعبين في السوق إلى توزيع الشركات أو المؤسسات العاملة في سوق أو صناعة معينة. وهي تشير إلى عدد المنافسين (اللاعبين في السوق) الموجودين في مساحة سوق معينة نسبة إلى حجمها أو قيمتها السوقية الإجمالية.
الشركات الرئيسية العاملة في سوق الخزانة وإدارة المخاطر هي:
- شركة برودريدج للحلول المالية
- الاتحاد الدولي للتزلج على الجليد
- شركة أوراكل
- برايس ووتر هاوس كوبرز الدولية المحدودة (PWC)
- ساب اس اي
إخلاء المسؤولية : الشركات المذكورة أعلاه ليست مرتبة بأي ترتيب معين.
- احصل على نظرة عامة على أهم اللاعبين الرئيسيين في سوق الخزانة وإدارة المخاطر
نبذة عن الشركة
- شركة برودريدج للحلول المالية
- الاتحاد الدولي للتزلج على الجليد
- شركة أوراكل
- برايس ووتر هاوس كوبرز الدولية المحدودة (PWC)
- ساب اس اي
- شركة فيسيرف
- شركة كاليبسو للتكنولوجيا (أدينزا)
- شركة كيريبا
- مورس للبرمجيات
- وولترز كلوير
- Historical Analysis (2 Years), Base Year, Forecast (7 Years) with CAGR
- PEST and SWOT Analysis
- Market Size Value / Volume - Global, Regional, Country
- Industry and Competitive Landscape
- Excel Dataset
Report Coverage
Revenue forecast, Company Analysis, Industry landscape, Growth factors, and Trends
Segment Covered
This text is related
to segments covered.
Regional Scope
North America, Europe, Asia Pacific, Middle East & Africa, South & Central America
Country Scope
This text is related
to country scope.
Frequently Asked Questions
Financial analytics services offer financial data quality analysis, data layout, client analytics, predictive analytics, principal component analysis, and financial data collection. These analytics require detailed financial and other relevant data to identify patterns; based on these predictions, enterprises make predictions regarding their customers purchases and their employees' tenures period.
The US held the largest market share in the Treasury and Risk Management market. The treasury and risk management market are increasing in the US due to the rise in the technological sector. As per CompTIACyberstates report, 2022 of the economic impacts of the technology sector, the direct economic impact the dollar value of goods and services produced during a given year amounts to 10.5% of US economic value, which translates to over US$ 2.0 trillion.
Based on the component type, the market is segmented into solution and services. The solution segment led the treasury and risk management market in 2021. Treasury and risk management solutions integrate tools such as payments, cash management, and bank connectivity with an extensive library of financial instruments, advanced risk analytics, and hedge accounting to provide overall visibility across the enterprise. A comprehensive risk management solution offers a holistic approach to compliance, financial, and operational risk management. Such as, Fidelity National Information Services, Inc. (FIS) offers treasury management solutions that support a digital and modernized treasury function.
FIS (Fidelity National Information Services Inc); Oracle Corporation; PricewaterhouseCoopers International Limited (PwC); SAP SE; and Fiserv, Inc. are the five key players in the Treasury and Risk Management market. These companies have shown consistent growth in revenue and larger volumes of sales. Additionally, the well-established top five players are offering a comprehensive product portfolio and have a prominent presence in terms of share in the Treasury and Risk Management market.
Based on deployment type, the treasury and risk management market are bifurcated into cloud-based and on-premises. The cloud-based segment led the treasury and risk management market in 2021. The technology sector has been increasingly witnessing a significant rise in cloud-based platforms in recent times. The cloud-based platform simplifies the deployment time and significantly reduces the cost of deployment. A few benefits of a cloud-based treasury and risk management platform are the secure hosting of critical data, improved security and scalability, and quick recovery of files. The backups are stored on a private or shared cloud host platform. Therefore, organizations can quickly recover several critical data.
Global spending on the information and communications technology (ICT) sector continues to rise. The article published by Innovation, Science and Economic Development Canada stated that over ~40,000 businesses in the Canadian ICT sector fell within the software and computer services segment in 2020. With the growing spending on the ICT sector, especially on the software/platform segment, the development and adoption of advanced technologies by businesses globally will grow in the coming years. Thus, the rising spending on the ICT sector will lead to more advanced development in the treasury and risk management systems, which will boost the demand for treasury and risk management solutions.
Trends and growth analysis reports related to Technology, Media and Telecommunications : READ MORE..
The List of Companies - Treasury and Risk Management Market
- Broadridge Financial Solutions, Inc.
- FIS
- Oracle Corporation
- Pricewaterhousecoopers International Limited (PWC)
- SAP SE
- Fiserv, Inc.
- Calypso Technology, Inc (Adenza)
- Kyriba Corp
- Mors Software
- Wolters Kluwer
The Insight Partners performs research in 4 major stages: Data Collection & Secondary Research, Primary Research, Data Analysis and Data Triangulation & Final Review.
- Data Collection and Secondary Research:
As a market research and consulting firm operating from a decade, we have published and advised several client across the globe. First step for any study will start with an assessment of currently available data and insights from existing reports. Further, historical and current market information is collected from Investor Presentations, Annual Reports, SEC Filings, etc., and other information related to company’s performance and market positioning are gathered from Paid Databases (Factiva, Hoovers, and Reuters) and various other publications available in public domain.
Several associations trade associates, technical forums, institutes, societies and organization are accessed to gain technical as well as market related insights through their publications such as research papers, blogs and press releases related to the studies are referred to get cues about the market. Further, white papers, journals, magazines, and other news articles published in last 3 years are scrutinized and analyzed to understand the current market trends.
- Primary Research:
The primarily interview analysis comprise of data obtained from industry participants interview and answers to survey questions gathered by in-house primary team.
For primary research, interviews are conducted with industry experts/CEOs/Marketing Managers/VPs/Subject Matter Experts from both demand and supply side to get a 360-degree view of the market. The primary team conducts several interviews based on the complexity of the markets to understand the various market trends and dynamics which makes research more credible and precise.
A typical research interview fulfils the following functions:
- Provides first-hand information on the market size, market trends, growth trends, competitive landscape, and outlook
- Validates and strengthens in-house secondary research findings
- Develops the analysis team’s expertise and market understanding
Primary research involves email interactions and telephone interviews for each market, category, segment, and sub-segment across geographies. The participants who typically take part in such a process include, but are not limited to:
- Industry participants: VPs, business development managers, market intelligence managers and national sales managers
- Outside experts: Valuation experts, research analysts and key opinion leaders specializing in the electronics and semiconductor industry.
Below is the breakup of our primary respondents by company, designation, and region:
Once we receive the confirmation from primary research sources or primary respondents, we finalize the base year market estimation and forecast the data as per the macroeconomic and microeconomic factors assessed during data collection.
- Data Analysis:
Once data is validated through both secondary as well as primary respondents, we finalize the market estimations by hypothesis formulation and factor analysis at regional and country level.
- Macro-Economic Factor Analysis:
We analyse macroeconomic indicators such the gross domestic product (GDP), increase in the demand for goods and services across industries, technological advancement, regional economic growth, governmental policies, the influence of COVID-19, PEST analysis, and other aspects. This analysis aids in setting benchmarks for various nations/regions and approximating market splits. Additionally, the general trend of the aforementioned components aid in determining the market's development possibilities.
- Country Level Data:
Various factors that are especially aligned to the country are taken into account to determine the market size for a certain area and country, including the presence of vendors, such as headquarters and offices, the country's GDP, demand patterns, and industry growth. To comprehend the market dynamics for the nation, a number of growth variables, inhibitors, application areas, and current market trends are researched. The aforementioned elements aid in determining the country's overall market's growth potential.
- Company Profile:
The “Table of Contents” is formulated by listing and analyzing more than 25 - 30 companies operating in the market ecosystem across geographies. However, we profile only 10 companies as a standard practice in our syndicate reports. These 10 companies comprise leading, emerging, and regional players. Nonetheless, our analysis is not restricted to the 10 listed companies, we also analyze other companies present in the market to develop a holistic view and understand the prevailing trends. The “Company Profiles” section in the report covers key facts, business description, products & services, financial information, SWOT analysis, and key developments. The financial information presented is extracted from the annual reports and official documents of the publicly listed companies. Upon collecting the information for the sections of respective companies, we verify them via various primary sources and then compile the data in respective company profiles. The company level information helps us in deriving the base number as well as in forecasting the market size.
- Developing Base Number:
Aggregation of sales statistics (2020-2022) and macro-economic factor, and other secondary and primary research insights are utilized to arrive at base number and related market shares for 2022. The data gaps are identified in this step and relevant market data is analyzed, collected from paid primary interviews or databases. On finalizing the base year market size, forecasts are developed on the basis of macro-economic, industry and market growth factors and company level analysis.
- Data Triangulation and Final Review:
The market findings and base year market size calculations are validated from supply as well as demand side. Demand side validations are based on macro-economic factor analysis and benchmarks for respective regions and countries. In case of supply side validations, revenues of major companies are estimated (in case not available) based on industry benchmark, approximate number of employees, product portfolio, and primary interviews revenues are gathered. Further revenue from target product/service segment is assessed to avoid overshooting of market statistics. In case of heavy deviations between supply and demand side values, all thes steps are repeated to achieve synchronization.
We follow an iterative model, wherein we share our research findings with Subject Matter Experts (SME’s) and Key Opinion Leaders (KOLs) until consensus view of the market is not formulated – this model negates any drastic deviation in the opinions of experts. Only validated and universally acceptable research findings are quoted in our reports.
We have important check points that we use to validate our research findings – which we call – data triangulation, where we validate the information, we generate from secondary sources with primary interviews and then we re-validate with our internal data bases and Subject matter experts. This comprehensive model enables us to deliver high quality, reliable data in shortest possible time.