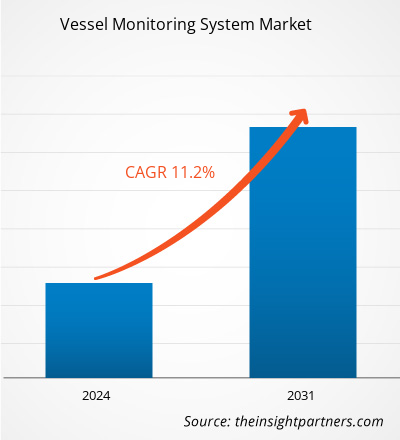
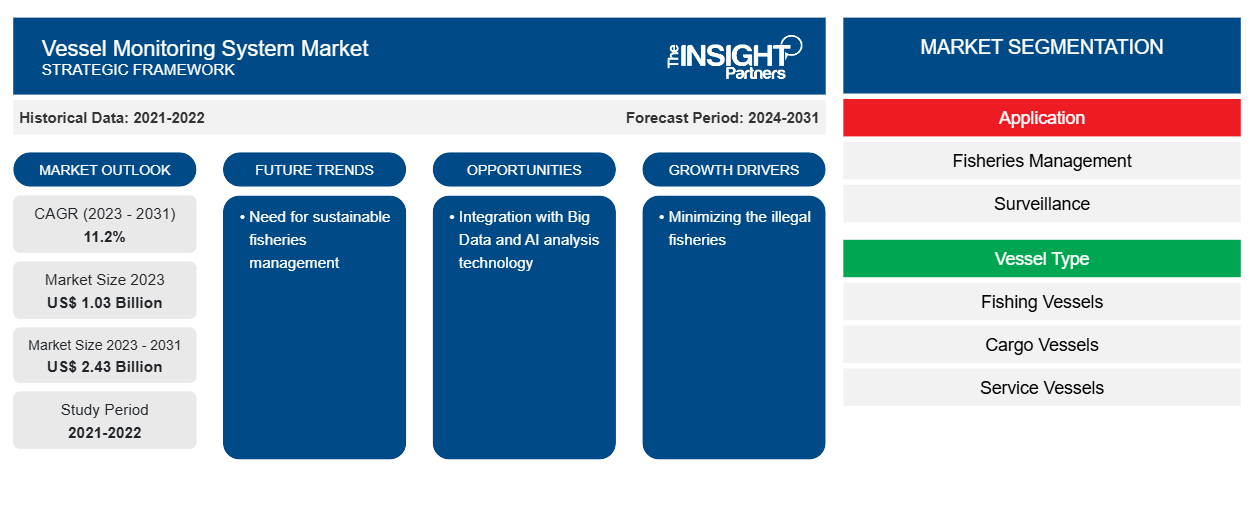
من المتوقع أن يصل حجم سوق أنظمة مراقبة السفن إلى 2.43 مليار دولار أمريكي بحلول عام 2031 من 1.03 مليار دولار أمريكي في عام 2023. ومن المتوقع أن يسجل السوق معدل نمو سنوي مركب بنسبة 11.2٪ في الفترة 2023-2031. ومن المرجح أن يظل النمو في تطبيقات الصيد والمتطلبات المتعلقة بمنع التعامل غير المصرح به من الاتجاهات الرئيسية لسوق أنظمة مراقبة السفن.
تحليل سوق أنظمة مراقبة السفن
من خلال ضمان أساليب الصيد المناسبة ومنع الصيد غير المشروع، تساعد أنظمة مراقبة السفن في تحسين إدارة البيئة البحرية واستدامتها، وبالتالي حماية وتحسين سبل عيش الصيادين. يستخدم نظام مراقبة السفن بشكل أساسي لإدارة مصائد الأسماك. والغرض من نظام مراقبة السفن هو مراقبة حركة السفن المجهزة بنظام مراقبة السفن فيما يتعلق بمناطق الصيد المحظورة. ويؤدي التحول نحو إدارة مصائد الأسماك المستدامة إلى توليد الطلب على أنظمة مراقبة السفن.
نظرة عامة على سوق أنظمة مراقبة السفن
أنظمة مراقبة السفن (VMS) هو مصطلح يستخدم عادة لوصف الأنظمة المستخدمة في الصيد التجاري للسماح للمنظمات التنظيمية البيئية والصيدية بمراقبة وتتبع أنشطة سفن الصيد. وهي جزء أساسي من برامج المراقبة والتحكم على المستويين الوطني والدولي. كما تستخدم أنظمة مراقبة السفن (VMS) لمراقبة وتتبع السفن في المياه الإقليمية لبلد أو قسم فرعي من بلد.
قم بتخصيص هذا التقرير ليناسب متطلباتك
ستحصل على تخصيص لأي تقرير - مجانًا - بما في ذلك أجزاء من هذا التقرير، أو تحليل على مستوى الدولة، وحزمة بيانات Excel، بالإضافة إلى الاستفادة من العروض والخصومات الرائعة للشركات الناشئة والجامعات
-
احصل على أهم اتجاهات السوق الرئيسية لهذا التقرير.ستتضمن هذه العينة المجانية تحليلاً للبيانات، بدءًا من اتجاهات السوق وحتى التقديرات والتوقعات.
محركات وفرص سوق أنظمة مراقبة السفن
الحد من الصيد غير المشروع من قبل اللاعبين في السوق لصالح السوق
توفر مصايد الأسماك مصدرًا أساسيًا للغذاء والترفيه والتوظيف والتجارة والرفاهة الاقتصادية للناس في جميع أنحاء العالم. ومع النمو السكاني واستمرار الجوع، برزت الأسماك كسلعة أساسية لتحقيق الأمن الغذائي. ومع ذلك، فإن أنشطة الصيد غير المشروعة وغير المبلغ عنها وغير المنظمة تعرض الجهود الدولية لضمان استدامة مصايد الأسماك للخطر بشكل خطير. في يونيو 2023، وفقًا لمنظمة الأغذية والزراعة التابعة للأمم المتحدة (الفاو)، فإن أنشطة الصيد غير المشروعة وغير المبلغ عنها وغير المنظمة مسؤولة عن فقدان 11-26 مليون طن من الأسماك كل عام، والتي تقدر قيمتها الاقتصادية بنحو 10-23 مليار دولار أمريكي. وبالتالي، لتقليل الصيد غير المشروع، يكتسب الطلب على أنظمة مراقبة السفن قوة. فهي تساعد في المراقبة الفعالة والموثوقة لسفن الصيد المرخصة وتكشف السفن غير القانونية أو غير المصرح بها.
الحاجة إلى إدارة مستدامة لمصائد الأسماك – فرصة في سوق أنظمة مراقبة السفن
تمتص المحيطات أكثر من 26% من انبعاثات ثاني أكسيد الكربون وأكثر من 93% من الحرارة على مستوى العالم. وقد أثر هذا على 500 مليون شخص تعتمد صحتهم ورفاهتهم وسبل عيشهم على الصيد من خلال تغيير النظم البيئية للمحيطات، والمساهمة في ارتفاع مستويات سطح البحر، وزيادة وتيرة تفشي الأمراض، وتحمض مياه البحر، وزيادة معدلات الوفيات وانخفاض إنتاجية الأنواع الرئيسية، وتغيير التوزيع الجغرافي للعديد من مخزونات الأسماك المهمة. بالإضافة إلى ذلك، يتسبب الصيد غير المستدام في انبعاثات من أساطيل الصيد ويضر بالنظم البيئية البحرية ، وكلاهما من العوامل المساهمة في تغير المناخ. لذلك، هناك حاجة إلى تنفيذ إدارة مصايد الأسماك المستدامة، والتي تولد الطلب على أنظمة مراقبة السفن لأنها تساعد في توفير رؤى قوية في الوقت الفعلي تقريبًا للسلطات / المنظمات لإدارة ومراقبة أنشطة مصايد الأسماك بشكل مستدام.
تقرير تحليل تجزئة سوق نظام مراقبة السفن
إن القطاعات الرئيسية التي ساهمت في اشتقاق تحليل سوق نظام مراقبة السفن هي التطبيق ونوع السفينة.
- بناءً على التطبيق، يتم تقسيم السوق إلى إدارة مصائد الأسماك والمراقبة وغيرها. احتل قطاع المراقبة حصة سوقية أكبر في عام 2023.
- بحسب نوع السفينة، يتم تقسيم السوق إلى سفن الصيد وسفن الشحن وسفن الخدمة وسفن الركاب والعبارات وغيرها. احتل قطاع سفن الصيد الحصة الأكبر من السوق في عام 2023.
تحليل حصة سوق أنظمة مراقبة السفن حسب المنطقة الجغرافية
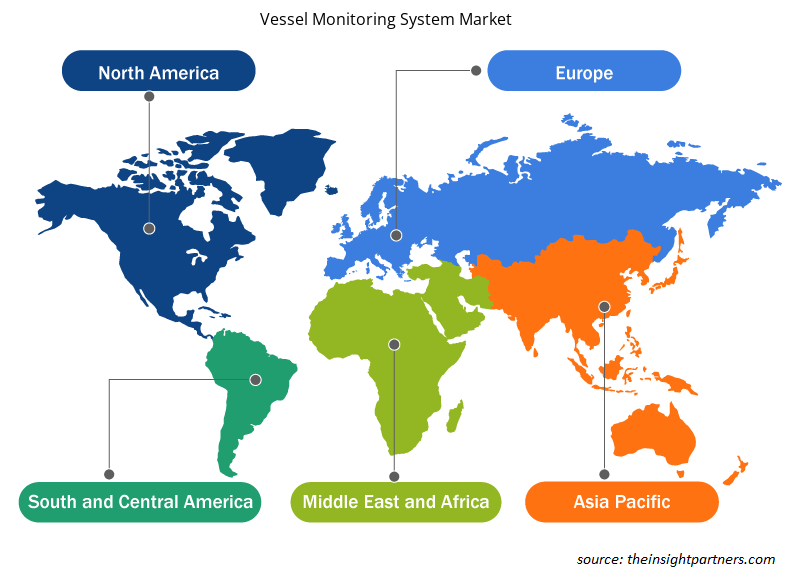
ينقسم النطاق الجغرافي لتقرير سوق نظام مراقبة السفن بشكل أساسي إلى خمس مناطق: أمريكا الشمالية، ومنطقة آسيا والمحيط الهادئ، وأوروبا، والشرق الأوسط وأفريقيا، وأمريكا الجنوبية/أمريكا الجنوبية والوسطى.
من حيث الإيرادات، استحوذت منطقة آسيا والمحيط الهادئ على أكبر حصة في سوق أنظمة مراقبة السفن في عام 2023. وتعد دول مثل اليابان والهند والصين وسريلانكا وغيرها من الدول الرئيسية في سوق أنظمة مراقبة السفن في منطقة آسيا والمحيط الهادئ. تشارك المنطقة في العديد من المشاريع البحرية التي تتطلب مراقبة السفن التي تحدد مواقع السفن وحركة المرور الأخرى والمخاطر المتعلقة بالطقس. كما تشرف على إدارة حركة المرور الشاملة للميناء أو الممر المائي. على سبيل المثال، في مايو 2023، أصدر المعهد الوطني للبحوث البحرية في اليابان نتائج مشروع جديد لتحليل بيانات السفن، يجمع بين بيانات المراقبة على متن السفن المخزنة بواسطة مركز بيانات السفن (ShipDC) مع المعلومات من خدمة بيانات المحيط POLARIS التي تقدمها جمعية الطقس اليابانية (JWA).
رؤى إقليمية حول سوق أنظمة مراقبة السفن
لقد قام المحللون في Insight Partners بشرح الاتجاهات والعوامل الإقليمية المؤثرة على سوق نظام مراقبة السفن طوال فترة التوقعات بشكل شامل. يناقش هذا القسم أيضًا قطاعات سوق نظام مراقبة السفن والجغرافيا في جميع أنحاء أمريكا الشمالية وأوروبا ومنطقة آسيا والمحيط الهادئ والشرق الأوسط وأفريقيا وأمريكا الجنوبية والوسطى.

- احصل على البيانات الإقليمية المحددة لسوق نظام مراقبة السفن
نطاق تقرير سوق نظام مراقبة السفن
| سمة التقرير | تفاصيل |
|---|---|
| حجم السوق في عام 2023 | 1.03 مليار دولار أمريكي |
| حجم السوق بحلول عام 2031 | 2.43 مليار دولار أمريكي |
| معدل النمو السنوي المركب العالمي (2023 - 2031) | 11.2% |
| البيانات التاريخية | 2021-2022 |
| فترة التنبؤ | 2024-2031 |
| القطاعات المغطاة |
حسب الطلب
|
| المناطق والدول المغطاة |
أمريكا الشمالية
|
| قادة السوق وملفات تعريف الشركات الرئيسية |
|
كثافة اللاعبين في سوق أنظمة مراقبة السفن: فهم تأثيرها على ديناميكيات الأعمال
يشهد سوق أنظمة مراقبة السفن نموًا سريعًا، مدفوعًا بالطلب المتزايد من المستخدم النهائي بسبب عوامل مثل تفضيلات المستهلكين المتطورة والتقدم التكنولوجي والوعي المتزايد بفوائد المنتج. ومع ارتفاع الطلب، تعمل الشركات على توسيع عروضها والابتكار لتلبية احتياجات المستهلكين والاستفادة من الاتجاهات الناشئة، مما يؤدي إلى زيادة نمو السوق.
تشير كثافة اللاعبين في السوق إلى توزيع الشركات أو المؤسسات العاملة في سوق أو صناعة معينة. وهي تشير إلى عدد المنافسين (اللاعبين في السوق) الموجودين في مساحة سوق معينة نسبة إلى حجمها أو قيمتها السوقية الإجمالية.
الشركات الرئيسية العاملة في سوق نظام مراقبة السفن هي:
- شركة تكنولوجيا الأقمار الصناعية التطبيقية المحدودة
- تقنيات آدفاليو
- شركة بكين هايلاندر للتكنولوجيا الرقمية المحدودة
- بلوتراكر
- سي ال اس
- أوربكوم
إخلاء المسؤولية : الشركات المذكورة أعلاه ليست مرتبة بأي ترتيب معين.

- احصل على نظرة عامة على أهم اللاعبين الرئيسيين في سوق نظام مراقبة السفن
أخبار سوق أنظمة مراقبة السفن والتطورات الأخيرة
يتم تقييم سوق نظام مراقبة السفن من خلال جمع البيانات النوعية والكمية بعد البحث الأولي والثانوي، والتي تتضمن منشورات الشركات المهمة وبيانات الجمعيات وقواعد البيانات. فيما يلي قائمة بالتطورات في السوق:
- في مارس 2021، افتتح رئيس الوزراء مودي "قمة الهند البحرية 2021" وأطلق كتابًا إلكترونيًا عن الرؤية البحرية 2030 يهدف إلى جعل الصناعة على قدم المساواة مع أفضل المعايير العالمية. أطلقت الهند نظامًا لتتبع السفن في الوقت الفعلي يمكنه مساعدة البحارة والصيادين في أوقات الحاجة. وبصرف النظر عن تتبع السفن الهندية عالميًا، يمكنه أيضًا تتبع السفن الأجنبية في نطاق 1000 كيلومتر من ساحل الهند. (المصدر: الأخبار، بيان صحفي، 2021)
- في يونيو 2022، تم افتتاح مركز مراقبة مصايد الأسماك على مدار الساعة طوال أيام الأسبوع رسميًا في 21 يونيو 2022 كجزء من مشروع نظام مراقبة السفن في سريلانكا الذي تنفذه المنظمة الدولية للهجرة. بموجب مشروع نظام مراقبة السفن في سريلانكا، يتم تجهيز 4200 سفينة صيد متعددة الأيام بأجهزة إرسال واستقبال نظام مراقبة السفن، مما سيمكن وزارة مصايد الأسماك والموارد البحرية من مراقبة تحركات السفن بشكل فعال، وضمان الامتثال للوائح لجنة التونة في المحيط الهندي بشأن مصائد الأسماك غير القانونية وغير المبلغ عنها وغير المنظمة. (المصدر: المنظمة الدولية للهجرة، بيان صحفي، 2022)
تقرير سوق أنظمة مراقبة السفن - التغطية والنتائج المتوقعة
يوفر تقرير "حجم سوق نظام مراقبة السفن والتوقعات (2021-2031)" تحليلاً مفصلاً للسوق يغطي المجالات التالية:
- حجم السوق والتوقعات على المستويات العالمية والإقليمية والوطنية لجميع قطاعات السوق الرئيسية التي يغطيها النطاق
- ديناميكيات السوق مثل المحركات والقيود والفرص الرئيسية
- الاتجاهات المستقبلية الرئيسية
- تحليل مفصل لقوى PEST/Porter الخمس وSWOT
- تحليل السوق العالمي والإقليمي الذي يغطي اتجاهات السوق الرئيسية واللاعبين الرئيسيين واللوائح والتطورات الأخيرة في السوق
- تحليل المشهد الصناعي والمنافسة الذي يغطي تركيز السوق، وتحليل خريطة الحرارة، واللاعبين البارزين، والتطورات الأخيرة
- ملفات تعريف الشركة التفصيلية
- التحليل التاريخي (سنتان)، سنة الأساس، التوقعات (7 سنوات) مع معدل النمو السنوي المركب
- تحليل PEST و SWOT
- حجم السوق والقيمة / الحجم - عالمي، إقليمي، بلد
- الصناعة والمنافسة
- مجموعة بيانات إكسل
التقارير الحديثة
شهادات العملاء
سبب الشراء
- اتخاذ قرارات مدروسة
- فهم ديناميكيات السوق
- تحليل المنافسة
- رؤى العملاء
- توقعات السوق
- تخفيف المخاطر
- التخطيط الاستراتيجي
- مبررات الاستثمار
- تحديد الأسواق الناشئة
- تحسين استراتيجيات التسويق
- تعزيز الكفاءة التشغيلية
- مواكبة التوجهات التنظيمية


 احصل على عينة مجانية ل - سوق أنظمة مراقبة السفن