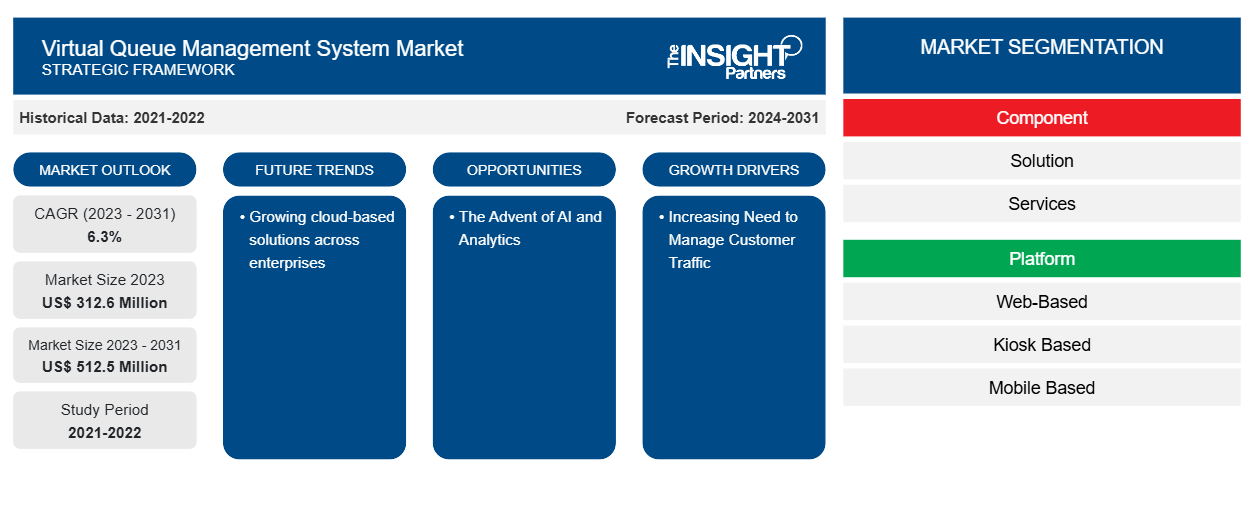
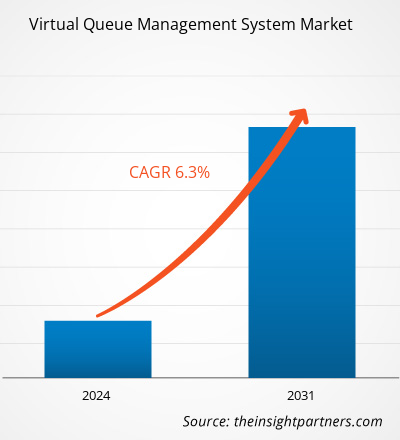
من المتوقع أن يصل حجم سوق نظام إدارة الطوابير الافتراضية إلى 512.5 مليون دولار أمريكي بحلول عام 2031 من 312.6 مليون دولار أمريكي في عام 2023. ومن المتوقع أن يسجل السوق معدل نمو سنوي مركب بنسبة 6.3٪ خلال الفترة 2023-2031. ومن المرجح أن يظل نمو الحلول المستندة إلى السحابة عبر المؤسسات اتجاهًا رئيسيًا في السوق.
تحليل سوق نظام إدارة الطوابير الافتراضية
يمكن أن تؤدي إدارة الطوابير الافتراضية إلى زيادة رضا العملاء، وتبسيط الاتصالات، وتحسين تدفق العملاء، وتقصير أوقات الانتظار. كما يمكن للشركات التي تستخدم نظام الطوابير الافتراضية استيعاب المزيد من العملاء. توفر أنظمة الطوابير الافتراضية إدارة محسنة لحركة الركاب في المطار. يساعد هذا في تجنب الازدحام ويضمن انتقالات أفضل بين الأنشطة مثل تسجيل الوصول، والفحوص الأمنية، والصعود إلى الطائرة.
نظرة عامة على سوق نظام إدارة طوابير الانتظار الافتراضية
تعمل حلول الطوابير الافتراضية على تقليل أو القضاء على الطوابير المادية، مما يضمن للعملاء قضاء وقت أقل في الانتظار في الطوابير. توفر الطوابير الافتراضية تحديثات في الوقت الفعلي، مما يبقي العملاء على اطلاع بموقفهم ويعزز تجربتهم الإجمالية. يقلل حل إدارة الطوابير الافتراضية من تكاليف العمالة الإضافية ويضمن نشر الموارد بشكل فعال. كما تفيدك أنظمة إدارة الطوابير الافتراضية من خلال السماح لك بتوجيه العميل بذكاء إلى الطابور الصحيح بناءً على احتياجاته من الخدمة. إذا اختار العميل الطابور الخطأ عن طريق الخطأ، فيمكنك تغييره بسرعة لهم.
قم بتخصيص هذا التقرير ليناسب متطلباتك
ستحصل على تخصيص لأي تقرير - مجانًا - بما في ذلك أجزاء من هذا التقرير، أو تحليل على مستوى الدولة، وحزمة بيانات Excel، بالإضافة إلى الاستفادة من العروض والخصومات الرائعة للشركات الناشئة والجامعات
- احصل على أهم اتجاهات السوق الرئيسية لهذا التقرير.ستتضمن هذه العينة المجانية تحليلاً للبيانات، بدءًا من اتجاهات السوق وحتى التقديرات والتوقعات.
محركات وفرص سوق نظام إدارة الطوابير الافتراضية
تزايد الحاجة إلى إدارة حركة العملاء لصالح السوق
إن مراقبة حركة المستهلكين أمر بالغ الأهمية لأداء أي عمل تجاري. يتتبع تحليل حركة المرور تصرفات وعادات العملاء مع تفسير معناها أيضًا. إن مراقبة حركة المستهلكين لها العديد من المزايا. من حيث الأمان، يمكن أن يساعد تتبع نشاط العملاء وتحديد الأقسام الأكثر زيارة في الموقع في منع تجاوز مناطق معينة. علاوة على ذلك، يمكن لمراقبة حركة المرور ضمان تأمين هذه المواقع وعدم وصول الأشخاص غير المناسبين إليها. يمكن استخدام مراقبة حركة المرور في مجموعة متنوعة من الشركات، بما في ذلك المؤسسات المالية ومتاجر البيع بالتجزئة والمستشفيات والمباني الحكومية والمباني المكتبية والحرم الجامعي والمستودعات وغير ذلك الكثير. تساعد مراقبة حركة المستهلكين أيضًا في ضمان عدم تأخير تجربة التسوق أو الدخول إلى منشأة آمنة بشكل غير ملائم بسبب الطوابير المفرطة. تمكن البيانات الناتجة عن أنشطة المراقبة أصحاب الأعمال من اكتساب فهم قوي للمناطق الأكثر شعبية، والتي يمكنهم استخدامها لصالحهم والتحضير بشكل مناسب. وبالتالي، فإن الحاجة المتزايدة لإدارة حركة العملاء، تدفع نمو السوق.
ظهور الذكاء الاصطناعي والتحليلات.
مع اعتماد تجار التجزئة بشكل متزايد لاستراتيجيات متعددة القنوات ، تلعب تقنيات إدارة طوابير الانتظار بالذكاء الاصطناعي دورًا مهمًا في ربط التفاعلات عبر الإنترنت والتفاعلات المادية. يمكن للعملاء استخدام تطبيق المتجر لمعرفة أطوال طوابير الانتظار في الوقت الفعلي، مما يسمح لهم بتحديد ما إذا كانوا سيحضرون أو يحجزون موعدًا لتجنب الانتظار. يزيد هذا التكامل السلس من سعادة المستهلك وولائه. علاوة على ذلك، يمكن استخدام الذكاء الاصطناعي لتقدير أوقات انتظار المستهلك في الطابور. قد يرى العملاء المدة التي سيضطرون إلى انتظارها للحصول على الخدمة في الوقت الفعلي. يتيح هذا للعملاء التخطيط لرحلاتهم وتجنب الطوابير المفرطة، وربما يقررون العودة لاحقًا عندما يكون المكان أقل ازدحامًا. إذا تم توفير هذه المعلومات عبر الإنترنت، فيمكنهم اختيار الوصول عندما يكون الانتظار في أقصر وقت. سيفيد هذا أيضًا العمل من خلال تسهيل الطلب والاستفادة بشكل أفضل من الموارد. يمكن للذكاء الاصطناعي المساعدة في تحديد أولويات العملاء في الانتظار. وهذا يعني أن العملاء الذين لديهم مطالب عاجلة، مثل أولئك الذين يحتاجون إلى إيداع بنكي في وقت محدد أو الذين يتأخرون عن رحلتهم، قد يتم تقديم الخدمة لهم قبل أولئك الذين لديهم احتياجات أقل إلحاحًا. يمكن أن يساعد هذا في ضمان عدم تعرض أي شخص لنتيجة سيئة وعدم إمكانية تقديم المساعدة له.
تقرير تحليلي لتجزئة سوق نظام إدارة طوابير الانتظار الافتراضية
إن القطاعات الرئيسية التي ساهمت في اشتقاق تحليل سوق نظام إدارة طوابير الانتظار الافتراضية هي المكون والمنصة والمستخدم النهائي.
- استنادًا إلى المكونات، يتم تقسيم سوق نظام إدارة قائمة الانتظار الافتراضية إلى حلول وخدمات.
- بحسب المنصة، يتم تقسيم السوق إلى منصة تعتمد على الويب، ومنصة تعتمد على الأكشاك، ومنصة تعتمد على الهاتف المحمول.
- بحسب حجم المنظمة، يتم تقسيم السوق إلى مؤسسات صغيرة ومتوسطة ومؤسسات كبيرة.
- من حيث المستخدمين النهائيين، يتم تقسيم السوق إلى تجارة التجزئة والمستشفيات والعيادات والمطارات والمتاحف والمكتبات وغيرها.
تحليل حصة سوق نظام إدارة طوابير الانتظار الافتراضية حسب المنطقة الجغرافية
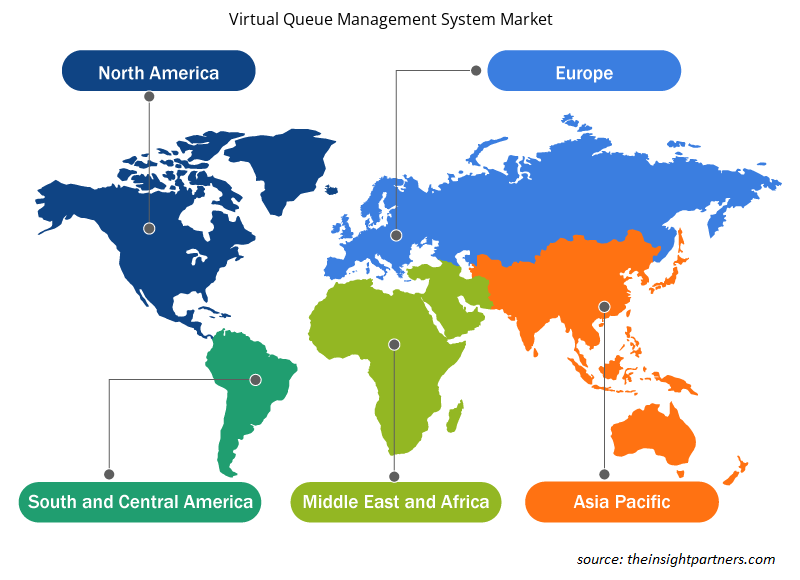
ينقسم النطاق الجغرافي لتقرير سوق نظام إدارة الطابور الافتراضي بشكل أساسي إلى خمس مناطق: أمريكا الشمالية، ومنطقة آسيا والمحيط الهادئ، وأوروبا، والشرق الأوسط وأفريقيا، وأمريكا الجنوبية والوسطى. أمريكا الشمالية هي منطقة متقدمة من الناحية التكنولوجية. تعتمد المنطقة بشكل متزايد على حلول رقمية مختلفة. علاوة على ذلك، فإن وجود شركات تكنولوجيا المعلومات العملاقة يدفع نمو السوق. يغير إجراء الطابور الافتراضي بشكل أساسي كيفية انتظار الأفراد في الطابور، مما يزيد بشكل كبير من تجربة المستهلك. يمكن للعملاء تسجيل الوصول من أي مكان على هواتفهم، وعرض أوقات الانتظار، والاتصال بأعضاء الخدمة دون الحاجة إلى المشاركة شخصيًا، مما أدى إلى نمو اعتماد إدارة الطابور الافتراضية.
رؤى إقليمية حول سوق نظام إدارة طوابير الانتظار الافتراضية
لقد قام المحللون في Insight Partners بشرح الاتجاهات والعوامل الإقليمية المؤثرة على سوق نظام إدارة الطوابير الافتراضية طوال فترة التوقعات بشكل شامل. يناقش هذا القسم أيضًا قطاعات سوق نظام إدارة الطوابير الافتراضية والجغرافيا في جميع أنحاء أمريكا الشمالية وأوروبا ومنطقة آسيا والمحيط الهادئ والشرق الأوسط وأفريقيا وأمريكا الجنوبية والوسطى.

- احصل على البيانات الإقليمية المحددة لسوق نظام إدارة قائمة الانتظار الافتراضية
نطاق تقرير سوق نظام إدارة الطوابير الافتراضية
| سمة التقرير | تفاصيل |
|---|---|
| حجم السوق في عام 2023 | 312.6 مليون دولار أمريكي |
| حجم السوق بحلول عام 2031 | 512.5 مليون دولار أمريكي |
| معدل النمو السنوي المركب العالمي (2023 - 2031) | 6.3% |
| البيانات التاريخية | 2021-2022 |
| فترة التنبؤ | 2024-2031 |
| القطاعات المغطاة | حسب المكون
|
| المناطق والدول المغطاة | أمريكا الشمالية
|
| قادة السوق وملفات تعريف الشركات الرئيسية |
|
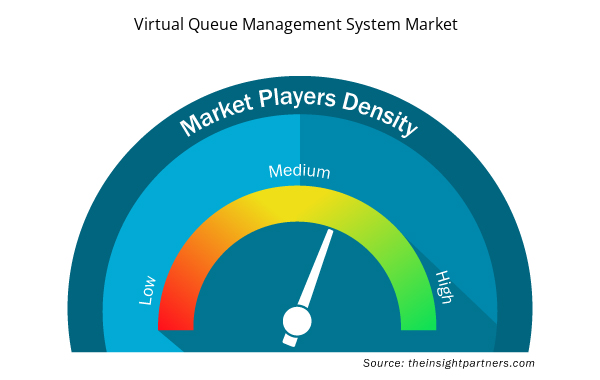
كثافة اللاعبين في سوق نظام إدارة الطوابير الافتراضية: فهم تأثيرها على ديناميكيات الأعمال
يشهد سوق أنظمة إدارة الطوابير الافتراضية نموًا سريعًا، مدفوعًا بالطلب المتزايد من المستخدم النهائي بسبب عوامل مثل تفضيلات المستهلكين المتطورة والتقدم التكنولوجي والوعي المتزايد بفوائد المنتج. ومع ارتفاع الطلب، تعمل الشركات على توسيع عروضها والابتكار لتلبية احتياجات المستهلكين والاستفادة من الاتجاهات الناشئة، مما يؤدي إلى زيادة نمو السوق.
تشير كثافة اللاعبين في السوق إلى توزيع الشركات أو المؤسسات العاملة في سوق أو صناعة معينة. وهي تشير إلى عدد المنافسين (اللاعبين في السوق) الموجودين في مساحة سوق معينة نسبة إلى حجمها أو قيمتها السوقية الإجمالية.
الشركات الرئيسية العاملة في سوق نظام إدارة قائمة الانتظار الافتراضية هي:
- مجموعة أكسيس للتكنولوجيا، شركة عامة محدودة
- شركة ادفانتيش المحدودة
- تقنيات أكيس
- حلول تقنية المعلومات إيجلوب
- صناعات لافي
- أومبوري
إخلاء المسؤولية : الشركات المذكورة أعلاه ليست مرتبة بأي ترتيب معين.

- احصل على نظرة عامة على أهم اللاعبين الرئيسيين في سوق نظام إدارة قائمة الانتظار الافتراضية
أخبار السوق والتطورات الأخيرة لنظام إدارة الطوابير الافتراضية
يتم تقييم سوق نظام إدارة الطوابير الافتراضية من خلال جمع البيانات النوعية والكمية بعد البحث الأولي والثانوي، والتي تتضمن منشورات الشركات المهمة وبيانات الجمعيات وقواعد البيانات. فيما يلي بعض التطورات في سوق نظام إدارة الطوابير الافتراضية:
- أعلنت شركة Qtrac by Lavi Industries، المزود لأنظمة إدارة طوابير الانتظار وجدولة المواعيد الافتراضية، اليوم عن توفر منصة Qtrac NextGen. توفر أحدث نسخة من نظام إدارة طوابير الانتظار من Qtrac للمؤسسات منصة مؤسسية محسنة قابلة للتطوير وآمنة وشاملة. إنها تولد مصادر دخل جديدة من خلال الجمع بين معلومات الأعمال القوية ومهارات التسويق الرقمي، مما يسمح للشركات بتحسين تجربة العملاء مع زيادة مشاركة الموظفين وإنتاجيتهم. (المصدر: Qtrac، نوفمبر 2021)
- أطلقت شركة مونتا نظامًا للصفوف الافتراضية لشحن المركبات الكهربائية. تتيح وظيفة "الصفوف الذكية" الجديدة للسائقين الانضمام إلى صفوف افتراضية في محطة شحن واحدة أو أكثر وتلقي إشعارات سريعة عند توفر نقطة شحن، لتقليل احتمالية نفاد طاقة المركبات عند السفر لمسافات طويلة. (المصدر: مونتا، أكتوبر 2021)
تقرير سوق نظام إدارة الطوابير الافتراضية: التغطية والنتائج المتوقعة
يوفر تقرير "حجم سوق نظام إدارة طوابير الانتظار الافتراضية والتوقعات (2021-2031)" تحليلاً مفصلاً للسوق يغطي المجالات التالية:
- حجم سوق نظام إدارة الطوابير الافتراضية وتوقعاته على المستويات العالمية والإقليمية والوطنية لجميع قطاعات السوق الرئيسية التي يغطيها النطاق
- اتجاهات سوق نظام إدارة الطوابير الافتراضية بالإضافة إلى ديناميكيات السوق مثل المحركات والقيود والفرص الرئيسية
- تحليل مفصل لقوى PEST/Porter الخمس وSWOT
- تحليل سوق نظام إدارة الطوابير الافتراضية الذي يغطي اتجاهات السوق الرئيسية والإطار العالمي والإقليمي واللاعبين الرئيسيين واللوائح والتطورات الأخيرة في السوق
- تحليل المشهد الصناعي والمنافسة الذي يغطي تركيز السوق، وتحليل خريطة الحرارة، واللاعبين البارزين، والتطورات الأخيرة لسوق نظام إدارة قائمة الانتظار الافتراضية
- ملفات تعريف الشركة التفصيلية
- التحليل التاريخي (سنتان)، السنة الأساسية، التوقعات (7 سنوات) مع معدل النمو السنوي المركب
- تحليل PEST و SWOT
- حجم السوق والقيمة / الحجم - عالميًا وإقليميًا وقطريًا
- الصناعة والمنافسة
- مجموعة بيانات Excel


Report Coverage
Revenue forecast, Company Analysis, Industry landscape, Growth factors, and Trends

Segment Covered
This text is related
to segments covered.

Regional Scope
North America, Europe, Asia Pacific, Middle East & Africa, South & Central America

Country Scope
This text is related
to country scope.
الأسئلة الشائعة
North America region dominated the virtual queue management system market in 2023.
The increasing need to manage customer traffic is the major factors that propel the global virtual queue management system market.
Growing cloud-based solutions across enterprises to play a significant role in the global virtual queue management system market in the coming years.
The leading players operating in the global virtual queue management system market are Accesso Technology Group, plc, Advantech Co. Ltd., AKIS Technologies, eGlobe IT Solutions, Lavi Industries, Ombori, Queue-it, Qmatic, SEDCO, and Hague Australia.
The global virtual queue management system market is expected to reach US$ 512.5 million by 2031.
The market is expected to register a CAGR of 6.3% during 2023–2031.
Trends and growth analysis reports related to Technology, Media and Telecommunications : READ MORE..
The Insight Partners performs research in 4 major stages: Data Collection & Secondary Research, Primary Research, Data Analysis and Data Triangulation & Final Review.
- Data Collection and Secondary Research:
As a market research and consulting firm operating from a decade, we have published and advised several client across the globe. First step for any study will start with an assessment of currently available data and insights from existing reports. Further, historical and current market information is collected from Investor Presentations, Annual Reports, SEC Filings, etc., and other information related to company’s performance and market positioning are gathered from Paid Databases (Factiva, Hoovers, and Reuters) and various other publications available in public domain.
Several associations trade associates, technical forums, institutes, societies and organization are accessed to gain technical as well as market related insights through their publications such as research papers, blogs and press releases related to the studies are referred to get cues about the market. Further, white papers, journals, magazines, and other news articles published in last 3 years are scrutinized and analyzed to understand the current market trends.
- Primary Research:
The primarily interview analysis comprise of data obtained from industry participants interview and answers to survey questions gathered by in-house primary team.
For primary research, interviews are conducted with industry experts/CEOs/Marketing Managers/VPs/Subject Matter Experts from both demand and supply side to get a 360-degree view of the market. The primary team conducts several interviews based on the complexity of the markets to understand the various market trends and dynamics which makes research more credible and precise.
A typical research interview fulfils the following functions:
- Provides first-hand information on the market size, market trends, growth trends, competitive landscape, and outlook
- Validates and strengthens in-house secondary research findings
- Develops the analysis team’s expertise and market understanding
Primary research involves email interactions and telephone interviews for each market, category, segment, and sub-segment across geographies. The participants who typically take part in such a process include, but are not limited to:
- Industry participants: VPs, business development managers, market intelligence managers and national sales managers
- Outside experts: Valuation experts, research analysts and key opinion leaders specializing in the electronics and semiconductor industry.
Below is the breakup of our primary respondents by company, designation, and region:

Once we receive the confirmation from primary research sources or primary respondents, we finalize the base year market estimation and forecast the data as per the macroeconomic and microeconomic factors assessed during data collection.
- Data Analysis:
Once data is validated through both secondary as well as primary respondents, we finalize the market estimations by hypothesis formulation and factor analysis at regional and country level.
- Macro-Economic Factor Analysis:
We analyse macroeconomic indicators such the gross domestic product (GDP), increase in the demand for goods and services across industries, technological advancement, regional economic growth, governmental policies, the influence of COVID-19, PEST analysis, and other aspects. This analysis aids in setting benchmarks for various nations/regions and approximating market splits. Additionally, the general trend of the aforementioned components aid in determining the market's development possibilities.
- Country Level Data:
Various factors that are especially aligned to the country are taken into account to determine the market size for a certain area and country, including the presence of vendors, such as headquarters and offices, the country's GDP, demand patterns, and industry growth. To comprehend the market dynamics for the nation, a number of growth variables, inhibitors, application areas, and current market trends are researched. The aforementioned elements aid in determining the country's overall market's growth potential.
- Company Profile:
The “Table of Contents” is formulated by listing and analyzing more than 25 - 30 companies operating in the market ecosystem across geographies. However, we profile only 10 companies as a standard practice in our syndicate reports. These 10 companies comprise leading, emerging, and regional players. Nonetheless, our analysis is not restricted to the 10 listed companies, we also analyze other companies present in the market to develop a holistic view and understand the prevailing trends. The “Company Profiles” section in the report covers key facts, business description, products & services, financial information, SWOT analysis, and key developments. The financial information presented is extracted from the annual reports and official documents of the publicly listed companies. Upon collecting the information for the sections of respective companies, we verify them via various primary sources and then compile the data in respective company profiles. The company level information helps us in deriving the base number as well as in forecasting the market size.
- Developing Base Number:
Aggregation of sales statistics (2020-2022) and macro-economic factor, and other secondary and primary research insights are utilized to arrive at base number and related market shares for 2022. The data gaps are identified in this step and relevant market data is analyzed, collected from paid primary interviews or databases. On finalizing the base year market size, forecasts are developed on the basis of macro-economic, industry and market growth factors and company level analysis.
- Data Triangulation and Final Review:
The market findings and base year market size calculations are validated from supply as well as demand side. Demand side validations are based on macro-economic factor analysis and benchmarks for respective regions and countries. In case of supply side validations, revenues of major companies are estimated (in case not available) based on industry benchmark, approximate number of employees, product portfolio, and primary interviews revenues are gathered. Further revenue from target product/service segment is assessed to avoid overshooting of market statistics. In case of heavy deviations between supply and demand side values, all thes steps are repeated to achieve synchronization.
We follow an iterative model, wherein we share our research findings with Subject Matter Experts (SME’s) and Key Opinion Leaders (KOLs) until consensus view of the market is not formulated – this model negates any drastic deviation in the opinions of experts. Only validated and universally acceptable research findings are quoted in our reports.
We have important check points that we use to validate our research findings – which we call – data triangulation, where we validate the information, we generate from secondary sources with primary interviews and then we re-validate with our internal data bases and Subject matter experts. This comprehensive model enables us to deliver high quality, reliable data in shortest possible time.


 احصل على عينة مجانية لهذا التقرير