سوق مقياس اللزوجة – المحركات والاتجاهات والفرص وإحصاءات النمو | 2031
البيانات التاريخية : 2021-2023 | سنة الأساس : 2024 | فترة التنبؤ : 2025-2031حجم سوق أجهزة قياس اللزوجة وتوقعاتها (2021-2031)، والحصة العالمية والإقليمية، والاتجاهات، وفرص النمو. يغطي التقرير تحليلات حسب نوع المستشعر (دوراني، تذبذب التوائي، اهتزازي، مكبس ساقط، كرة ساقطة، فتحة، شعري، مقياس الروماتزم، وغيرها)؛ والمستخدم النهائي (البترول (النفط والغاز)، والكيميائيات، والأدوية، والأغذية والمشروبات، وغيرها)، والموقع الجغرافي (أمريكا الشمالية، وأوروبا، وآسيا والمحيط الهادئ، وأمريكا الجنوبية والوسطى).
- تاريخ التقرير : Mar 2026
- رمز التقرير : TIPRE00021195
- الفئة : علوم الحياة
- الحالة : قادم
- تنسيقات التقارير المتاحة :


- عدد الصفحات : 150
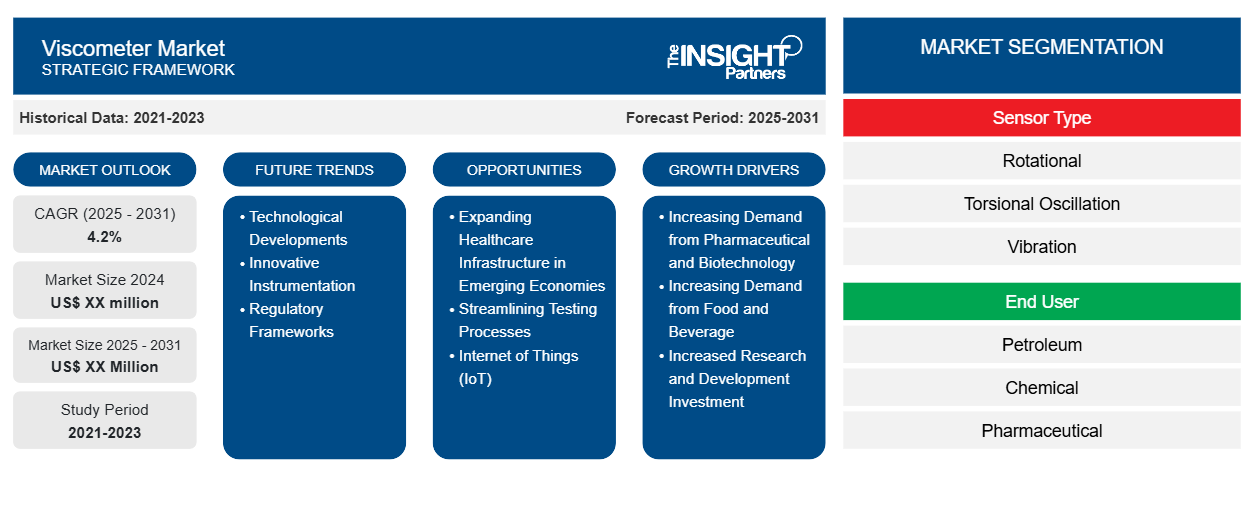
من المتوقع أن يسجل سوق مقياس اللزوجة معدل نمو سنوي مركب بنسبة 4.2٪ من عام 2023 إلى عام 2031، مع توسع حجم السوق من XX مليون دولار أمريكي في عام 2023 إلى XX مليون دولار أمريكي بحلول عام 2031.
تم تقسيم التقرير حسب سوق مقياس اللزوجة حسب نوع المستشعر (الدوران، التذبذب الالتوائي، الاهتزاز، المكبس الساقط، الكرة الساقطة، الفتحة، الشعيرات الدموية، مقياس الروماتيزم، أخرى)؛ المستخدم النهائي (البترول (النفط والغاز)، الكيماويات، الأدوية، الأغذية والمشروبات، أخرى)، والجغرافيا (أمريكا الشمالية، أوروبا، منطقة آسيا والمحيط الهادئ، الشرق الأوسط وأفريقيا، وأمريكا الجنوبية والوسطى). يتم تقسيم التحليل العالمي بشكل أكبر على المستوى الإقليمي والدول الرئيسية. يقدم التقرير القيمة بالدولار الأمريكي للتحليل والشرائح المذكورة أعلاه.
غرض التقرير
يهدف تقرير سوق مقياس اللزوجة الصادر عن The Insight Partners إلى وصف المشهد الحالي والنمو المستقبلي وأهم العوامل الدافعة والتحديات والفرص. وسيوفر هذا رؤى لمختلف أصحاب المصلحة في الأعمال التجارية، مثل:
- مزودي/مصنعي التكنولوجيا: لفهم ديناميكيات السوق المتطورة ومعرفة فرص النمو المحتملة، وتمكينهم من اتخاذ قرارات استراتيجية مستنيرة.
- المستثمرون: إجراء تحليل شامل للاتجاهات فيما يتعلق بمعدل نمو السوق، وتوقعات السوق المالية، والفرص المتاحة عبر سلسلة القيمة.
- الهيئات التنظيمية: لتنظيم السياسات ومراقبة الأنشطة في السوق بهدف تقليل الانتهاكات والحفاظ على ثقة المستثمرين ودعم سلامة السوق واستقرارها.
تجزئة سوق مقياس اللزوجة
نوع المستشعر
- الدوران
- التذبذب الالتوائي
- اهتزاز
- المكبس الساقط
- الكرة الساقطة
- فتحة
- شعري
- مقياس الروماتوميتر
- آحرون
المستخدم النهائي
- البترول
- كيميائي
- الصيدلة
- الأطعمة والمشروبات
- آحرون
قم بتخصيص هذا التقرير ليناسب متطلباتك
ستحصل على تخصيص لأي تقرير - مجانًا - بما في ذلك أجزاء من هذا التقرير، أو تحليل على مستوى الدولة، وحزمة بيانات Excel، بالإضافة إلى الاستفادة من العروض والخصومات الرائعة للشركات الناشئة والجامعات
سوق مقياس اللزوجة: رؤى استراتيجية
-
احصل على أهم اتجاهات السوق الرئيسية لهذا التقرير.ستتضمن هذه العينة المجانية تحليلاً للبيانات، بدءًا من اتجاهات السوق وحتى التقديرات والتوقعات.
عوامل نمو سوق مقياس اللزوجة
- الطلب المتزايد من الصناعات الدوائية والتكنولوجيا الحيوية: لضمان خصائص التدفق المناسبة وتحسين العمليات الدوائية، فإن أجهزة قياس اللزوجة ضرورية لتحديد لزوجة تركيبات الأدوية. وتزداد الحاجة إلى هذه الأدوات بسبب نمو صناعة التكنولوجيا الحيوية. وقد ساعد هذا العامل في نمو السوق بشكل عام في الماضي القريب ومن المتوقع أن يستمر في نفس الاتجاه خلال فترة التنبؤ.
- الطلب المتزايد من الأغذية والمشروبات: لضمان خصائص التدفق المناسبة وتحسين عمليات الأغذية، فإن أجهزة قياس اللزوجة ضرورية لتحديد لزوجة تركيبات الأغذية والمشروبات. هناك طلب كبير على أجهزة قياس اللزوجة بسبب متطلبات مراقبة الجودة في سلامة الأغذية واتساقها، وخاصة مع صرامة المعايير التنظيمية. وقد ساعد هذا العامل في نمو السوق الإجمالي في الماضي القريب ومن المتوقع أن يستمر في نفس الاتجاه خلال فترة التنبؤ.
- زيادة الاستثمار في البحث والتطوير: إن الطلب المتزايد على أجهزة قياس اللزوجة لفهم وتحسين خصائص المواد هو نتيجة لأنشطة البحث الجارية في علم المواد والصناعات الصناعية الأخرى. هذا الاتجاه سائد بشكل خاص في الصناعات مثل مستحضرات التجميل والسيارات والفضاء الجوي. وقد ساعد هذا العامل في نمو السوق الإجمالي في الماضي القريب ومن المتوقع أن يستمر في اتجاه مماثل خلال فترة التنبؤ.
الاتجاهات المستقبلية لسوق مقياس اللزوجة
- التطورات التكنولوجية: لقد زادت الحاجة إلى أجهزة قياس اللزوجة المدمجة، والتي تعمل على تحسين الكفاءة التشغيلية والسلامة، نتيجة لأتمتة عمليات الإنتاج، وخاصة في مرافق التكرير. وقد ساعد هذا العامل في نمو السوق الإجمالي في الماضي القريب ومن المتوقع أن يستمر في نفس الاتجاه خلال فترة التنبؤ.
- الأجهزة المبتكرة: نتيجة للتقدم التكنولوجي، تم تطوير أجهزة قياس اللزوجة الأكثر تعقيدًا ذات القدرات المحسنة، مثل التصميمات المحمولة وسهلة الاستخدام والتي تستوعب مجموعة متنوعة من التطبيقات. وقد ساعد هذا العامل في نمو السوق الإجمالي في الماضي القريب ومن المتوقع أن يستمر في نفس الاتجاه خلال فترة التنبؤ.
- الأطر التنظيمية: تضطر الشركات، بموجب أطر تنظيمية أكثر صرامة على مستوى الصناعة فيما يتعلق بسلامة المنتج وجودته، إلى استخدام أجهزة قياس اللزوجة المتطورة من أجل ضمان الالتزام بقواعد السلامة. وقد ساعد هذا العامل في نمو السوق الإجمالي في الماضي القريب ومن المتوقع أن يستمر في اتجاه مماثل خلال الفترة المتوقعة.
فرص سوق أجهزة قياس اللزوجة
- توسيع البنية الأساسية للرعاية الصحية في الاقتصادات الناشئة: إن التحديث السريع في منطقة آسيا والمحيط الهادئ، وخاصة في الصين والهند، يفتح آفاقًا مربحة لتوسيع السوق. تشهد هذه الدول إنفاقات كبيرة في قطاعات التصنيع التي تحتاج إلى أدوات لقياس اللزوجة. وقد ساعد هذا العامل في نمو السوق الإجمالي في الماضي القريب ومن المتوقع أن يستمر في نفس الاتجاه خلال فترة التنبؤ.
- تبسيط عمليات الاختبار: من خلال تقليل التدخل البشري في قياسات اللزوجة، تعمل أجهزة قياس اللزوجة الآلية على تقليل الأخطاء اليدوية. وهذا أمر بالغ الأهمية بشكل خاص في قطاعات مثل معالجة الأغذية والأدوية حيث تكون الدقة ضرورية. يصبح من الممكن مراقبة اللزوجة بشكل مستمر وفي الوقت الفعلي من خلال الأتمتة، مما يتيح تعديلات سريعة للعملية استجابة لتغيرات اللزوجة. هذه القدرة ضرورية للحفاظ على اتساق وجودة المنتجات، وخاصة في بيئات الإنتاج.
- إنترنت الأشياء (IoT): التكامل مع الصناعة 4.0: أصبحت أجهزة قياس اللزوجة الآن جزءًا من الأنظمة الآلية التي تستفيد من إنترنت الأشياء (IoT) نتيجة لظهور الصناعة 4.0. يمكن لأجهزة قياس اللزوجة ومعدات الإنتاج الأخرى مشاركة البيانات بسهولة بفضل هذا الاتصال، مما يزيد من التحكم في العملية وكفاءتها بشكل عام.
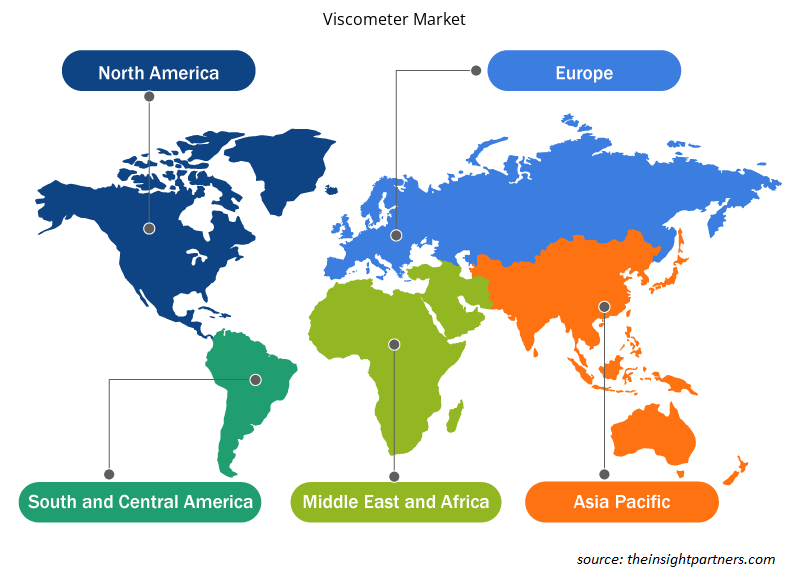
رؤى إقليمية حول سوق أجهزة قياس اللزوجة
لقد قام المحللون في Insight Partners بشرح الاتجاهات والعوامل الإقليمية المؤثرة على سوق مقياس اللزوجة طوال فترة التنبؤ بشكل شامل. يناقش هذا القسم أيضًا قطاعات سوق مقياس اللزوجة والجغرافيا في جميع أنحاء أمريكا الشمالية وأوروبا ومنطقة آسيا والمحيط الهادئ والشرق الأوسط وأفريقيا وأمريكا الجنوبية والوسطى.
- احصل على البيانات الإقليمية المحددة لسوق مقياس اللزوجة
نطاق تقرير سوق مقياس اللزوجة
| سمة التقرير | تفاصيل |
|---|---|
| حجم السوق في عام 2023 | XX مليون دولار أمريكي |
| حجم السوق بحلول عام 2031 | XX مليون دولار أمريكي |
| معدل النمو السنوي المركب العالمي (2023 - 2031) | 4.2% |
| البيانات التاريخية | 2021-2022 |
| فترة التنبؤ | 2024-2031 |
| القطاعات المغطاة |
حسب نوع المستشعر
|
| المناطق والدول المغطاة |
أمريكا الشمالية
|
| قادة السوق وملفات تعريف الشركات الرئيسية |
|
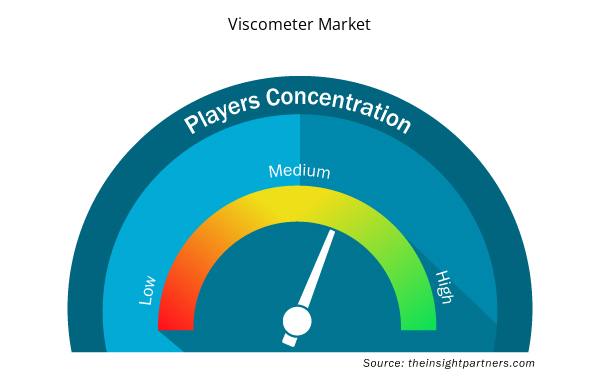
كثافة اللاعبين في سوق مقياس اللزوجة: فهم تأثيرها على ديناميكيات الأعمال
يشهد سوق مقياس اللزوجة نموًا سريعًا، مدفوعًا بالطلب المتزايد من المستخدم النهائي بسبب عوامل مثل تفضيلات المستهلك المتطورة والتقدم التكنولوجي والوعي المتزايد بفوائد المنتج. ومع ارتفاع الطلب، تعمل الشركات على توسيع عروضها والابتكار لتلبية احتياجات المستهلكين والاستفادة من الاتجاهات الناشئة، مما يؤدي إلى زيادة نمو السوق.
تشير كثافة اللاعبين في السوق إلى توزيع الشركات أو المؤسسات العاملة في سوق أو صناعة معينة. وهي تشير إلى عدد المنافسين (اللاعبين في السوق) الموجودين في مساحة سوق معينة نسبة إلى حجمها أو قيمتها السوقية الإجمالية.
الشركات الرئيسية العاملة في سوق مقياس اللزوجة هي:
- شركة أميتك
- شركة ثيرمو فيشر العلمية
- سبكتريس (مالفرن)
- شركة المياه
- شركة كانون للأدوات
إخلاء المسؤولية : الشركات المذكورة أعلاه ليست مرتبة بأي ترتيب معين.
- احصل على نظرة عامة على أهم اللاعبين الرئيسيين في سوق مقياس اللزوجة
نقاط البيع الرئيسية
- التغطية الشاملة: يغطي التقرير بشكل شامل تحليل المنتجات والخدمات والأنواع والمستخدمين النهائيين لسوق مقياس اللزوجة، مما يوفر صورة شاملة.
- تحليل الخبراء: تم تجميع التقرير على أساس الفهم العميق لخبراء الصناعة والمحللين.
- معلومات محدثة: يضمن التقرير أهمية الأعمال التجارية بسبب تغطيته للمعلومات الحديثة واتجاهات البيانات.
- خيارات التخصيص: يمكن تخصيص هذا التقرير لتلبية متطلبات العملاء المحددة وبما يتناسب مع استراتيجيات العمل بشكل مناسب.
وبالتالي، يمكن أن يساعد تقرير البحث حول سوق مقياس اللزوجة في تمهيد الطريق لفك شفرة وفهم سيناريو الصناعة وآفاق النمو. ورغم وجود بعض المخاوف المشروعة، فإن الفوائد الإجمالية لهذا التقرير تميل إلى التفوق على العيوب.

مرينال محللة أبحاث مخضرمة، تتمتع بخبرة تزيد عن 8 سنوات في مجال استخبارات واستشارات سوق علوم الحياة. بفضل عقليتها الاستراتيجية والتزامها الراسخ بالتميز، اكتسبت خبرة واسعة في التنبؤ بالصناعات الدوائية، وتقييم فرص السوق، وتطوير معايير الصناعة. يرتكز عملها على تقديم رؤى عملية تُمكّن العملاء من اتخاذ قرارات استراتيجية مدروسة.
تكمن قوة مرينال الأساسية في ترجمة مجموعات البيانات الكمية المعقدة إلى معلومات استخباراتية قيّمة. وتُعدّ براعتها التحليلية ركيزةً أساسيةً في صياغة استراتيجيات دخول السوق (GTM) واكتشاف فرص النمو في قطاعي الأدوية والأجهزة الطبية. وبصفتها مستشارةً موثوقةً، تُركز مرينال باستمرار على تبسيط إجراءات سير العمل وترسيخ أفضل الممارسات، مما يُعزز الابتكار والكفاءة التشغيلية لعملائها.
- التحليل التاريخي (سنتان)، سنة الأساس، التوقعات (7 سنوات) مع معدل النمو السنوي المركب
- تحليل PEST و SWOT
- حجم السوق والقيمة / الحجم - عالمي، إقليمي، بلد
- الصناعة والمنافسة
- مجموعة بيانات إكسل
التقارير الحديثة
شهادات العملاء
تقرير سوق أنظمة SCADA من Insight Partners شامل، ويقدم رؤى قيّمة حول الاتجاهات الحالية والتوقعات المستقبلية. تميّز الفريق باحترافية عالية وسرعة في الاستجابة ودعم مستمر طوال الوقت. نحن راضون جدًا ونوصي بشدة بخدماتهم.
ران كيديم شريك, شركة ريالي تكنولوجيز المحدودةطلبتُ تقريرًا عن سوق برمجيات محدد، وأعدّه الفريق في غضون أيام قليلة. كانت المعلومات ذات صلة وثيقة وعرضها جيد. ثم طلبتُ بعض التعديلات والإضافات على التقرير. وكان الفريق متجاوبًا للغاية، وحصلتُ على التقرير النهائي في أقل من أسبوع.
جان هيرفيه جين رئيس مجلس الإدارة, فيوتشر أناليتيكاعملنا مع شركة "إنسايت بارتنرز" لإجراء دراسة سوقية وتوقعات مهمة. زودونا برؤى واضحة حول الفرص والمخاطر، مما ساعدنا في صياغة خططنا. كانت أبحاثهم سهلة الاستخدام ومبنية على بيانات دقيقة، مما ساعدنا على اتخاذ قرارات ذكية وواثقة. نوصي بهم بشدة.
بيوش ناجبال نائب الرئيس الأول, شعاع عالي عالميقدّمت شركة Insight Partners أبحاثًا سوقية ثاقبة ومنظمة جيدًا بخبرة واسعة في هذا المجال. تميّز فريقهم بالاحترافية وسرعة الاستجابة طوال الوقت. وسهّل موقعهم الإلكتروني سهل الاستخدام الوصول إلى تقارير القطاع. نوصي بهم بشدة لخدمات بحثية موثوقة وعالية الجودة.
يوكيهيكو أداتشي المدير التنفيذي, ديب بلو، ذ.م.م.هذه أول مرة أشتري فيها تقرير سوق من The Insight Partners. رغم أنني كنت مترددًا في البداية، إلا أنني زرت موقعهم الإلكتروني وشعرت براحة أكبر للمخاطرة وشراء تقرير السوق. أنا راضٍ تمامًا عن جودة التقرير وخدمة العملاء. كانت لديّ عدة أسئلة وتعليقات حول التقرير الأولي، ولكن بعد بضع محادثات عبر البريد الإلكتروني مع محللهم، أعتقد أن لديّ تقريرًا يمكنني استخدامه كمدخل لعملية التخطيط الاستراتيجي لدينا. شكرًا جزيلاً لكم على تخصيص وقتكم الإضافي وجعل هذه التجربة إيجابية. سأوصي بخدماتكم للآخرين بالتأكيد، وستكونون أول من ألجأ إليه عندما نحتاج إلى المزيد من بيانات السوق.
جون سوزوكي الرئيس والرئيس التنفيذي وعضو مجلس الإدارة, بي كيه تكنولوجيزأود أن أقدّر دعمكم واحترافيتكم في الاستجابة لطلبي للحصول على معلومات بشأن سوق التشخيص المخبري للأمراض المعدية في نيجيريا. كما أُقدّر صبركم وتوجيهكم، واستعدادكم لتقديم خصم، مما مكّننا في النهاية من إتمام الصفقة. أتطلع إلى التعامل مع "ذا إنسايت بارتنرز" مستقبلًا، كل ذلك بفضل الانطباع الذي تركتموه لديّ نتيجةً لهذا اللقاء الأول.
الدكتور تشيجيوك أونيا المدير الإداري, شركة باينكريست للرعاية الصحية المحدودةسبب الشراء
- اتخاذ قرارات مدروسة
- فهم ديناميكيات السوق
- تحليل المنافسة
- رؤى العملاء
- توقعات السوق
- تخفيف المخاطر
- التخطيط الاستراتيجي
- مبررات الاستثمار
- تحديد الأسواق الناشئة
- تحسين استراتيجيات التسويق
- تعزيز الكفاءة التشغيلية
- مواكبة التوجهات التنظيمية


 احصل على عينة مجانية ل - سوق مقياس اللزوجة