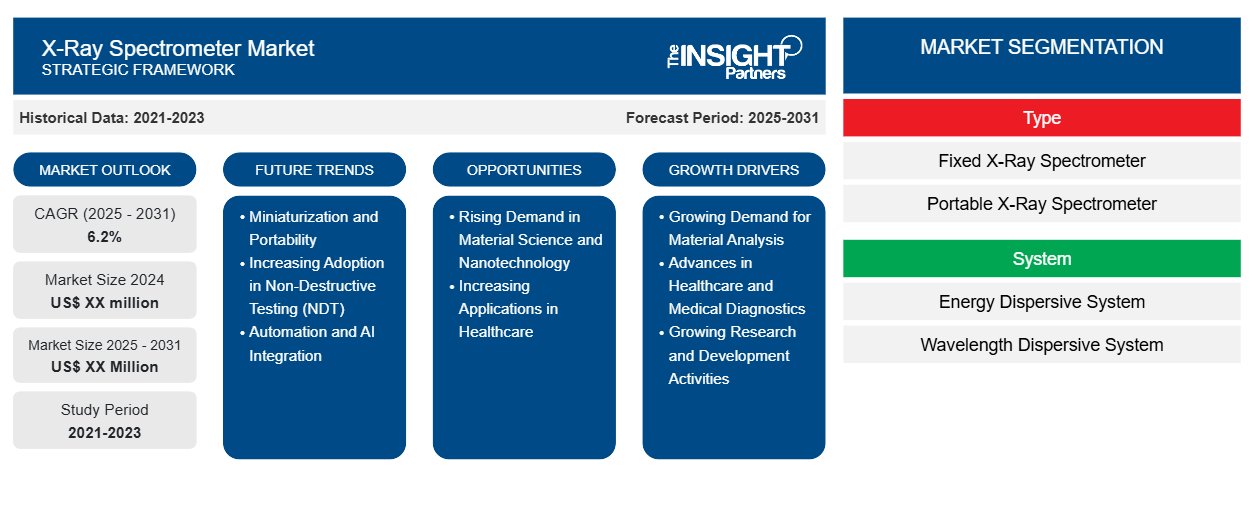
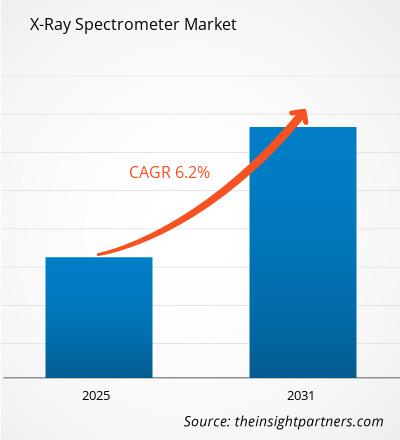
من المتوقع أن يسجل سوق مطياف الأشعة السينية معدل نمو سنوي مركب بنسبة 6.2٪ من عام 2024 إلى عام 2031، مع توسع حجم السوق من XX مليون دولار أمريكي في عام 2024 إلى XX مليون دولار أمريكي بحلول عام 2031.
تم تقسيم التقرير حسب النوع (مطياف الأشعة السينية الثابت، مطياف الأشعة السينية المحمول)؛ النظام (نظام تشتيت الطاقة، نظام تشتيت الطول الموجي)؛ المستخدم النهائي (المستشفيات، المختبرات البحثية والسريرية، الأكاديمية). تم تقسيم التحليل العالمي بشكل أكبر على المستوى الإقليمي والدول الرئيسية. يقدم التقرير القيمة بالدولار الأمريكي للتحليل والقطاعات المذكورة أعلاه.
غرض التقرير
يهدف تقرير سوق أجهزة قياس الطيف بالأشعة السينية الصادر عن The Insight Partners إلى وصف المشهد الحالي والنمو المستقبلي وأهم العوامل الدافعة والتحديات والفرص. وسيوفر هذا رؤى لمختلف أصحاب المصلحة في الأعمال التجارية، مثل:
- مزودي/مصنعي التكنولوجيا: لفهم ديناميكيات السوق المتطورة ومعرفة فرص النمو المحتملة، وتمكينهم من اتخاذ قرارات استراتيجية مستنيرة.
- المستثمرون: إجراء تحليل شامل للاتجاهات فيما يتعلق بمعدل نمو السوق، وتوقعات السوق المالية، والفرص المتاحة عبر سلسلة القيمة.
- الهيئات التنظيمية: لتنظيم السياسات ومراقبة الأنشطة في السوق بهدف تقليل الانتهاكات والحفاظ على ثقة المستثمرين ودعم سلامة السوق واستقرارها.
تجزئة سوق مطياف الأشعة السينية
يكتب
- مطياف الأشعة السينية الثابت
- مطياف الأشعة السينية المحمول
نظام
- نظام توزيع الطاقة
- نظام تشتيت الطول الموجي
المستخدم النهائي
- المستشفيات
- المختبرات البحثية والسريرية
- أكاديمي
الجغرافيا
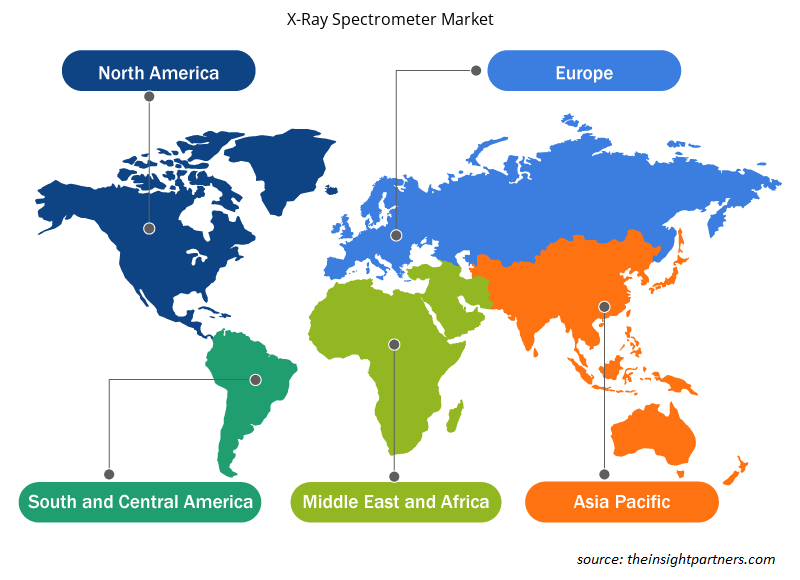
- أمريكا الشمالية
- أوروبا
- آسيا والمحيط الهادئ
- أمريكا الجنوبية والوسطى
- الشرق الأوسط وأفريقيا
قم بتخصيص هذا التقرير ليناسب متطلباتك
ستحصل على تخصيص لأي تقرير - مجانًا - بما في ذلك أجزاء من هذا التقرير، أو تحليل على مستوى الدولة، وحزمة بيانات Excel، بالإضافة إلى الاستفادة من العروض والخصومات الرائعة للشركات الناشئة والجامعات
سوق مطياف الأشعة السينية: رؤى استراتيجية
- احصل على أهم اتجاهات السوق الرئيسية لهذا التقرير.ستتضمن هذه العينة المجانية تحليلاً للبيانات، بدءًا من اتجاهات السوق وحتى التقديرات والتوقعات.
عوامل نمو سوق مطياف الأشعة السينية
- الطلب المتزايد على تحليل المواد: إن الحاجة إلى أجهزة قياس الطيف بالأشعة السينية تنبع من الحاجة إلى التحليل الدقيق للعناصر في قطاعات مثل التصنيع والمعادن والتعدين. وهذه الأدوات مفيدة لتحديد التركيب الكيميائي للمعادن والسبائك والمعادن.
- التطورات في الرعاية الصحية والتشخيص الطبي: ينمو السوق نتيجة للاستخدام المتزايد لأجهزة قياس الطيف بالأشعة السينية في التطبيقات الطبية، مثل تشخيص السرطان والأبحاث. وهي ضرورية لتحديد العناصر النزرة في الأنسجة وتقييم المواد البيولوجية.
- أنشطة البحث والتطوير المتنامية: تزداد الحاجة إلى أجهزة قياس الطيف بالأشعة السينية في المختبرات والمؤسسات الأكاديمية من خلال توسيع البحث والتطوير في علوم المواد والكيمياء والأدوية، مما يعزز نمو السوق.
الاتجاهات المستقبلية لسوق مطياف الأشعة السينية
- التصغير والقابلية للنقل: يركز المصنعون على تطوير أجهزة مطياف الأشعة السينية المدمجة والقابلة للنقل والتي توفر إمكانية التنقل دون التضحية بالدقة. تُستخدم هذه الأجهزة المحمولة بشكل متزايد في مجالات مثل مراقبة البيئة وعلم الآثار والأبحاث الميدانية. ويشهد الطلب المتزايد على الحلول المصغرة في قطاع الأبحاث في البلدان المتقدمة.
- زيادة الاعتماد على الاختبارات غير المدمرة: أصبحت أجهزة قياس الطيف بالأشعة السينية أكثر انتشارًا في الاختبارات غير المدمرة للصناعات مثل صناعة الطيران والسيارات والبناء، حيث من الضروري تقييم سلامة المواد دون إتلاف المكونات. وبالتالي، فإن السلامة هي أحد المخاوف الرئيسية التي نشأت عند تطوير أجهزة قياس الطيف بالأشعة السينية في جميع أنحاء العالم.
- الأتمتة وتكامل الذكاء الاصطناعي: يتزايد تكامل الذكاء الاصطناعي والأتمتة في قياس الطيف بالأشعة السينية. يمكن للأنظمة التي تعمل بالذكاء الاصطناعي تحليل مجموعات البيانات الكبيرة، وأتمتة العمليات، وتحسين دقة وسرعة تحليل المواد، مما يجعلها أكثر كفاءة للتطبيقات الصناعية والبحثية. أصبح تفسير البيانات وتحليلها أسهل بمساعدة الذكاء الاصطناعي، وبالتالي يتم الاستفادة منه بشكل متزايد من قبل اللاعبين الرئيسيين في الصناعة
فرص سوق مطياف الأشعة السينية
- الطلب المتزايد على علوم المواد وتكنولوجيا النانو: مع التركيز المتزايد على تكنولوجيا النانو والحاجة إلى تحليل دقيق للمواد النانوية، هناك فرصة كبيرة لاستخدام أجهزة قياس الطيف بالأشعة السينية في أبحاث المواد المتقدمة، وتقديم تحليل عنصري مفصل على المستوى الذري. الطلب على أجهزة قياس الطيف بالأشعة السينية آخذ في الارتفاع في مجال البحوث وكذلك التطبيقات السريرية في جميع أنحاء العالم، ومن المتوقع أن يفتح هذا المجال أمام الشركات المتوسطة والكبيرة.
- التطبيقات المتزايدة في الرعاية الصحية: توفر صناعات الرعاية الصحية والأدوية فرصًا كبيرة حيث يتم استخدام أجهزة قياس الطيف بالأشعة السينية بشكل متزايد في الأبحاث البيولوجية والطبية، مثل تحليل عينات الأنسجة، واكتشاف العناصر النزرة في التشخيص، وضمان نقاء الأدوية في تصنيع الأدوية. علاوة على ذلك، من المتوقع أن يوفر الحجم المتزايد للتجارب السريرية بسبب الاستثمار المتزايد في قطاع البحث والتطوير فرصًا هائلة للمصنعين في مجموعة واسعة من القطاعات الطبية.
رؤى إقليمية حول سوق مطياف الأشعة السينية
لقد قام المحللون في Insight Partners بشرح الاتجاهات والعوامل الإقليمية المؤثرة على سوق مطياف الأشعة السينية طوال فترة التنبؤ بشكل شامل. يناقش هذا القسم أيضًا قطاعات سوق مطياف الأشعة السينية والجغرافيا في جميع أنحاء أمريكا الشمالية وأوروبا ومنطقة آسيا والمحيط الهادئ والشرق الأوسط وأفريقيا وأمريكا الجنوبية والوسطى.
- احصل على البيانات الإقليمية المحددة لسوق مطياف الأشعة السينية
نطاق تقرير سوق مطياف الأشعة السينية
| سمة التقرير | تفاصيل |
|---|---|
| حجم السوق في عام 2024 | XX مليون دولار أمريكي |
| حجم السوق بحلول عام 2031 | XX مليون دولار أمريكي |
| معدل النمو السنوي المركب العالمي (2025 - 2031) | 6.2% |
| البيانات التاريخية | 2021-2023 |
| فترة التنبؤ | 2025-2031 |
| القطاعات المغطاة | حسب النوع
|
| المناطق والدول المغطاة | أمريكا الشمالية
|
| قادة السوق وملفات تعريف الشركات الرئيسية |
|
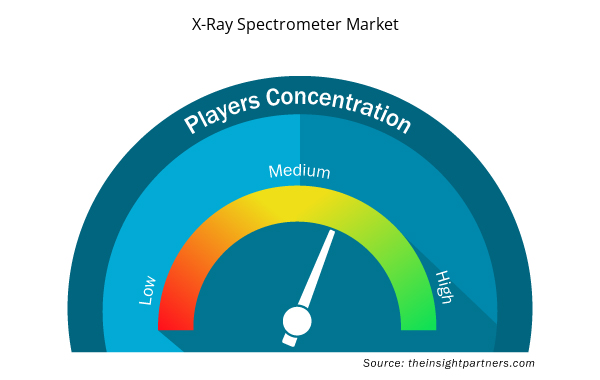
كثافة اللاعبين في سوق مطياف الأشعة السينية: فهم تأثيرها على ديناميكيات الأعمال
يشهد سوق أجهزة قياس الطيف بالأشعة السينية نموًا سريعًا، مدفوعًا بالطلب المتزايد من جانب المستخدم النهائي بسبب عوامل مثل تفضيلات المستهلكين المتطورة والتقدم التكنولوجي والوعي المتزايد بفوائد المنتج. ومع ارتفاع الطلب، تعمل الشركات على توسيع عروضها والابتكار لتلبية احتياجات المستهلكين والاستفادة من الاتجاهات الناشئة، مما يؤدي إلى زيادة نمو السوق.
تشير كثافة اللاعبين في السوق إلى توزيع الشركات أو المؤسسات العاملة في سوق أو صناعة معينة. وهي تشير إلى عدد المنافسين (اللاعبين في السوق) الموجودين في مساحة سوق معينة نسبة إلى حجمها أو قيمتها السوقية الإجمالية.
الشركات الرئيسية العاملة في سوق مطياف الأشعة السينية هي:
- شركة البلطيق للأدوات العلمية
- شركة أنظمة الأشعة التحليلية المحدودة
- شركة SPECTRO للأجهزة التحليلية المحدودة
- شركة ثيرمو فيشر العلمية
- شركة شيمادزو
إخلاء المسؤولية : الشركات المذكورة أعلاه ليست مرتبة بأي ترتيب معين.
- احصل على نظرة عامة على أهم اللاعبين الرئيسيين في سوق أجهزة قياس الأشعة السينية
نقاط البيع الرئيسية
- التغطية الشاملة: يغطي التقرير بشكل شامل تحليل المنتجات والخدمات والأنواع والمستخدمين النهائيين لسوق مطياف الأشعة السينية، مما يوفر صورة شاملة.
- تحليل الخبراء: تم تجميع التقرير على أساس الفهم العميق لخبراء الصناعة والمحللين.
- معلومات محدثة: يضمن التقرير أهمية الأعمال التجارية بسبب تغطيته للمعلومات الحديثة واتجاهات البيانات.
- خيارات التخصيص: يمكن تخصيص هذا التقرير لتلبية متطلبات العملاء المحددة وبما يتناسب مع استراتيجيات العمل بشكل مناسب.
وبالتالي، يمكن أن يساعد تقرير البحث حول سوق مطياف الأشعة السينية في تمهيد الطريق لفك شفرة وفهم سيناريو الصناعة وآفاق النمو. ورغم وجود بعض المخاوف المشروعة، فإن الفوائد الإجمالية لهذا التقرير تميل إلى التفوق على العيوب.
- التحليل التاريخي (سنتان)، السنة الأساسية، التوقعات (7 سنوات) مع معدل النمو السنوي المركب
- تحليل PEST و SWOT
- حجم السوق والقيمة / الحجم - عالميًا وإقليميًا وقطريًا
- الصناعة والمنافسة
- مجموعة بيانات Excel


Report Coverage
Revenue forecast, Company Analysis, Industry landscape, Growth factors, and Trends

Segment Covered
This text is related
to segments covered.

Regional Scope
North America, Europe, Asia Pacific, Middle East & Africa, South & Central America

Country Scope
This text is related
to country scope.
الأسئلة الشائعة
PANalytical, Bruker. Thermo Fisher Scientific Inc., Shimadzu Corporation, are the major companies operating in the X-Ray spectrometer market
The market is expected to grow at a CAGR of 6.3%
Increasing prevalence of dental diseases is the major factors boosting the dental equipment market growth
Asia Pacific is estimated to grow at the highest CAGR over the forecast year (2023 - 2031)
The North America region accounts for highest revenue share X-Ray spectrometer market
The final report will duly include market size and projection estimates for all the segments from 2021 to 2031, along with a revenue share and compound annual growth rate (%) for the regional
/
country-wise market wherein 2021-2022 are the historic years, 2023 is considered to be the base year, and the forecast will be provided till 2031, along with CAGR (%)
Trends and growth analysis reports related to Life Sciences : READ MORE..
The List of Companies
1. Baltic Scientific Instruments
2. Analytical X-Ray Systems Co. Ltd.
3. SPECTRO Analytical Instruments GmbH
4. Thermo Fisher Scientific Inc.
5. Shimadzu Corporation
6. PANalytical
7. Bruker
8. EAG Inc.
9. Innov-X Systems, Inc.
10. FAST ComTec
The Insight Partners performs research in 4 major stages: Data Collection & Secondary Research, Primary Research, Data Analysis and Data Triangulation & Final Review.
- Data Collection and Secondary Research:
As a market research and consulting firm operating from a decade, we have published and advised several client across the globe. First step for any study will start with an assessment of currently available data and insights from existing reports. Further, historical and current market information is collected from Investor Presentations, Annual Reports, SEC Filings, etc., and other information related to company’s performance and market positioning are gathered from Paid Databases (Factiva, Hoovers, and Reuters) and various other publications available in public domain.
Several associations trade associates, technical forums, institutes, societies and organization are accessed to gain technical as well as market related insights through their publications such as research papers, blogs and press releases related to the studies are referred to get cues about the market. Further, white papers, journals, magazines, and other news articles published in last 3 years are scrutinized and analyzed to understand the current market trends.
- Primary Research:
The primarily interview analysis comprise of data obtained from industry participants interview and answers to survey questions gathered by in-house primary team.
For primary research, interviews are conducted with industry experts/CEOs/Marketing Managers/VPs/Subject Matter Experts from both demand and supply side to get a 360-degree view of the market. The primary team conducts several interviews based on the complexity of the markets to understand the various market trends and dynamics which makes research more credible and precise.
A typical research interview fulfils the following functions:
- Provides first-hand information on the market size, market trends, growth trends, competitive landscape, and outlook
- Validates and strengthens in-house secondary research findings
- Develops the analysis team’s expertise and market understanding
Primary research involves email interactions and telephone interviews for each market, category, segment, and sub-segment across geographies. The participants who typically take part in such a process include, but are not limited to:
- Industry participants: VPs, business development managers, market intelligence managers and national sales managers
- Outside experts: Valuation experts, research analysts and key opinion leaders specializing in the electronics and semiconductor industry.
Below is the breakup of our primary respondents by company, designation, and region:

Once we receive the confirmation from primary research sources or primary respondents, we finalize the base year market estimation and forecast the data as per the macroeconomic and microeconomic factors assessed during data collection.
- Data Analysis:
Once data is validated through both secondary as well as primary respondents, we finalize the market estimations by hypothesis formulation and factor analysis at regional and country level.
- Macro-Economic Factor Analysis:
We analyse macroeconomic indicators such the gross domestic product (GDP), increase in the demand for goods and services across industries, technological advancement, regional economic growth, governmental policies, the influence of COVID-19, PEST analysis, and other aspects. This analysis aids in setting benchmarks for various nations/regions and approximating market splits. Additionally, the general trend of the aforementioned components aid in determining the market's development possibilities.
- Country Level Data:
Various factors that are especially aligned to the country are taken into account to determine the market size for a certain area and country, including the presence of vendors, such as headquarters and offices, the country's GDP, demand patterns, and industry growth. To comprehend the market dynamics for the nation, a number of growth variables, inhibitors, application areas, and current market trends are researched. The aforementioned elements aid in determining the country's overall market's growth potential.
- Company Profile:
The “Table of Contents” is formulated by listing and analyzing more than 25 - 30 companies operating in the market ecosystem across geographies. However, we profile only 10 companies as a standard practice in our syndicate reports. These 10 companies comprise leading, emerging, and regional players. Nonetheless, our analysis is not restricted to the 10 listed companies, we also analyze other companies present in the market to develop a holistic view and understand the prevailing trends. The “Company Profiles” section in the report covers key facts, business description, products & services, financial information, SWOT analysis, and key developments. The financial information presented is extracted from the annual reports and official documents of the publicly listed companies. Upon collecting the information for the sections of respective companies, we verify them via various primary sources and then compile the data in respective company profiles. The company level information helps us in deriving the base number as well as in forecasting the market size.
- Developing Base Number:
Aggregation of sales statistics (2020-2022) and macro-economic factor, and other secondary and primary research insights are utilized to arrive at base number and related market shares for 2022. The data gaps are identified in this step and relevant market data is analyzed, collected from paid primary interviews or databases. On finalizing the base year market size, forecasts are developed on the basis of macro-economic, industry and market growth factors and company level analysis.
- Data Triangulation and Final Review:
The market findings and base year market size calculations are validated from supply as well as demand side. Demand side validations are based on macro-economic factor analysis and benchmarks for respective regions and countries. In case of supply side validations, revenues of major companies are estimated (in case not available) based on industry benchmark, approximate number of employees, product portfolio, and primary interviews revenues are gathered. Further revenue from target product/service segment is assessed to avoid overshooting of market statistics. In case of heavy deviations between supply and demand side values, all thes steps are repeated to achieve synchronization.
We follow an iterative model, wherein we share our research findings with Subject Matter Experts (SME’s) and Key Opinion Leaders (KOLs) until consensus view of the market is not formulated – this model negates any drastic deviation in the opinions of experts. Only validated and universally acceptable research findings are quoted in our reports.
We have important check points that we use to validate our research findings – which we call – data triangulation, where we validate the information, we generate from secondary sources with primary interviews and then we re-validate with our internal data bases and Subject matter experts. This comprehensive model enables us to deliver high quality, reliable data in shortest possible time.
 احصل على عينة مجانية لهذا التقرير