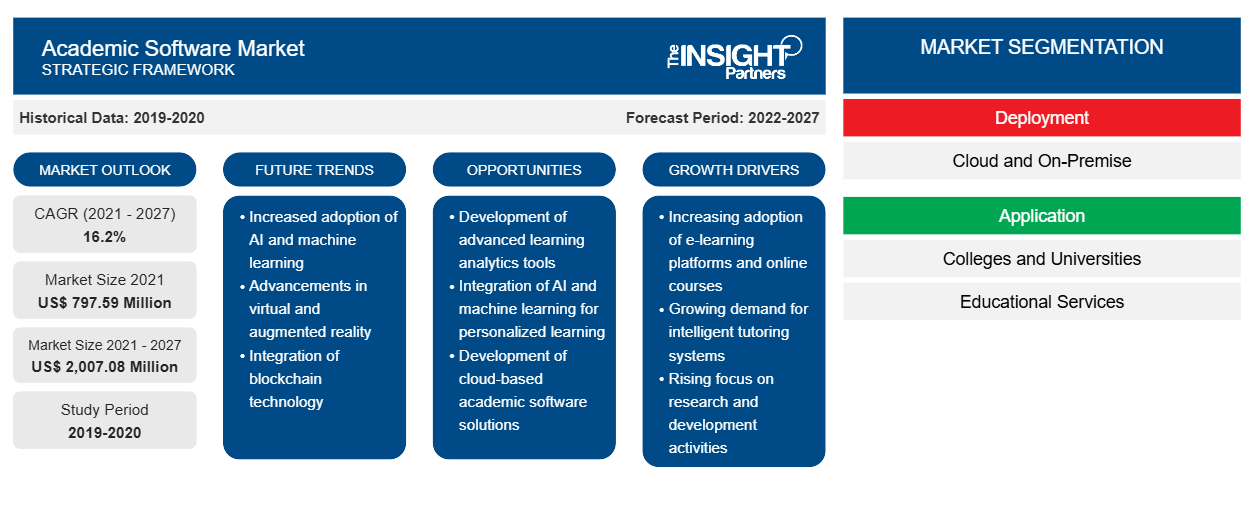
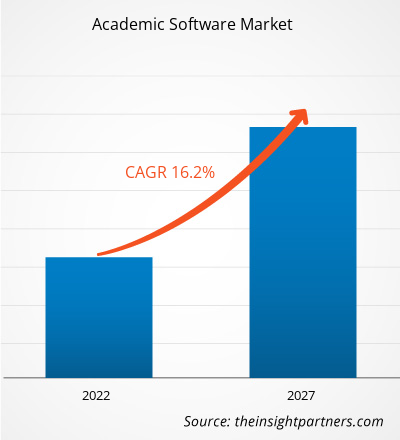
Der Markt für akademische Software soll von 797,59 Millionen US-Dollar im Jahr 2021 auf 2.007,08 Millionen US-Dollar im Jahr 2027 wachsen. Im Prognosezeitraum von 2021 bis 2027 wird für den Markt für akademische Software eine durchschnittliche jährliche Wachstumsrate (CAGR) von 16,2 % erwartet.
Die zunehmende Verbreitung von eLearning in allen Institutionen ist der Schlüsselfaktor für das Wachstum des Marktes für akademische Software. Beim eLearning verändert sich durch das Lesen oder Ansehen von Inhalten die Art und Weise, wie Bildung vermittelt wird. Mehrere eLearning-Kurse wie Animationen, Podcasts und Videos schaffen eine multimodale und realistische Lernumgebung. ELearning-Bildungsinhalte eröffnen Lernenden über Computer, Laptops, Tablets oder Smartphones mehrere Möglichkeiten des immersiven Lernens. Anstatt sich in einer passiven Umgebung zu befinden, können die Studierenden einfach und schnell auswählen, was sie lernen möchten. Diese Vorteile erhöhen die Nachfrage nach akademischer Software auf der ganzen Welt.
Die COVID-19-Pandemie hat den Bildungssektor weltweit schwer getroffen. Dies hat auch die Einführung von Online-Bildungssystemen in allen großen Volkswirtschaften der Welt gefördert und damit die Einführung von Software für verschiedene Anwendungen beeinflusst, z. B. das Halten von Vorlesungen, die Verwaltung von Studenten und andere betriebliche Aktivitäten von entfernten Standorten aus. Daher wird erwartet, dass sich die zunehmende Einführung technologisch fortschrittlicher Lösungen im gesamten Sektor positiv auf das Wachstum des Marktes für akademische Software während der Pandemie auswirken wird.
Basierend auf der Bereitstellung ist der Markt für akademische Software in Cloud und On-Premise unterteilt. Im Jahr 2019 hatte das Cloud-Segment einen höheren Marktanteil. In den letzten Jahren hat die Technologiebranche einen stetigen Anstieg der Nutzung von Cloud-basiertem Computing erlebt. Dies ist auf die Tatsache zurückzuführen, dass Cloud-basiertes Computing die Implementierungszeit vereinfacht und die Bereitstellungskosten erheblich senkt. Dieser Vorteil hat eine große Anzahl von Endbenutzern angezogen; daher liefert die Mehrheit der Akteure auf dem Markt für akademische Software Cloud-basierte Produkte in Verbindung mit der wachsenden Nachfrage nach Cloud-basierter Software. Darüber hinaus hat sich die Internet-Infrastruktur in Industrieländern weiterentwickelt und floriert in vielen Entwicklungsländern, sodass Endbenutzer sowohl in Industrie- als auch in Entwicklungsländern auf Cloud-basierte Lösungen zugreifen können.
Passen Sie diesen Bericht Ihren Anforderungen an
Sie erhalten kostenlos individuelle Anpassungen an jedem Bericht, einschließlich Teilen dieses Berichts oder einer Analyse auf Länderebene, eines Excel-Datenpakets sowie tolle Angebote und Rabatte für Start-ups und Universitäten.
- Holen Sie sich die wichtigsten Markttrends aus diesem Bericht.Dieses KOSTENLOSE Beispiel umfasst eine Datenanalyse von Markttrends bis hin zu Schätzungen und Prognosen.
Einblicke in den Markt für akademische Software
Integration von Technologien wie künstlicher Intelligenz in akademische Softwarelösungen
Künstliche Intelligenz (KI) ist eine Technologie, die Computern die Fähigkeit verleiht, auf die gleiche Weise wie Menschen mit anderen zu kommunizieren, Ereignisse zu verstehen, zu lernen und auf Ereignisse zu reagieren. Im Laufe der Jahre wurde künstliche Intelligenz nicht nur in zahlreichen Branchen wie Sicherheit, Überwachung und Informationstechnologie eingesetzt, sondern auch im Bildungssektor immer häufiger eingesetzt. KI wird in Schulen, Colleges und Universitäten eingesetzt, um sich wiederholende Aufgaben wie Benotung, Finanzanalyse und Zulassungsverfahren zu automatisieren. Beispielsweise kann KI so kalibriert werden, dass sie die Aktionen der Lehrer bei der Benotung lernt und modelliert, und zwar mithilfe fortschrittlicher Computerprogramme wie Automated Grading, um in Zukunft automatisch Noten zu vergeben. Mit der Zeit lernt das Programm die akademischen Fähigkeiten mehrerer Schüler und erstellt auf der Grundlage ihrer Leistungen individuelle Trainingspläne.
Bereitstellungsbasierte Markteinblicke
Basierend auf der Bereitstellungsart ist der globale Markt für akademische Software in Cloud und On-Premise segmentiert. Cloudbasierte akademische Software erfährt im Vergleich zu On-Premise-Akademiesoftware eine hohe Nachfrage. Das Cloud-Segment generiert den Großteil der Nachfrage, da es aufgrund der starken Netzwerkinfrastruktur in Industrieländern vergleichsweise weniger teuer ist. Darüber hinaus konzentrieren sich die Anbieter cloudbasierter akademischer Software stark auf die Entwicklung eines hochrangigen Sicherheitspatches, um das Risiko von Cyberangriffen auszuschließen. Dieser Faktor erzeugt auch eine erhebliche Nachfrage seitens der Endbenutzer und treibt damit den Markt für akademische Software an.
Anwendungsbasierte Markteinblicke
Basierend auf der Anwendung ist der Markt für akademische Software in Hochschulen und Universitäten, Bildungsdienste und andere unterteilt. Die zunehmende Einführung moderner Lösungen in Bildungseinrichtungen und Universitäten, um Studenten sowohl Online- als auch Offline-Kurse anzubieten, gepaart mit der Initiative, allen Mitarbeitern und Studenten fortschrittliche Lösungen zur Verfügung zu stellen, beeinflusst die Einführung akademischer Software. Dies treibt das Wachstum des Marktes im Laufe der Jahre voran.
Akteure auf dem Markt für akademische Software konzentrieren sich auf Strategien wie Marktinitiativen, Akquisitionen und Produkteinführungen, um ihre Position auf dem Markt für akademische Software zu behaupten. Einige Entwicklungen der wichtigsten Akteure auf dem Markt für akademische Software sind:
Im Dezember 2020 führte die Alma-Plattform für Studenteninformationssysteme die Funktion „Notendurchschnitte“ (GPA) ein, die dem Notenbuch-Tool hinzugefügt wurde. Die standardbasierte Benotung (SBG) basiert darauf, das Feedback und die Fortschrittsmessung der Studenten an den jeweiligen Fähigkeiten auszurichten, die gelehrt und bewertet werden, anstatt eine einzige Punktzahl für mehrere Themen oder Standards zu verwenden.
Im Juli 2020 hat ConexED seine iOS-App 2.2.3 für eine benutzerfreundlichere Erfahrung aktualisiert. Mit dieser App können Studierende, Mitarbeiter und Lehrkräfte auf ihren Mobilgeräten an virtuellen Meetings und Videokonferenzen teilnehmen.
Regionale Einblicke in den Markt für akademische Software
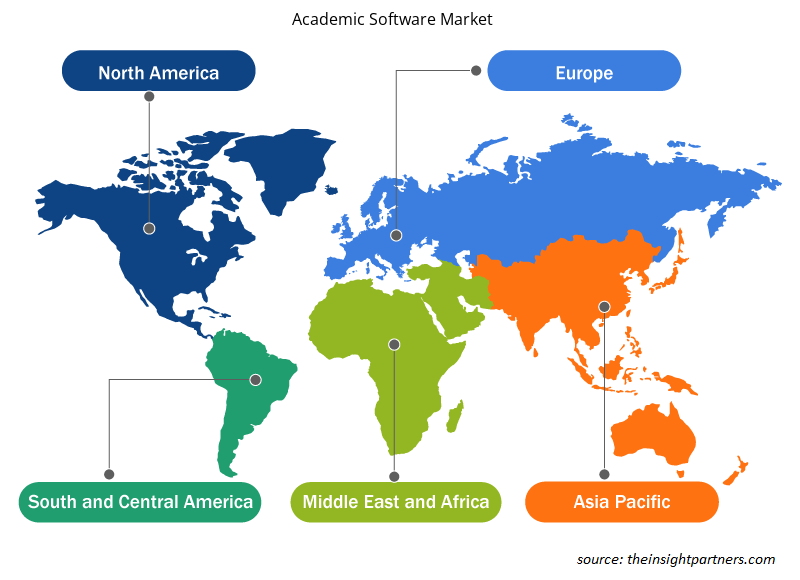
Die regionalen Trends und Faktoren, die den Markt für akademische Software im Prognosezeitraum beeinflussen, wurden von den Analysten von Insight Partners ausführlich erläutert. In diesem Abschnitt werden auch die Marktsegmente und die Geografie von akademischer Software in Nordamerika, Europa, im asiatisch-pazifischen Raum, im Nahen Osten und Afrika sowie in Süd- und Mittelamerika erörtert.

- Erhalten Sie regionale Daten zum Markt für akademische Software
Umfang des Marktberichts für akademische Software
| Berichtsattribut | Details |
|---|---|
| Marktgröße im Jahr 2021 | 797,59 Millionen US-Dollar |
| Marktgröße bis 2027 | 2.007,08 Millionen US-Dollar |
| Globale CAGR (2021 - 2027) | 16,2 % |
| Historische Daten | 2019-2020 |
| Prognosezeitraum | 2022–2027 |
| Abgedeckte Segmente | Nach Bereitstellung
|
| Abgedeckte Regionen und Länder | Nordamerika
|
| Marktführer und wichtige Unternehmensprofile |
|
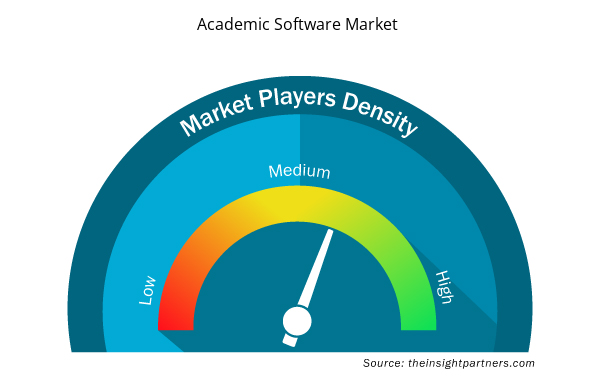
Dichte der Akteure auf dem Markt für akademische Software: Die Auswirkungen auf die Geschäftsdynamik verstehen
Der Markt für akademische Software wächst rasant, angetrieben durch die steigende Nachfrage der Endnutzer aufgrund von Faktoren wie sich entwickelnden Verbraucherpräferenzen, technologischen Fortschritten und einem größeren Bewusstsein für die Vorteile des Produkts. Mit der steigenden Nachfrage erweitern Unternehmen ihr Angebot, entwickeln Innovationen, um die Bedürfnisse der Verbraucher zu erfüllen, und nutzen neue Trends, was das Marktwachstum weiter ankurbelt.
Die Marktteilnehmerdichte bezieht sich auf die Verteilung der Firmen oder Unternehmen, die in einem bestimmten Markt oder einer bestimmten Branche tätig sind. Sie gibt an, wie viele Wettbewerber (Marktteilnehmer) in einem bestimmten Marktraum im Verhältnis zu seiner Größe oder seinem gesamten Marktwert präsent sind.
Die wichtigsten auf dem Markt für akademische Software tätigen Unternehmen sind:
- Alma
- CAMPUS CAFÉ SOFTWARE
- ConexED
- Envisio Solutions Inc.
- VOLLSTÄNDIGER STOFF
Haftungsausschluss : Die oben aufgeführten Unternehmen sind nicht in einer bestimmten Reihenfolge aufgeführt.

- Überblick über die wichtigsten Akteure auf dem Markt für akademische Software
Markt für akademische Software – nach Bereitstellung
- Wolke
- Vor Ort
Markt für akademische Software – nach Anwendung
- Hochschulen und Universitäten
- Bildungsdienstleistungen
- Sonstiges
Markt für akademische Software – nach Geografie
Nordamerika
- UNS
- Kanada
- Mexiko
Europa
- Frankreich
- Deutschland
- Russland
- Vereinigtes Königreich
- Italien
- Restliches Europa
Asien-Pazifik (APAC)
- China
- Indien
- Japan
- Australien
- Südkorea
- Restlicher Asien-Pazifik-Raum
MEA
- Saudi-Arabien
- Vereinigte Arabische Emirate
- Südafrika
- Rest von MEA
SAM
- Brasilien
- Argentinien
- Rest von SAM
Markt für akademische Software – Firmenprofile
- Alma
- CAMPUS CAFÉ SOFTWARE
- ConexED
- Envisio Solutions Inc.
- VOLLSTÄNDIGER STOFF
- PowerVista Software, Inc.
- Qualtrics LLC
- Tophatmonocle Corp
- TrueDialog
- WizeHive
- Historische Analyse (2 Jahre), Basisjahr, Prognose (7 Jahre) mit CAGR
- PEST- und SWOT-Analyse
- Marktgröße Wert/Volumen – Global, Regional, Land
- Branche und Wettbewerbsumfeld
- Excel-Datensatz


Report Coverage
Revenue forecast, Company Analysis, Industry landscape, Growth factors, and Trends

Segment Covered
This text is related
to segments covered.

Regional Scope
North America, Europe, Asia Pacific, Middle East & Africa, South & Central America

Country Scope
This text is related
to country scope.
Häufig gestellte Fragen
Increase in adoption of modern technologies and rapid shift from traditional teaching methodologies to modern teaching techniques are influencing the adoption of academic software solutions across colleges and universities across the globe. Additionally, software packages taken by universities and colleges for a large number of users are also cost efficient for both the institutions and the students. In the private sector, for instance, many software packages that a student wants are very expensive. This is why VIVES University of Applied Sciences has developed a partnership to deliver academic solutions with Signpost. Bulk transaction or software license transactions would substantially lower the cost of all their students' required application. A standard software package is compiled by VIVES on Signpost's Academic Software platform, which consists of hundreds of software titles that must be purchased by any VIVES student as a compulsory learning material, regardless of the education or training process. The same can be installed and used on personal laptops and desktops of students. Thus, increasing initiatives by colleges and universities to install bulk academic solutions for students are contributing to the academic software market growth across the globe.
The software industry is growing at a fast pace in the region as it attracts various technological developments. The US federal government spends ~US$ 79 billion every year on the development of primary and secondary education programs. In addition, the trend of privatizing schools in the US is prevailing which is another aspect that would help in boosting the scope of integrating advanced software in schools. In the 21st century, the education sector is experiencing numerous efforts to privatize educational services which were provided by public agencies & school systems. Privatization is expected to transform the method of running schools and will open up opportunities for integrating new software and technologies to manage operations in educational institutes efficiently.
Artificial intelligence (AI) is a technology that gives computers the ability, in the same way as humans, to communicate with people, understand events, and learn and react to events. Over the years, artificial intelligence not only had huge applications across industries—such as security and surveillance and information technology—but it had also experienced a rise in adoption of the technologies in the education sector. AI is being adopted across schools, colleges, and universities for automating repetitive tasks, such as grading, financial analysis, and admission processes. For example, AI can be calibrated to learn and model teacher actions while grading, through advanced computer programs—such as Automated Grading—for automatic grade assignment in the future. Over time, the program would learn the academic skills of multiple students and, based on their performances, prepare customized training plans.
Trends and growth analysis reports related to Technology, Media and Telecommunications : READ MORE..
The List of Companies - Academic Software Market
- Alma
- CAMPUS CAFÉ SOFTWARE
- ConexED
- Envisio Solutions Inc.
- FULL FABRIC
- PowerVista Software, Inc.
- Qualtrics LLC
- Tophatmonocle Corp
- TrueDialog
- WizeHive
The Insight Partners performs research in 4 major stages: Data Collection & Secondary Research, Primary Research, Data Analysis and Data Triangulation & Final Review.
- Data Collection and Secondary Research:
As a market research and consulting firm operating from a decade, we have published and advised several client across the globe. First step for any study will start with an assessment of currently available data and insights from existing reports. Further, historical and current market information is collected from Investor Presentations, Annual Reports, SEC Filings, etc., and other information related to company’s performance and market positioning are gathered from Paid Databases (Factiva, Hoovers, and Reuters) and various other publications available in public domain.
Several associations trade associates, technical forums, institutes, societies and organization are accessed to gain technical as well as market related insights through their publications such as research papers, blogs and press releases related to the studies are referred to get cues about the market. Further, white papers, journals, magazines, and other news articles published in last 3 years are scrutinized and analyzed to understand the current market trends.
- Primary Research:
The primarily interview analysis comprise of data obtained from industry participants interview and answers to survey questions gathered by in-house primary team.
For primary research, interviews are conducted with industry experts/CEOs/Marketing Managers/VPs/Subject Matter Experts from both demand and supply side to get a 360-degree view of the market. The primary team conducts several interviews based on the complexity of the markets to understand the various market trends and dynamics which makes research more credible and precise.
A typical research interview fulfils the following functions:
- Provides first-hand information on the market size, market trends, growth trends, competitive landscape, and outlook
- Validates and strengthens in-house secondary research findings
- Develops the analysis team’s expertise and market understanding
Primary research involves email interactions and telephone interviews for each market, category, segment, and sub-segment across geographies. The participants who typically take part in such a process include, but are not limited to:
- Industry participants: VPs, business development managers, market intelligence managers and national sales managers
- Outside experts: Valuation experts, research analysts and key opinion leaders specializing in the electronics and semiconductor industry.
Below is the breakup of our primary respondents by company, designation, and region:

Once we receive the confirmation from primary research sources or primary respondents, we finalize the base year market estimation and forecast the data as per the macroeconomic and microeconomic factors assessed during data collection.
- Data Analysis:
Once data is validated through both secondary as well as primary respondents, we finalize the market estimations by hypothesis formulation and factor analysis at regional and country level.
- Macro-Economic Factor Analysis:
We analyse macroeconomic indicators such the gross domestic product (GDP), increase in the demand for goods and services across industries, technological advancement, regional economic growth, governmental policies, the influence of COVID-19, PEST analysis, and other aspects. This analysis aids in setting benchmarks for various nations/regions and approximating market splits. Additionally, the general trend of the aforementioned components aid in determining the market's development possibilities.
- Country Level Data:
Various factors that are especially aligned to the country are taken into account to determine the market size for a certain area and country, including the presence of vendors, such as headquarters and offices, the country's GDP, demand patterns, and industry growth. To comprehend the market dynamics for the nation, a number of growth variables, inhibitors, application areas, and current market trends are researched. The aforementioned elements aid in determining the country's overall market's growth potential.
- Company Profile:
The “Table of Contents” is formulated by listing and analyzing more than 25 - 30 companies operating in the market ecosystem across geographies. However, we profile only 10 companies as a standard practice in our syndicate reports. These 10 companies comprise leading, emerging, and regional players. Nonetheless, our analysis is not restricted to the 10 listed companies, we also analyze other companies present in the market to develop a holistic view and understand the prevailing trends. The “Company Profiles” section in the report covers key facts, business description, products & services, financial information, SWOT analysis, and key developments. The financial information presented is extracted from the annual reports and official documents of the publicly listed companies. Upon collecting the information for the sections of respective companies, we verify them via various primary sources and then compile the data in respective company profiles. The company level information helps us in deriving the base number as well as in forecasting the market size.
- Developing Base Number:
Aggregation of sales statistics (2020-2022) and macro-economic factor, and other secondary and primary research insights are utilized to arrive at base number and related market shares for 2022. The data gaps are identified in this step and relevant market data is analyzed, collected from paid primary interviews or databases. On finalizing the base year market size, forecasts are developed on the basis of macro-economic, industry and market growth factors and company level analysis.
- Data Triangulation and Final Review:
The market findings and base year market size calculations are validated from supply as well as demand side. Demand side validations are based on macro-economic factor analysis and benchmarks for respective regions and countries. In case of supply side validations, revenues of major companies are estimated (in case not available) based on industry benchmark, approximate number of employees, product portfolio, and primary interviews revenues are gathered. Further revenue from target product/service segment is assessed to avoid overshooting of market statistics. In case of heavy deviations between supply and demand side values, all thes steps are repeated to achieve synchronization.
We follow an iterative model, wherein we share our research findings with Subject Matter Experts (SME’s) and Key Opinion Leaders (KOLs) until consensus view of the market is not formulated – this model negates any drastic deviation in the opinions of experts. Only validated and universally acceptable research findings are quoted in our reports.
We have important check points that we use to validate our research findings – which we call – data triangulation, where we validate the information, we generate from secondary sources with primary interviews and then we re-validate with our internal data bases and Subject matter experts. This comprehensive model enables us to deliver high quality, reliable data in shortest possible time.


 Holen Sie sich ein kostenloses Muster für diesen Bericht