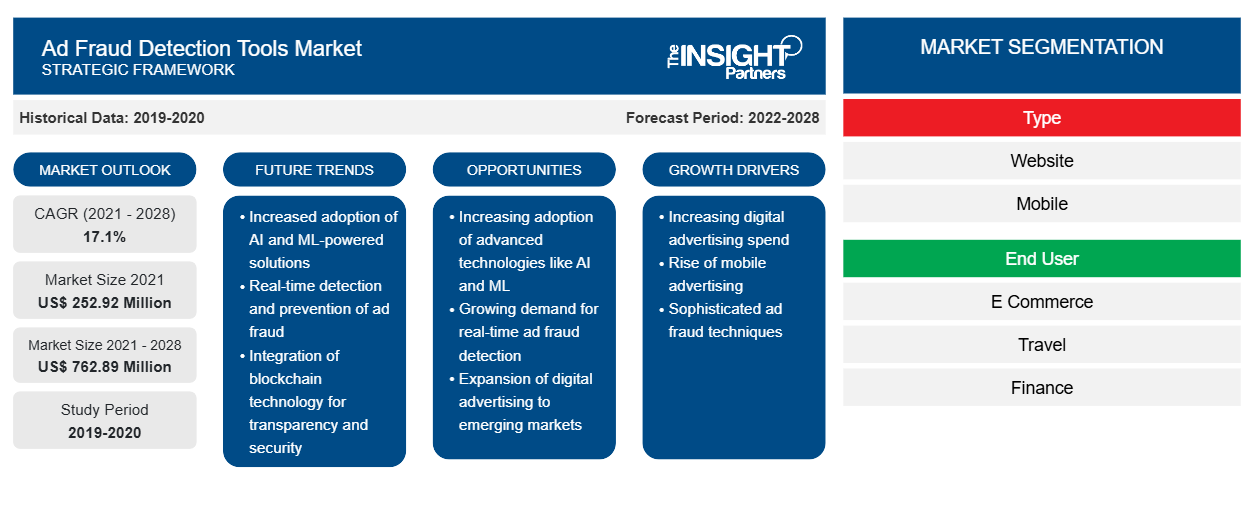
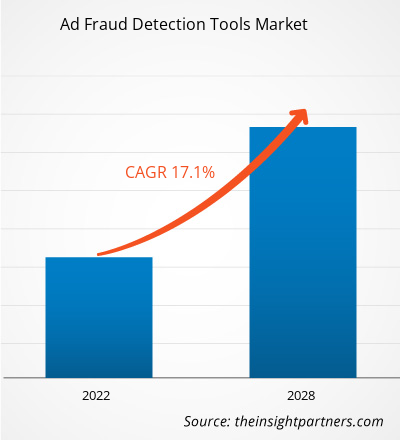
[Forschungsbericht] Der Markt für Tools zur Erkennung von Werbebetrug soll von 252,92 Millionen US-Dollar im Jahr 2021 auf 762,89 Millionen US-Dollar im Jahr 2028 wachsen; für den Zeitraum 2021 bis 2028 wird eine durchschnittliche jährliche Wachstumsrate (CAGR) von 17,1 % geschätzt.
Mit der wachsenden Zahl von Internetnutzern steigt die Nachfrage nach digitaler Werbung aufgrund mehrerer digitaler Werbeplattformen. Digitale Werbung ist heute ausgefeilter, personalisierter und relevanter. Verbraucher verbringen mehr Zeit online als je zuvor, und digitale Werbung bietet eine ideale Möglichkeit, Verbraucher mit mehreren Geräten und mehreren Kanälen zu erreichen. Vermarkter können Verbraucher außerdem mit nie dagewesener Präzision ansprechen. Marken sind nicht mehr nur auf demografische und firmografische Daten beschränkt, sondern können genau die Zielgruppe ansprechen, die am wahrscheinlichsten etwas kauft, basierend auf Tausenden von Segmentierungsvariablen für Lebensstil, Persönlichkeit, Verhalten und Kaufabsicht. Mobile Werbung ist heutzutage der Haupttreiber des Wachstums in der digitalen Werbung und macht laut den Daten der V12-Website über 70 % der digitalen und mehr als ein Viertel der gesamten Medienausgaben aus. Darüber hinaus verbringen Amerikaner über 10 Stunden pro Tag vor Bildschirmen und etwa fünf dieser Stunden auf ihren Smartphones.
Das Aufkommen digitaler Werbung führt zu einem Anstieg des digitalen Werbebetrugs und hat den Unternehmen auch viele Umsatzverluste beschert. So wird beispielsweise geschätzt, dass digitaler Werbebetrug Marken bis 2022 rund 44 Milliarden US-Dollar an betrügerischen Aktivitäten kostet und bis zu 45 % der Gesamtausgaben ausmacht, so die Daten von mFilterIt vom November 2021. Darüber hinaus entwickeln Betrüger kontinuierlich Technologien, um das Ökosystem zu betrügen, während sich Technologieunternehmen ständig weiterentwickeln, um Wege zu finden, diese Betrüger zu stoppen. Um solche Werbebetrügereien bei Marken und Werbetreibenden zu verhindern, bieten Unternehmen wie mFilterIt umfassende Lösungen für digitalen Werbebetrug an. Die Lösung verwendet komplexe Algorithmen, um Oberflächen- und Darknet-Bereiche aktiv zu überwachen und diese dann mithilfe künstlicher Intelligenz und maschinellem Lernen in aussagekräftige und umsetzbare Berichte umzuwandeln, die Markenverwaltern und Community-Eigentümern helfen, die Identität und Privatsphäre ihrer Community-Mitglieder proaktiv vor möglichen Schäden zu schützen. Mit der wachsenden digitalen Werbung nehmen also auch die betrügerischen Aktivitäten im digitalen Werbebereich zu, was den Bedarf an Tools zur Erkennung von Werbebetrug weltweit erhöht.
Passen Sie diesen Bericht Ihren Anforderungen an
Sie erhalten kostenlose Anpassungen an jedem Bericht, einschließlich Teilen dieses Berichts oder einer Analyse auf Länderebene, eines Excel-Datenpakets sowie tolle Angebote und Rabatte für Start-ups und Universitäten.
- Holen Sie sich die wichtigsten Markttrends aus diesem Bericht.Dieses KOSTENLOSE Beispiel umfasst eine Datenanalyse von Markttrends bis hin zu Schätzungen und Prognosen.
Auswirkungen der COVID-19-Pandemie auf den globalen Markt für Tools zur Erkennung von Werbebetrug
Im Jahr 2020 hat die nationale Abriegelung aller Länder im Zuge des COVID-19-Ausbruchs die Marktspanne digitaler Technologien vergrößert. Immer mehr Menschen nutzen heute aus verschiedenen Gründen eine oder mehrere digitale Plattformen, beispielsweise für die Arbeit von zu Hause aus, Online-Transaktionen über die digitalen Apps ihrer Banken oder über mobile/digitale Geldbörsen. Und damit steigt auch der Werbebetrug durch nur einen einzigen Klick. Dies hat zu verschiedenen Umsatzverlusten für das Unternehmen geführt. So zeigen beispielsweise Daten von matchseries.com, dass die weltweiten Verluste durch Werbebetrug im Jahr 2020 insgesamt 35 Milliarden US-Dollar erreichten, während ein im Dezember 2020 veröffentlichter Bericht von Campaign Asia feststellte, dass durch Werbebetrug 20 % der weltweiten Online-Werbeausgaben gestohlen werden. Diese Zahlen veranschaulichen das Ausmaß des Problems, das Werbebetrug für Unternehmen darstellt, und die große Vielfalt an verschiedenen Werbeplattformen und -optionen, die den Unternehmen zur Verfügung stehen, bedeutet, dass das Ausmaß der Verschwendung erheblich variieren kann. Nicht nur KMU fallen einem so großen Maß an betrügerischem Datenverkehr zum Opfer, auch viele der größten Unternehmen der Welt sind betroffen. Aus diesem Grund wurden auch Tools zur Erkennung von Werbebetrug von mehr Unternehmen eingesetzt. Somit verzeichnete der globale Markt für Tools zur Erkennung von Werbebetrug im Jahr 2020 ein positives Wachstum.
Markteinblicke zu Tools zur Anzeigenbetrugserkennung
Zunehmender Einsatz von KI und ML zur Förderung des Marktes für Tools zur Erkennung von Werbebetrug im Prognosezeitraum
Der Einsatz künstlicher Intelligenz (KI) und maschinellen Lernens (ML) hilft dank seiner Selbstlernfähigkeiten dabei, die neuesten Arten von Werbebetrug zu bekämpfen. Ein KI-gestütztes Betrugserkennungssystem folgt einem ML-Algorithmus, der dem System hilft, aus verdächtigen Aktivitäten (Klicks, Anzeigenplatzierungen) zu lernen und Schutzebenen aufzubauen. Diese Art von System verbessert und passt sich nicht nur selbst an, um die neuesten Arten von Werbebetrug zu bekämpfen, sondern kann auch Muster in einem viel umfangreicheren Satz von Datenpunkten erkennen als herkömmliche Systeme. Im Durchschnitt kann ein KI-basiertes (ML) Betrugserkennungssystem mehr als 80 Dimensionen gleichzeitig analysieren und selbst die raffiniertesten Werbebetrügereien erkennen, wie beispielsweise den Methbot-Werbebetrug.
Markt für Tools zur Erkennung von Werbebetrug – typbasierte Markteinblicke
Der Markt für Tools zur Erkennung von Werbebetrug ist nach Typ in Website und Mobilgeräte unterteilt. Im Jahr 2021 war das Mobilsegment führend auf dem Markt für Tools zur Erkennung von Werbebetrug und hatte einen größeren Marktanteil.
Markt für Tools zur Erkennung von Werbebetrug – Endbenutzerbasierte Markteinblicke
Basierend auf dem Endbenutzer ist der Markt für Tools zur Erkennung von Werbebetrug in E-Commerce, Reisen, Finanzen, Gaming und andere segmentiert. Im Jahr 2021 war das Finanzsegment führend auf dem Markt für Tools zur Erkennung von Werbebetrug und hatte den größten Marktanteil.
Akteure auf dem Markt für Tools zur Erkennung von Werbebetrug verfolgen Strategien wie Fusionen, Übernahmen und Marktinitiativen, um ihre Position auf dem Markt zu behaupten. Nachfolgend sind einige Entwicklungen der wichtigsten Akteure aufgeführt:
- Im Februar 2021 wurde die Adjust GmbH von der Applovin Corporation übernommen. Diese Übernahme bietet erstklassige Lösungen in einem einzigen Paket und macht Mess-, Analyse-, Wachstums- und Monetarisierungslösungen für jeden App-Entwickler auf der ganzen Welt leicht zugänglich.
- Im Februar 2020 erzielte App Samurai Inc. (mobile Wachstumsplattform) eine Investition von 2,4 Millionen US-Dollar in einer von 212 Ventures geleiteten Finanzierungsrunde, darunter Collective Spark, 500 Startups und Degerhan Usluel, wodurch sich die Gesamtinvestition auf 4,6 Millionen US-Dollar beläuft. App Samurai wird die Finanzierung nutzen, um sein Produktportfolio zu entwickeln und an der globalen Expansion zu arbeiten.
Regionale Einblicke in den Markt für Tools zur Anzeigenbetrugserkennung
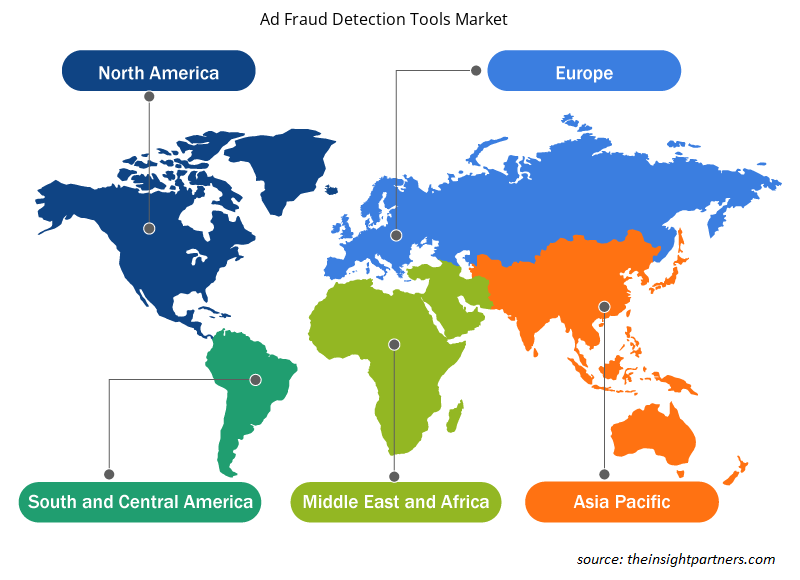
Die regionalen Trends und Faktoren, die den Markt für Tools zur Erkennung von Werbebetrug im Prognosezeitraum beeinflussen, wurden von den Analysten von Insight Partners ausführlich erläutert. In diesem Abschnitt werden auch die Marktsegmente und die Geografie von Tools zur Erkennung von Werbebetrug in Nordamerika, Europa, im asiatisch-pazifischen Raum, im Nahen Osten und Afrika sowie in Süd- und Mittelamerika erörtert.

- Erhalten Sie regionale Daten zum Markt für Tools zur Erkennung von Werbebetrug
Umfang des Marktberichts zu Tools zur Erkennung von Anzeigenbetrug
| Berichtsattribut | Details |
|---|---|
| Marktgröße im Jahr 2021 | 252,92 Millionen US-Dollar |
| Marktgröße bis 2028 | 762,89 Millionen US-Dollar |
| Globale CAGR (2021 - 2028) | 17,1 % |
| Historische Daten | 2019-2020 |
| Prognosezeitraum | 2022–2028 |
| Abgedeckte Segmente | Nach Typ
|
| Abgedeckte Regionen und Länder | Nordamerika
|
| Marktführer und wichtige Unternehmensprofile |
|
Dichte der Marktteilnehmer bei Tools zur Erkennung von Werbebetrug: Die Auswirkungen auf die Geschäftsdynamik verstehen
Der Markt für Tools zur Erkennung von Werbebetrug wächst rasant. Dies wird durch die steigende Nachfrage der Endnutzer aufgrund von Faktoren wie sich entwickelnden Verbraucherpräferenzen, technologischen Fortschritten und einem größeren Bewusstsein für die Vorteile des Produkts vorangetrieben. Mit der steigenden Nachfrage erweitern Unternehmen ihr Angebot, entwickeln Innovationen, um die Bedürfnisse der Verbraucher zu erfüllen, und nutzen neue Trends, was das Marktwachstum weiter ankurbelt.
Die Marktteilnehmerdichte bezieht sich auf die Verteilung der Firmen oder Unternehmen, die in einem bestimmten Markt oder einer bestimmten Branche tätig sind. Sie gibt an, wie viele Wettbewerber (Marktteilnehmer) in einem bestimmten Marktraum im Verhältnis zu seiner Größe oder seinem gesamten Marktwert präsent sind.
Die wichtigsten Unternehmen auf dem Markt für Tools zur Erkennung von Werbebetrug sind:
- AppsFlyer Ltd.
- Adjust GmbH
- Branch Metrics, Inc.
- FraudScore
- Interceptd (App Samurai Inc.)
Haftungsausschluss : Die oben aufgeführten Unternehmen sind nicht in einer bestimmten Reihenfolge aufgeführt.

- Überblick über die wichtigsten Akteure auf dem Markt für Tools zur Anzeigenbetrugserkennung
Firmenprofile
- AppsFlyer Ltd.
- Adjust GmbH
- Branch Metrics, Inc.
- FraudScore
- Interceptd (App Samurai Inc.)
- Maschinenwerbung GmbH
- Führen Sie [cb], LLC durch
- Scalarr Inc.
- Singular Labs, Inc.
- TrafficGuard Pty Ltd
- ADEX (Samoukale Enterprises Limited)
- Historische Analyse (2 Jahre), Basisjahr, Prognose (7 Jahre) mit CAGR
- PEST- und SWOT-Analyse
- Marktgröße Wert/Volumen – Global, Regional, Land
- Branche und Wettbewerbsumfeld
- Excel-Datensatz


- Molecular Diagnostics Market
- Tortilla Market
- Dry Eye Products Market
- Industrial Inkjet Printers Market
- Vertical Farming Crops Market
- Medical and Research Grade Collagen Market
- Semiconductor Metrology and Inspection Market
- Microcatheters Market
- Space Situational Awareness (SSA) Market
- Flexible Garden Hoses Market

Report Coverage
Revenue forecast, Company Analysis, Industry landscape, Growth factors, and Trends

Segment Covered
This text is related
to segments covered.

Regional Scope
North America, Europe, Asia Pacific, Middle East & Africa, South & Central America

Country Scope
This text is related
to country scope.
Häufig gestellte Fragen
Growth in Managing & Monitoring Advertising Campaigns
Surge in Digital Advertisement
Ad fraud detection tools are increasingly adopted by SMEs due to the growing number of small and medium businesses are shifting focus toward online marketing, such as social media marketing. Fraudsters are seeing an influx of new and often unaware digital properties as prey, with more small-to-medium enterprises (SMEs) shifting marketing efforts toward digital platforms. Further, the number of start-ups is increasing across the globe. Therefore, the rising number of SMEs across the globe focusing toward online marketing creates a lucrative opportunity for ad fraud detection tools market players..
On the basis of type, the ad fraud detection tools market is segmented into website and mobile. Ad frauds are the act of generating revenue using fraudulent digital advertising techniques. Usually, this is categorized into two broad terms: desktop (website) and mobile ad frauds. With an increasing number of mobile users globally and less protection on mobile devices, fraudulent activities are more observed on mobile devices. And with larger mobile ad fraud detection & prevention tools, the mobile segment dominates the market.
Key companies in the ad fraud detection tools market include Adjust GmbH; AppsFlyer Ltd.; Branch Metrics, Inc.; FraudScore; Interceptd (App Samurai Inc.); Machine Advertising Limited; Perform[cb], LLC; Scalarr Inc.; Singular Labs, Inc.; TrafficGuard Pty Ltd; and ADEX (Samoukale Enterprises Limited).
The usage of artificial intelligence (AI) and machine learning (ML) helps tackle the latest kinds of ad frauds due to self-learning capabilities. AI-powered fraud detection system follows a ML algorithm that helps the system learn from suspicious activities (clicks, ad placements) and builds layers of protection.
North America held the largest market share in year 2020, along with the notable revenue generation opportunities in Europe and APAC.
Trends and growth analysis reports related to Technology, Media and Telecommunications : READ MORE..
The List of Companies - Ad Fraud Detection Tools Market
- AppsFlyer Ltd.
- Adjust GmbH
- Branch Metrics, Inc.
- FraudScore
- Interceptd (App Samurai Inc.)
- Machine Advertising Limited
- Perform[cb], LLC
- Scalarr Inc.
- Singular Labs, Inc.
- TrafficGuard Pty Ltd
- ADEX (Samoukale Enterprises Limited)
The Insight Partners performs research in 4 major stages: Data Collection & Secondary Research, Primary Research, Data Analysis and Data Triangulation & Final Review.
- Data Collection and Secondary Research:
As a market research and consulting firm operating from a decade, we have published and advised several client across the globe. First step for any study will start with an assessment of currently available data and insights from existing reports. Further, historical and current market information is collected from Investor Presentations, Annual Reports, SEC Filings, etc., and other information related to company’s performance and market positioning are gathered from Paid Databases (Factiva, Hoovers, and Reuters) and various other publications available in public domain.
Several associations trade associates, technical forums, institutes, societies and organization are accessed to gain technical as well as market related insights through their publications such as research papers, blogs and press releases related to the studies are referred to get cues about the market. Further, white papers, journals, magazines, and other news articles published in last 3 years are scrutinized and analyzed to understand the current market trends.
- Primary Research:
The primarily interview analysis comprise of data obtained from industry participants interview and answers to survey questions gathered by in-house primary team.
For primary research, interviews are conducted with industry experts/CEOs/Marketing Managers/VPs/Subject Matter Experts from both demand and supply side to get a 360-degree view of the market. The primary team conducts several interviews based on the complexity of the markets to understand the various market trends and dynamics which makes research more credible and precise.
A typical research interview fulfils the following functions:
- Provides first-hand information on the market size, market trends, growth trends, competitive landscape, and outlook
- Validates and strengthens in-house secondary research findings
- Develops the analysis team’s expertise and market understanding
Primary research involves email interactions and telephone interviews for each market, category, segment, and sub-segment across geographies. The participants who typically take part in such a process include, but are not limited to:
- Industry participants: VPs, business development managers, market intelligence managers and national sales managers
- Outside experts: Valuation experts, research analysts and key opinion leaders specializing in the electronics and semiconductor industry.
Below is the breakup of our primary respondents by company, designation, and region:

Once we receive the confirmation from primary research sources or primary respondents, we finalize the base year market estimation and forecast the data as per the macroeconomic and microeconomic factors assessed during data collection.
- Data Analysis:
Once data is validated through both secondary as well as primary respondents, we finalize the market estimations by hypothesis formulation and factor analysis at regional and country level.
- Macro-Economic Factor Analysis:
We analyse macroeconomic indicators such the gross domestic product (GDP), increase in the demand for goods and services across industries, technological advancement, regional economic growth, governmental policies, the influence of COVID-19, PEST analysis, and other aspects. This analysis aids in setting benchmarks for various nations/regions and approximating market splits. Additionally, the general trend of the aforementioned components aid in determining the market's development possibilities.
- Country Level Data:
Various factors that are especially aligned to the country are taken into account to determine the market size for a certain area and country, including the presence of vendors, such as headquarters and offices, the country's GDP, demand patterns, and industry growth. To comprehend the market dynamics for the nation, a number of growth variables, inhibitors, application areas, and current market trends are researched. The aforementioned elements aid in determining the country's overall market's growth potential.
- Company Profile:
The “Table of Contents” is formulated by listing and analyzing more than 25 - 30 companies operating in the market ecosystem across geographies. However, we profile only 10 companies as a standard practice in our syndicate reports. These 10 companies comprise leading, emerging, and regional players. Nonetheless, our analysis is not restricted to the 10 listed companies, we also analyze other companies present in the market to develop a holistic view and understand the prevailing trends. The “Company Profiles” section in the report covers key facts, business description, products & services, financial information, SWOT analysis, and key developments. The financial information presented is extracted from the annual reports and official documents of the publicly listed companies. Upon collecting the information for the sections of respective companies, we verify them via various primary sources and then compile the data in respective company profiles. The company level information helps us in deriving the base number as well as in forecasting the market size.
- Developing Base Number:
Aggregation of sales statistics (2020-2022) and macro-economic factor, and other secondary and primary research insights are utilized to arrive at base number and related market shares for 2022. The data gaps are identified in this step and relevant market data is analyzed, collected from paid primary interviews or databases. On finalizing the base year market size, forecasts are developed on the basis of macro-economic, industry and market growth factors and company level analysis.
- Data Triangulation and Final Review:
The market findings and base year market size calculations are validated from supply as well as demand side. Demand side validations are based on macro-economic factor analysis and benchmarks for respective regions and countries. In case of supply side validations, revenues of major companies are estimated (in case not available) based on industry benchmark, approximate number of employees, product portfolio, and primary interviews revenues are gathered. Further revenue from target product/service segment is assessed to avoid overshooting of market statistics. In case of heavy deviations between supply and demand side values, all thes steps are repeated to achieve synchronization.
We follow an iterative model, wherein we share our research findings with Subject Matter Experts (SME’s) and Key Opinion Leaders (KOLs) until consensus view of the market is not formulated – this model negates any drastic deviation in the opinions of experts. Only validated and universally acceptable research findings are quoted in our reports.
We have important check points that we use to validate our research findings – which we call – data triangulation, where we validate the information, we generate from secondary sources with primary interviews and then we re-validate with our internal data bases and Subject matter experts. This comprehensive model enables us to deliver high quality, reliable data in shortest possible time.


 Holen Sie sich ein kostenloses Muster für diesen Bericht