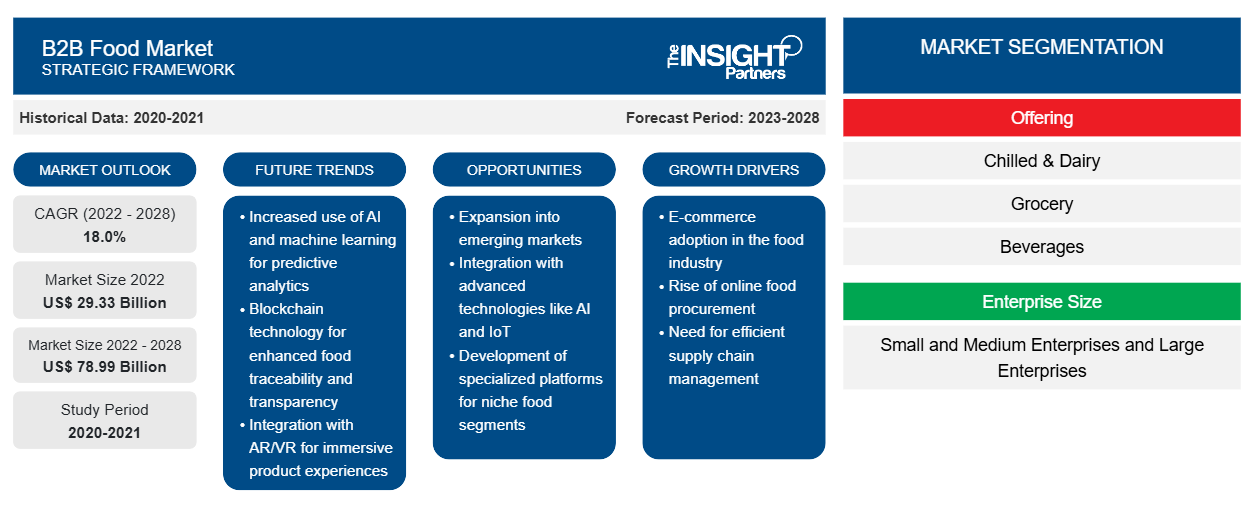
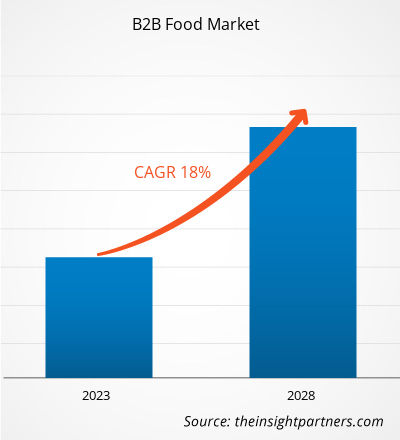
Der Markt für B2B-Lebensmittelmarktplatzplattformen soll von 29.326,79 Millionen US-Dollar im Jahr 2022 auf 78.988,62 Millionen US-Dollar im Jahr 2028 wachsen; von 2022 bis 2028 wird mit einer durchschnittlichen jährlichen Wachstumsrate von 18,0 % gerechnet.
B2B-Lebensmittelmarktplatzplattformen verbinden Käufer und Verkäufer auf der ganzen Welt. Die Verkäufer auf diesen Plattformen können Produzenten oder Händler sein, während die Käufer Einzelhändler, Händler und Akteure der Lebensmittelbranche wie Restaurants, Hotels und Kantinen sein können. Diese Plattformen werden für den Handel mit verarbeiteten und unverarbeiteten Lebensmitteln verwendet. Der Markt für B2B-Lebensmittelmarktplatzplattformen erlebt ein erhebliches Wachstum aufgrund der Verbreitung von Smartphones und Tablets, die eine bessere Kommunikation zwischen KMU und Käufern ermöglichen. Darüber hinaus treibt die vertraglich vereinbarte Preisgestaltung der Produkte das Wachstum des Marktes für B2B-Lebensmittelmarktplatzplattformen an. Die zunehmende Akzeptanz verpackter Lebensmittelprodukte, die wachsende Lebensmittelbranche aufgrund steigender verfügbarer Einkommen und der zunehmenden Neigung zu einem modernen Lebensstil sowie die florierende Offshore-Industrie für erneuerbare Energien werden das Wachstum des Marktes für B2B-Lebensmittelmarktplatzplattformen in den kommenden Jahren wahrscheinlich weiter vorantreiben. Die COVID-19-Pandemie hat sich positiv auf das Wachstum des Marktes für B2B-Lebensmittelmarktplatzplattformen ausgewirkt, da sich Käufer und Verkäufer für digitale Lösungen für ihren Geschäftsbetrieb entscheiden.
Zulieferfirmen locken Kunden, indem sie Rabatte oder Sonderangebote auf ihre Produkte oder bei Abnahme einer bestimmten Menge gewähren. Lieferanten und Unternehmen treffen häufig unternehmensweite Preisvereinbarungen, und der Marktpreis eines bestimmten Artikels wird konstant gehalten. Auch im B2B-Lebensmittelsektor wird Preistransparenz gewahrt. Diese Dynamik kommt in der Regel den Lieferanten zugute, die eine Preisdiskriminierungsstrategie basierend auf der Zahlungsfähigkeit und -bereitschaft der Kunden verfolgen können. eFoodChoice.com beispielsweise ist ein B2B-Onlineplattformunternehmen für Lebensmittel, das internationalen Lebensmittelverkäufern und -käufern hilft, ihre Vertriebskanäle zu erweitern, ihr Onlinegeschäft international auszubauen und ihre Rentabilität nachhaltig zu steigern. Abhängig von der Warenmenge bietet das Unternehmen den Käufern eine exklusive Preisspanne. Das Unternehmen hat auch Mindestbestellmengen ( MOQs ) für jede Produktkategorie festgelegt. Mit einer solchen vertraglich vereinbarten Preisgestaltung der Produkte können Endverbraucher die optimale Anzahl an Waren zu einem fairen Preis auswählen, was die Nachfrage nach B2B-Lebensmittelmarktplätzen anregt.
Passen Sie diesen Bericht Ihren Anforderungen an
Sie erhalten kostenlos individuelle Anpassungen an jedem Bericht, einschließlich Teilen dieses Berichts oder einer Analyse auf Länderebene, eines Excel-Datenpakets sowie tolle Angebote und Rabatte für Start-ups und Universitäten.
- Holen Sie sich die wichtigsten Markttrends aus diesem Bericht.Dieses KOSTENLOSE Beispiel umfasst eine Datenanalyse von Markttrends bis hin zu Schätzungen und Prognosen.
Auswirkungen der COVID-19-Pandemie auf den B2B-Marktplatz für Lebensmittelplattformen in Asien-Pazifik
Die COVID-19-Pandemie hat die APAC -Länder aufgrund ihrer hohen Bevölkerungsdichte schwer getroffen , was das Risiko einer Verbreitung von SARS-CoV-2 erhöht hat. Nach Angaben der Organisation für wirtschaftliche Zusammenarbeit und Entwicklung ( OECD ) waren 2020 große Volkswirtschaften wie China, Indien, Australien und Japan von der Pandemie betroffen, die derzeit unter Inflation leiden. Die von den Regierungen der APAC -Länder verhängten Beschränkungen zur Eindämmung der Verbreitung von COVID-19 wirkten sich negativ auf die Lebensmittel- und Getränkeindustrie aus. Die Schließung von Hotels, Restaurants und Cateringunternehmen verringerte die Nutzung von B2B-Lebensmittelmarktplatzplattformen in der Wirtschaft im Asien-Pazifik-Raum, da Online-Lieferungen aufgrund des Lockdowns eingeschränkt waren . Im dritten Quartal 2020 nahmen Hotels, Restaurants und Cateringunternehmen ihren Betrieb jedoch wieder auf und es wird erwartet, dass dieser in den kommenden Jahren wächst. Darüber hinaus wird der zunehmende Tourismus zum Wachstum der Gastronomie in der Region führen, was das Wachstum des Marktes für B2B-Lebensmittelmarktplatzplattformen im Prognosezeitraum weiter ankurbeln wird.
Markteinblicke – B2B-Lebensmittelmarktplatz-Plattformmarkt
Zunehmende Nutzung von E-Commerce-Plattformen steigert Nachfrage nach B2B-Lebensmittelmarktplatzplattformen
Der Anstieg der Online-Käufe ist auf die wachsende Zahl von Online-Händlern und virtuellen Marktplätzen weltweit zurückzuführen. Kleine Unternehmen, C-Stores und E-Commerce-Unternehmen konzentrieren sich zunehmend auf anspruchsvolle Lösungen wie Marktplatzplattformen. Diese Plattformen unterstützen die effiziente und effektive Verwaltung und Kontrolle ihrer Abläufe und Prozesse. Darüber hinaus begünstigen die zunehmende Betonung der Digitalisierung durch stationäre Einzelhändler, Lebensmittelgeschäfte und Start-up-Unternehmen sowie die steigenden Umsätze aus dem Online-Verkauf die Expansion des B2B-Marktplatzplattformmarkts für Lebensmittel in den USA. Der Abbau grenzüberschreitender Handelsbarrieren weltweit bietet Verkäufern und Unternehmen, insbesondere in den USA, erhebliche Möglichkeiten, ihre Produktreichweite international auszuweiten. E-Commerce-Unternehmen, Einkaufszentren und andere Unternehmen wie kleine Läden und Geschäfte wenden sich Online-Marktplätzen zu, um ihre Produkte zu verkaufen, was das Wachstum des B2B-Marktplatzplattformmarkts für Lebensmittel ankurbelt.
Markteinblicke basierend auf Lebensmittelkategorien
Basierend auf der Lebensmittelkategorie ist der Markt für B2B-Lebensmittelmarktplätze in gekühlte Produkte und Milchprodukte, Lebensmittel, Getränke und Sonstiges unterteilt. Das Lebensmittelsegment hatte 2021 den größten Marktanteil. Was die Lebensmittelkategorie betrifft, sind Lebensmittel in allen Teilen der Welt sehr gefragt. Mit der steigenden Bevölkerung ist die Nachfrage danach erheblich gestiegen. Die wachsende Nachfrage nach Reis, Getreide, Mehl und Stärke, Instant-Lebensmitteln und Fertiggerichten treibt den Markt für das Lebensmittelsegment an. Die wachsende junge Bevölkerung und der sich ändernde Lebensstil führen zu einer enormen Nachfrage nach Instant-Lebensmitteln und Fertiggerichten. Dieser Faktor wird voraussichtlich das Wachstum des B2B-Lebensmittelmarktplatzes in den kommenden Jahren ankurbeln. Darüber hinaus wächst auch die Nachfrage nach anderen Lebensmitteln wie Bio-Produkten, Lebensmittelzutaten, Ölen, Nüssen, Kräutern, Saucen, Gewürzen, Samen sowie Süßungsmitteln und Honigprodukten, was zu dem dominierenden Anteil des Segments am B2B-Lebensmittelmarktplatz führt.
B2B Lebensmittel
Regionale Einblicke in den B2B-Marktplatz für Lebensmittel
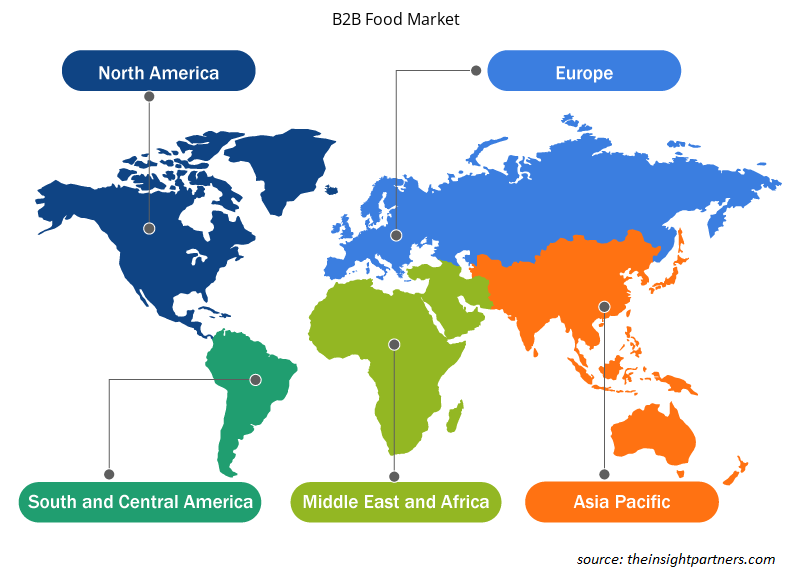
Die regionalen Trends und Faktoren, die den B2B-Marktplatz für Lebensmittel im Prognosezeitraum beeinflussen, wurden von den Analysten von Insight Partners ausführlich erläutert. In diesem Abschnitt werden auch die Marktsegmente und die Geografie des B2B-Marktplatzes für Lebensmittel in Nordamerika, Europa, im asiatisch-pazifischen Raum, im Nahen Osten und Afrika sowie in Süd- und Mittelamerika erörtert.

- Erhalten Sie regionalspezifische Daten zum B2B-Marktplatz für Lebensmittel
Umfang des Marktberichts zur B2B-Lebensmittelmarktplatzplattform
| Berichtsattribut | Details |
|---|---|
| Marktgröße im Jahr 2022 | 29,33 Milliarden US-Dollar |
| Marktgröße bis 2028 | 78,99 Milliarden US-Dollar |
| Globale CAGR (2022 - 2028) | 18,0 % |
| Historische Daten | 2020-2021 |
| Prognosezeitraum | 2023–2028 |
| Abgedeckte Segmente | Durch das Angebot
|
| Abgedeckte Regionen und Länder | Nordamerika
|
| Marktführer und wichtige Unternehmensprofile |
|
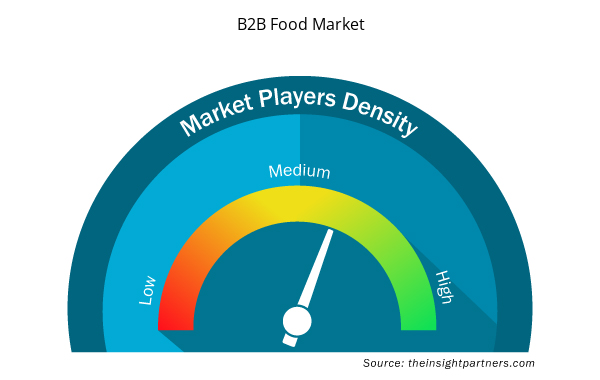
Dichte der Marktteilnehmer auf B2B-Lebensmittelmarktplätzen: Auswirkungen auf die Geschäftsdynamik verstehen
Der Markt für B2B-Lebensmittelmarktplatzplattformen wächst rasant, angetrieben von der steigenden Endverbrauchernachfrage aufgrund von Faktoren wie sich entwickelnden Verbraucherpräferenzen, technologischen Fortschritten und einem größeren Bewusstsein für die Vorteile des Produkts. Mit steigender Nachfrage erweitern Unternehmen ihr Angebot, entwickeln Innovationen, um die Bedürfnisse der Verbraucher zu erfüllen, und nutzen neue Trends, was das Marktwachstum weiter ankurbelt.
Die Marktteilnehmerdichte bezieht sich auf die Verteilung von Firmen oder Unternehmen, die in einem bestimmten Markt oder einer bestimmten Branche tätig sind. Sie gibt an, wie viele Wettbewerber (Marktteilnehmer) in einem bestimmten Marktraum im Verhältnis zu seiner Größe oder seinem gesamten Marktwert präsent sind.
Die wichtigsten Unternehmen, die auf dem Markt für B2B-Lebensmittelmarktplätze tätig sind, sind:
- LebensmittelMaven
- Amazonas
- eFoodChoice.com
- Cheetah Technologies Inc.
- Eworldtrade.com
Haftungsausschluss : Die oben aufgeführten Unternehmen sind nicht in einer bestimmten Reihenfolge aufgeführt.

- Überblick über die wichtigsten Akteure auf dem B2B-Lebensmittelmarktplatz
Die Akteure auf dem Markt für B2B-Lebensmittelmarktplätze konzentrieren sich hauptsächlich auf die Entwicklung fortschrittlicher und effizienter Produkte.
- Im Jahr 2022 schloss Cheetah eine Finanzierungsrunde der Serie C in Höhe von insgesamt 60 Millionen US-Dollar ab und gab den Abschluss von drei Übernahmetransaktionen mit Palo Alto Foods, Esteson und Joseph Martin Foods bekannt.
- Im Jahr 2022 hat Pod Foods Pod Foods Capital auf den Markt gebracht, ein Finanzierungsinstrument, das aufstrebenden Marken einfachen und erschwinglichen Zugang zu Kapital ermöglicht, um das Wachstum ihrer Marke zu unterstützen.
Zu den wichtigsten Akteuren auf dem Markt für B2B-Lebensmittelmarktplatzplattformen gehören FoodMaven, Amazon, eFoodChoice.com, Cheetah technologies Inc., Eworldtrade.com, FoodsTrade, Ufoodin, Pod foods Co., Emerge Srl und Notch.
- Historische Analyse (2 Jahre), Basisjahr, Prognose (7 Jahre) mit CAGR
- PEST- und SWOT-Analyse
- Marktgröße Wert/Volumen – Global, Regional, Land
- Branche und Wettbewerbsumfeld
- Excel-Datensatz


- Small Internal Combustion Engine Market
- UV Curing System Market
- Oxy-fuel Combustion Technology Market
- Toothpaste Market
- Green Hydrogen Market
- Single-Use Negative Pressure Wound Therapy Devices Market
- Intradermal Injection Market
- Antibiotics Market
- Artificial Turf Market
- Trade Promotion Management Software Market

Report Coverage
Revenue forecast, Company Analysis, Industry landscape, Growth factors, and Trends

Segment Covered
This text is related
to segments covered.

Regional Scope
North America, Europe, Asia Pacific, Middle East & Africa, South & Central America

Country Scope
This text is related
to country scope.
Häufig gestellte Fragen
The global market size of B2B food marketplace platform market by 2028 will be around US$ 78,988.62 million
The China holds a major market share of B2B food marketplace platform market in 2022
The estimated global market size for the B2B food marketplace platform market in 2022 is expected to be around US$ 29,326.79 million
The factors such as better communications between SMEs and buyers due to smartphones and tablets and contract-based pricing of products are contributing to the growth of the market
Thailand, Malaysia and Mexico register high growth rate during the forecast period
An increase in online purchasing is attributed to the growing number of online retailers and virtual marketplaces across the world. Small enterprises, c-stores, and e-commerce corporations are increasingly focusing on sophisticated solutions such as marketplace platforms. E-commerce companies, shopping malls, and other businesses, such as small stores and shops, are turning to online marketplaces to sell their products, which is boosting the B2B food marketplace platform industry.
Grocery segment is expected to hold a major market share of B2B food marketplace platform market in 2022
Asia Pacific is expected to register highest CAGR in the B2B food marketplace platform market during the forecast period (2022-2028)
FoodMaven; Amazon; eFoodChoice.com; Cheetah technologies Inc.; and Eworldtrade.com are the key market players expected to hold a major market share of B2B food marketplace platform market in 2022
Trends and growth analysis reports related to Technology, Media and Telecommunications : READ MORE..
The List of Companies - B2B Food Marketplace Platform Market
- FoodMaven
- Amazon
- eFoodChoice.com
- Cheetah technologies Inc.
- Eworldtrade.com
- FoodsTrade
- Ufoodin
- Pod foods Co.
- Emerge Srl
- Notch
The Insight Partners performs research in 4 major stages: Data Collection & Secondary Research, Primary Research, Data Analysis and Data Triangulation & Final Review.
- Data Collection and Secondary Research:
As a market research and consulting firm operating from a decade, we have published and advised several client across the globe. First step for any study will start with an assessment of currently available data and insights from existing reports. Further, historical and current market information is collected from Investor Presentations, Annual Reports, SEC Filings, etc., and other information related to company’s performance and market positioning are gathered from Paid Databases (Factiva, Hoovers, and Reuters) and various other publications available in public domain.
Several associations trade associates, technical forums, institutes, societies and organization are accessed to gain technical as well as market related insights through their publications such as research papers, blogs and press releases related to the studies are referred to get cues about the market. Further, white papers, journals, magazines, and other news articles published in last 3 years are scrutinized and analyzed to understand the current market trends.
- Primary Research:
The primarily interview analysis comprise of data obtained from industry participants interview and answers to survey questions gathered by in-house primary team.
For primary research, interviews are conducted with industry experts/CEOs/Marketing Managers/VPs/Subject Matter Experts from both demand and supply side to get a 360-degree view of the market. The primary team conducts several interviews based on the complexity of the markets to understand the various market trends and dynamics which makes research more credible and precise.
A typical research interview fulfils the following functions:
- Provides first-hand information on the market size, market trends, growth trends, competitive landscape, and outlook
- Validates and strengthens in-house secondary research findings
- Develops the analysis team’s expertise and market understanding
Primary research involves email interactions and telephone interviews for each market, category, segment, and sub-segment across geographies. The participants who typically take part in such a process include, but are not limited to:
- Industry participants: VPs, business development managers, market intelligence managers and national sales managers
- Outside experts: Valuation experts, research analysts and key opinion leaders specializing in the electronics and semiconductor industry.
Below is the breakup of our primary respondents by company, designation, and region:

Once we receive the confirmation from primary research sources or primary respondents, we finalize the base year market estimation and forecast the data as per the macroeconomic and microeconomic factors assessed during data collection.
- Data Analysis:
Once data is validated through both secondary as well as primary respondents, we finalize the market estimations by hypothesis formulation and factor analysis at regional and country level.
- Macro-Economic Factor Analysis:
We analyse macroeconomic indicators such the gross domestic product (GDP), increase in the demand for goods and services across industries, technological advancement, regional economic growth, governmental policies, the influence of COVID-19, PEST analysis, and other aspects. This analysis aids in setting benchmarks for various nations/regions and approximating market splits. Additionally, the general trend of the aforementioned components aid in determining the market's development possibilities.
- Country Level Data:
Various factors that are especially aligned to the country are taken into account to determine the market size for a certain area and country, including the presence of vendors, such as headquarters and offices, the country's GDP, demand patterns, and industry growth. To comprehend the market dynamics for the nation, a number of growth variables, inhibitors, application areas, and current market trends are researched. The aforementioned elements aid in determining the country's overall market's growth potential.
- Company Profile:
The “Table of Contents” is formulated by listing and analyzing more than 25 - 30 companies operating in the market ecosystem across geographies. However, we profile only 10 companies as a standard practice in our syndicate reports. These 10 companies comprise leading, emerging, and regional players. Nonetheless, our analysis is not restricted to the 10 listed companies, we also analyze other companies present in the market to develop a holistic view and understand the prevailing trends. The “Company Profiles” section in the report covers key facts, business description, products & services, financial information, SWOT analysis, and key developments. The financial information presented is extracted from the annual reports and official documents of the publicly listed companies. Upon collecting the information for the sections of respective companies, we verify them via various primary sources and then compile the data in respective company profiles. The company level information helps us in deriving the base number as well as in forecasting the market size.
- Developing Base Number:
Aggregation of sales statistics (2020-2022) and macro-economic factor, and other secondary and primary research insights are utilized to arrive at base number and related market shares for 2022. The data gaps are identified in this step and relevant market data is analyzed, collected from paid primary interviews or databases. On finalizing the base year market size, forecasts are developed on the basis of macro-economic, industry and market growth factors and company level analysis.
- Data Triangulation and Final Review:
The market findings and base year market size calculations are validated from supply as well as demand side. Demand side validations are based on macro-economic factor analysis and benchmarks for respective regions and countries. In case of supply side validations, revenues of major companies are estimated (in case not available) based on industry benchmark, approximate number of employees, product portfolio, and primary interviews revenues are gathered. Further revenue from target product/service segment is assessed to avoid overshooting of market statistics. In case of heavy deviations between supply and demand side values, all thes steps are repeated to achieve synchronization.
We follow an iterative model, wherein we share our research findings with Subject Matter Experts (SME’s) and Key Opinion Leaders (KOLs) until consensus view of the market is not formulated – this model negates any drastic deviation in the opinions of experts. Only validated and universally acceptable research findings are quoted in our reports.
We have important check points that we use to validate our research findings – which we call – data triangulation, where we validate the information, we generate from secondary sources with primary interviews and then we re-validate with our internal data bases and Subject matter experts. This comprehensive model enables us to deliver high quality, reliable data in shortest possible time.


 Holen Sie sich ein kostenloses Muster für diesen Bericht