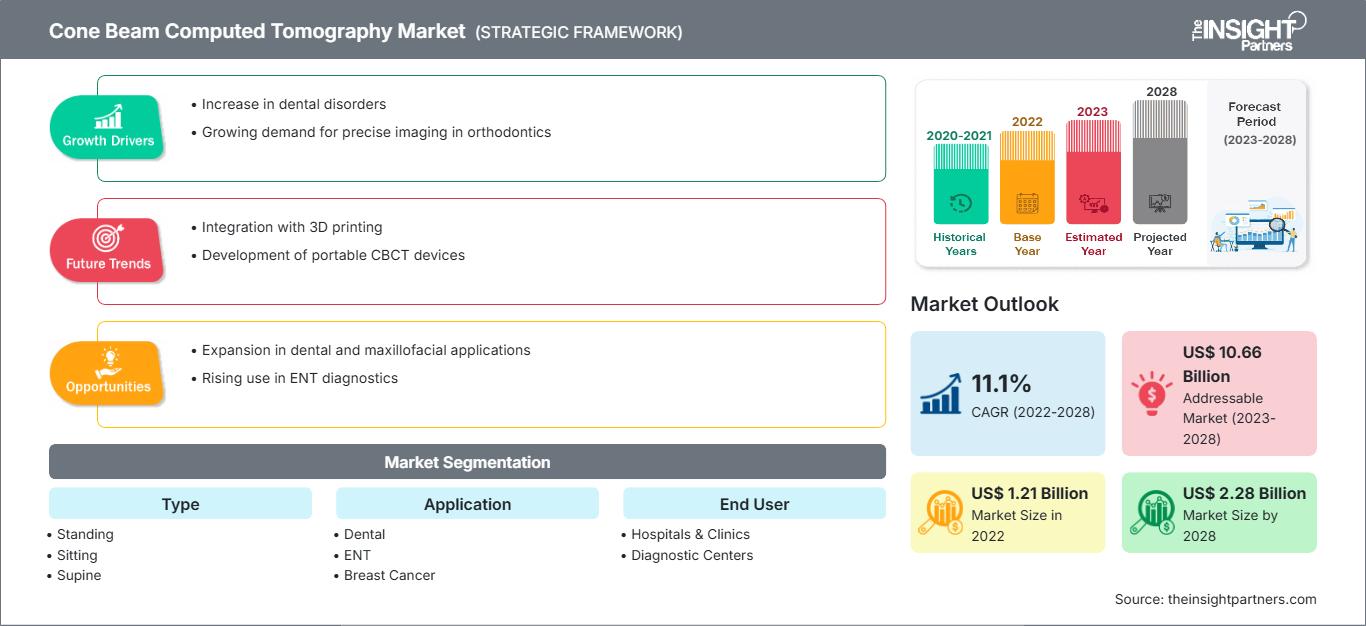
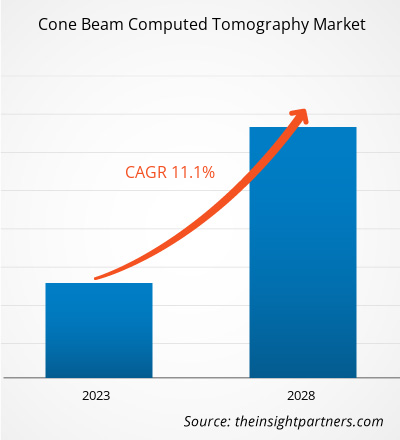
Der Markt für Cone-Beam-Computertomographie soll von 1.214,51 Millionen US-Dollar im Jahr 2022 auf 2.278,41 Millionen US-Dollar im Jahr 2028 anwachsen; das jährliche Wachstum von durchschnittlich 11,1 % wird zwischen 2022 und 2028 geschätzt.
Die Cone-Beam-Computertomographie ist eine Modifikation der herkömmlichen Computertomographie (CT). Die von Zahnärzten verwendeten Cone-Beam-Computertomographiesysteme rotieren um den Patienten und erfassen Daten mithilfe eines kegelförmigen Röntgenstrahls. Aus diesen Daten wird ein dreidimensionales Bild der Zähne, des Mund- und Kieferbereichs sowie der Ohren, der Nase und des Rachens erstellt.
Der Markt für Cone-Beam-Computertomographie ist nach Typ, Anwendung, Endnutzer und geografischer Lage segmentiert. Geografisch ist der Markt grob in Nordamerika, Europa, den asiatisch-pazifischen Raum, den Nahen Osten und Afrika sowie Süd- und Mittelamerika unterteilt. Der Bericht bietet Einblicke und eine detaillierte Marktanalyse mit Schwerpunkt auf Markttrends, technologischen Fortschritten und Marktdynamik. Er bietet außerdem eine Analyse der Wettbewerbslandschaft der weltweit führenden Marktteilnehmer.
Sie erhalten kostenlos Anpassungen an jedem Bericht, einschließlich Teilen dieses Berichts oder einer Analyse auf Länderebene, eines Excel-Datenpakets sowie tolle Angebote und Rabatte für Start-ups und Universitäten.
Markt für Cone-Beam-Computertomographie: Strategische Einblicke

- Holen Sie sich die wichtigsten Markttrends aus diesem Bericht.Dieses KOSTENLOSE Beispiel umfasst Datenanalysen, die von Markttrends bis hin zu Schätzungen und Prognosen reichen.
Markteinblicke
Integration von Software-Tools in CBCT-Geräte fördert Marktwachstum
Durch die Integration von Software-Tools in CBCT-Systeme können Anwender komplexe Diagnoseverfahren automatisieren und standardisieren, die Patientenerfahrung und die Diagnoseergebnisse verbessern, die Behandlungskosten senken und gleichzeitig die Funktionalität der CBCT-Systeme verbessern. Die Analyse und Interpretation von CBCT-Scandaten kann selbst für erfahrenes klinisches Fachpersonal eine Herausforderung darstellen. Die Softwaresysteme wurden entwickelt, um Dentallaboren, Zahnärzten, Implantologen und Chirurgen maximale Flexibilität und Präzision zu bieten. Die Softwareintegration mit CBCT würde Ärzten helfen, den Diagnoseumfang zu erweitern und die Einblicke in die zugrunde liegenden anatomischen Strukturen der Patienten während der Behandlungsplanung zu verbessern. Die Integration von Bildarchivierungs- und Kommunikationssystemen (PACS) mit CBCT-Systemen erleichtert die Aufnahme und Bearbeitung von Kamerabildern, die Bildfreigabe über die Cloud und ermöglicht eine effiziente Behandlungsplanung. PACS ist eine medizinische Bildgebungstechnologie, die hauptsächlich zur Speicherung und sicheren Übertragung digitaler elektronischer Bilder verwendet wird. Sie ermöglicht Ärzten an verschiedenen Standorten die gleichzeitige Betrachtung derselben Daten. Unternehmen im Bereich Digital Health investieren in die Entwicklung von Software für CBCT-Systeme. Daher trägt die Integration von CBCT-Geräten mit Softwaretools zur Vereinfachung der Datenanalyse, -interpretation und -archivierung zum Wachstum des Marktes für Cone-Beam-Computertomographie bei.
Technologische Fortschritte und F&E bringen neue Trends auf den CBCT-Markt
Technologische Fortschritte, insbesondere bei digitalen Bildgebungssystemen, haben zu Verbesserungen bei diagnostischen und chirurgischen Verfahren geführt. Dies ist darauf zurückzuführen, dass moderne Bildgebungssysteme medizinischem Personal detaillierte Informationen liefern und gleichzeitig die Strahlenbelastung der Patienten reduzieren. Mit CBCT-Techniken können Zahnärzte mehr Daten mit geringerer Strahlendosis erfassen. Früher verließen sich Ärzte bei Diagnose und Behandlungsplanung auf zweidimensionale Bildgebung. Die 2D-Technologie erfordert jedoch oft mehrere Aufnahmen. Daher hat das 3D-Scannen in der Diagnostik an Popularität gewonnen.
Einige der Fortschritte im DVT-Markt sind nachfolgend aufgeführt:
- Im März 2019 führte Planmeca Oy einen fortschrittlichen Planmeca Viso G5 in seine Planmeca Viso-Familie ein, der eine hohe DVT-Bildqualität bietet.
- Im Dezember 2021 führte RaySearch Laboratories AB neue Funktionen für Ray Station 11B für adaptive Arbeitsabläufe, Brachytherapie und Strahlentherapie mit Ionen ein. Ray Station 11B arbeitet mit einer verbesserten Genauigkeit der Dosisberechnung bei täglichen Bildern für die Photonentherapie. Tägliche DVTs bieten eine bessere Darstellung der Anatomie des Patienten zum Zeitpunkt der Behandlung als jede herkömmliche CT, die früh im Prozess aufgenommen und zur Planung der gesamten Behandlung verwendet wird.
- Im April 2022 brachte Carestream Dental die Neo Edition der CS 8200 3D-Familie auf den Markt, die das DVT-Scannen äußerst intuitiv machte. Die Neo Edition ist eine weiterentwickelte Version des CS 8200 3D und mit einem optionalen Scan-Ceph-Modul ausgestattet, das eine einfache Bedienung gewährleistet, zu einem besseren klinischen Erlebnis beiträgt und zu erfolgreicheren Ergebnissen führt. Anwender, die den CS 8200 3D bereits verwenden, können problemlos auf die neue Neo Edition upgraden.
- Im Juni 2022 erhielt Xoran Technologies ein Patent für eine modulare Cone-Beam-Computertomographie-Systembaugruppe.
Derartige technologische Fortschritte verschiedener Marktteilnehmer werden in den kommenden Jahren wahrscheinlich neue Trends auf dem Markt für Cone-Beam-Computertomographie bringen.
Einblicke für Endnutzer
Basierend auf dem Endnutzer ist der Markt für Cone-Beam-Computertomographie in Krankenhäuser und Kliniken, Diagnosezentren und andere unterteilt. Das Segment Krankenhäuser und Kliniken hatte 2021 den größten Marktanteil, und das Segment Diagnosezentren wird im Prognosezeitraum voraussichtlich die höchste durchschnittliche jährliche Wachstumsrate verzeichnen. Diagnostische Labore sind mit Full-Service-Bildgebungseinrichtungen ausgestattet, die Patienten umfassende Screening- und Diagnoseleistungen von höchster Qualität bieten. Diagnostische Zentren verfügen über alle modernen Bildgebungsverfahren wie CT-Scans, Ultraschall, Röntgen und Mammographie. Die Radiologen dieser Einrichtungen führen vor Ort eine vollständige Untersuchung der Patienten durch und übergeben ihnen innerhalb weniger Stunden Berichte. Fortschritte in der Bildgebungstechnologie, die zu schnellen und genauen Ergebnissen in kurzer Zeit führen, und ein starker Anstieg der Nachfrage nach Frühdiagnosen sind die Faktoren, die das Wachstum des Marktes für Cone-Beam-Computertomographie im Segment der diagnostischen Labore begünstigen.
Produkteinführungen sowie Fusionen und Übernahmen sind die am häufigsten verfolgten Strategien der Akteure auf dem globalen Markt für Cone-Beam-Computertomographie. Einige der jüngsten wichtigen Produktentwicklungen sind nachstehend aufgeführt:
- Im Mai 2021 brachte die PreXion Corporation das neueste Modell, den PreXion 3D Explorer PRO, auf den Markt. Diese Version des Geräts verfügt über einen integrierten kephalometrischen Röntgenarm.
- Im Februar 2021 erhielt Brainlab die FDA-Zulassung für den mobilen Bildgebungsroboter Loop-X und das robotergestützte Chirurgiesystem Cirq. Nach der CE-Kennzeichnung erhielt Brainlab auch die FDA-Zulassung für die Markteinführung dieser Produkte in den USA. Cirq ist ein robotergestütztes Ausrichtungsmodul für Wirbelsäulenoperationen und Loop-X ist das erste vollrobotergestützte intraoperative Bildgebungsgerät.
- Im November 2022 stärkte Canon sein Medizingeschäft mit der Gründung von Canon Healthcare USA, INC. Durch die Stärkung seiner Präsenz auf dem einflussreichen amerikanischen Medizinmarkt will Canon das Wachstum seines Medizingeschäfts beschleunigen.
Im asiatisch-pazifischen Raum wurden China und Indien schwer von der COVID-19-Pandemie getroffen. In diesen Ländern leiden bereits viele Patienten an chronischen Erkrankungen. Das medizinische Fachpersonal in diesen Ländern sagte planbare Eingriffe ab, um der Pandemiesituation entgegenzuwirken. Darüber hinaus vermieden Patienten und ihre Familienangehörigen Krankenhausbesuche, um sich vor Infektionen zu schützen – stattdessen entschieden sie sich für eine Online-Beratung. Dies führte zu einem enormen Rückgang der Diagnoseverfahren für chronische Erkrankungen. Andererseits löste ein Anstieg der COVID-19-Fälle die Nachfrage nach Röntgen- und Cone-Beam-Computertomographie-Systemen aus, die zur Überprüfung der Ausbreitung der Infektion in die Lunge eingesetzt wurden. CBCT-Bildgebung wird in der Thorax-Strahlentherapie täglich eingesetzt, um Veränderungen der Patientenposition und -anatomie vor der Behandlung durch eine qualitative Beurteilung des Lungenbildes durch Röntgentechniker zu überprüfen. Vor diesem Hintergrund haben verschiedene Marktteilnehmer aus dem asiatisch-pazifischen Raum neue und innovative Produkte auf den Markt gebracht, um die Diagnoseverfahren insgesamt zu vereinfachen. Somit hatte die COVID-19-Pandemie einen mäßig positiven Einfluss auf den Markt für Cone-Beam-Computertomographie.
Cone-Beam-ComputertomographieRegionale Einblicke in den Markt für Cone-Beam-Computertomographie
Die Analysten von The Insight Partners haben die regionalen Trends und Faktoren, die den Markt für Cone-Beam-Computertomographie im Prognosezeitraum beeinflussen, ausführlich erläutert. In diesem Abschnitt werden auch die Marktsegmente und die geografische Lage in Nordamerika, Europa, dem asiatisch-pazifischen Raum, dem Nahen Osten und Afrika sowie Süd- und Mittelamerika erörtert.
Umfang des Marktberichts zur Cone-Beam-Computertomographie
| Berichtsattribut | Einzelheiten |
|---|---|
| Marktgröße in 2022 | US$ 1.21 Billion |
| Marktgröße nach 2028 | US$ 2.28 Billion |
| Globale CAGR (2022 - 2028) | 11.1% |
| Historische Daten | 2020-2021 |
| Prognosezeitraum | 2023-2028 |
| Abgedeckte Segmente |
By Typ
|
| Abgedeckte Regionen und Länder | Nordamerika
|
| Marktführer und wichtige Unternehmensprofile |
|
Dichte der Marktteilnehmer im Bereich Cone-Beam-Computertomographie: Verständnis ihrer Auswirkungen auf die Geschäftsdynamik
Der Markt für Cone-Beam-Computertomographie wächst rasant. Dies wird durch die steigende Endverbrauchernachfrage aufgrund veränderter Verbraucherpräferenzen, technologischer Fortschritte und eines stärkeren Bewusstseins für die Produktvorteile vorangetrieben. Mit der steigenden Nachfrage erweitern Unternehmen ihr Angebot, entwickeln Innovationen, um den Bedürfnissen der Verbraucher gerecht zu werden, und nutzen neue Trends, was das Marktwachstum weiter ankurbelt.

- Holen Sie sich die Markt für Cone-Beam-Computertomographie Übersicht der wichtigsten Akteure
Cone-Beam-Computertomographie – Marktsegmentierung
Basierend auf der Patientenpositionierung ist der Markt für Cone-Beam-Computertomographie in Stehen, Sitzen und Liegen segmentiert. Nach Anwendung ist der Markt in Zahnmedizin, HNO, Brustkrebs, Schädelbasis, Orthopädie und Sonstiges segmentiert. Hinsichtlich der Endverbraucher ist der Markt für Cone-Beam-Computertomographie in Krankenhäuser und Kliniken, Diagnosezentren und Sonstiges unterteilt. Geografisch ist der Markt in Nordamerika (USA, Kanada und Mexiko), Europa (Frankreich, Deutschland, Großbritannien, Spanien, Italien und übriges Europa), Asien-Pazifik (China, Indien, Japan, Australien, Südkorea und übriger Asien-Pazifik-Raum), Naher Osten und Afrika (Saudi-Arabien, Vereinigte Arabische Emirate, Südafrika und übriger Naher Osten und Afrika) sowie Süd- und Südamerika unterteilt. Mittelamerika (Brasilien, Argentinien und Rest von Süd- und Mittelamerika)
Firmenprofile
- Dentsply Sirona Inc
- Newtom
- Carestream Dental LLC
- Fussen Group
- PreXion
- Brainlab AG
- IDETEC MEDICAL IMAGING
- Vatech Co., Ltd
- Planmeca Oy
- Canon Medical Systems
- Historische Analyse (2 Jahre), Basisjahr, Prognose (7 Jahre) mit CAGR
- PEST- und SWOT-Analyse
- Marktgröße Wert/Volumen – Global, Regional, Land
- Branchen- und Wettbewerbslandschaft
- Excel-Datensatz
Aktuelle Berichte
Erfahrungsberichte
Grund zum Kauf
- Fundierte Entscheidungsfindung
- Marktdynamik verstehen
- Wettbewerbsanalyse
- Kundeneinblicke
- Marktprognosen
- Risikominimierung
- Strategische Planung
- Investitionsbegründung
- Identifizierung neuer Märkte
- Verbesserung von Marketingstrategien
- Steigerung der Betriebseffizienz
- Anpassung an regulatorische Trends


 Kostenlose Probe anfordern für - Markt für Cone-Beam-Computertomographie