Marktwachstum, Größe, Anteil, Trends, Analyse der wichtigsten Akteure und Prognose für kosmetische bioaktive Inhaltsstoffe bis 2028

  • Report Code : TIPRE00023327
  • Category : Food and Beverages
  • Status : Published
  • No. of Pages : 166
Buy Now

Cosmetic Bioactive Ingredients Market to Grow at a CAGR of 5.4% to reach US$ 2,215.96 million from 2021 to 2028

Buy Now


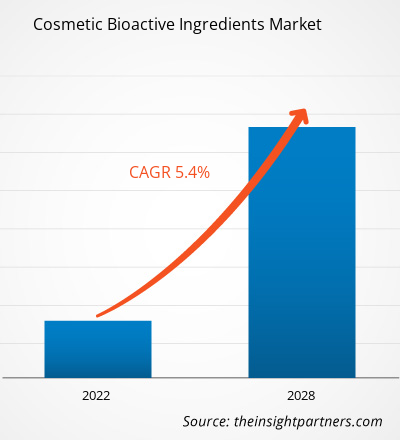
Der Markt für kosmetische bioaktive Inhaltsstoffe soll von 1.529,91 Millionen US-Dollar im Jahr 2021 auf 2.215,96 Millionen US-Dollar im Jahr 2028 anwachsen; von 2021 bis 2028 wird mit einer durchschnittlichen jährlichen Wachstumsrate von 5,4 % gerechnet.


Kosmetika sind Produkte, die auf Haut und Haar aufgetragen werden, um sie zu reinigen, zu verschönern, attraktiver zu machen oder das Aussehen zu verbessern. Unter den Wirkstoffen, die üblicherweise in dieser Art von Präparaten verwendet werden, gibt es einen weltweiten Trend, Produkte pflanzlichen Ursprungs zu verwenden, da sie kommerziell attraktiv, sicher und reichhaltig sind und oft mit einer synergistischen oder multifunktionalen Wirkung verbunden sind. Pflanzenextrakte sind reich an sekundären Metaboliten, die in Pflanzen mit hoher struktureller Vielfalt vorkommen. Sowohl Flavonoide als auch Nicht-Flavonoide werden mit interessanten kosmetischen Eigenschaften wie Lichtschutz, Anti-Aging, Feuchtigkeitsversorgung, Antioxidationsmittel, adstringierende Wirkung, reizlindernde Wirkung und antimikrobielle Wirkung in Verbindung gebracht. Mit ihren bioaktiven Komponenten und pharmakologischen Wirkungen haben sich diese bioaktiven Inhaltsstoffe als dermatologische Vorteile erwiesen, mit potenziellen Anwendungen für Hautverjüngung, Lichtschutz, Wundheilung und mehr. Das Wachstum des Marktes für kosmetische bioaktive Inhaltsstoffe ist in erster Linie auf die zunehmende Präferenz für natürliche Inhaltsstoffe in Kosmetikprodukten und die zunehmende Anzahl bioaktiver Inhaltsstoffe zurückzuführen, die auf den Markt gebracht werden. Strenge regulatorische Rahmenbedingungen schränken jedoch das Wachstum des Marktes für kosmetische bioaktive Inhaltsstoffe ein .


Passen Sie die Forschung Ihren Anforderungen an

Wir können die Analyse und den Umfang optimieren und anpassen, die unsere Standardangebote nicht abdecken. Diese Flexibilität hilft Ihnen, genau die Informationen zu erhalten, die Sie für Ihre Geschäftsplanung und Entscheidungsfindung benötigen.

Markt für bioaktive Inhaltsstoffe in der Kosmetik:

Markt für bioaktive Inhaltsstoffe in der Kosmetik
  • Cosmetic Bioactive Ingredients Market
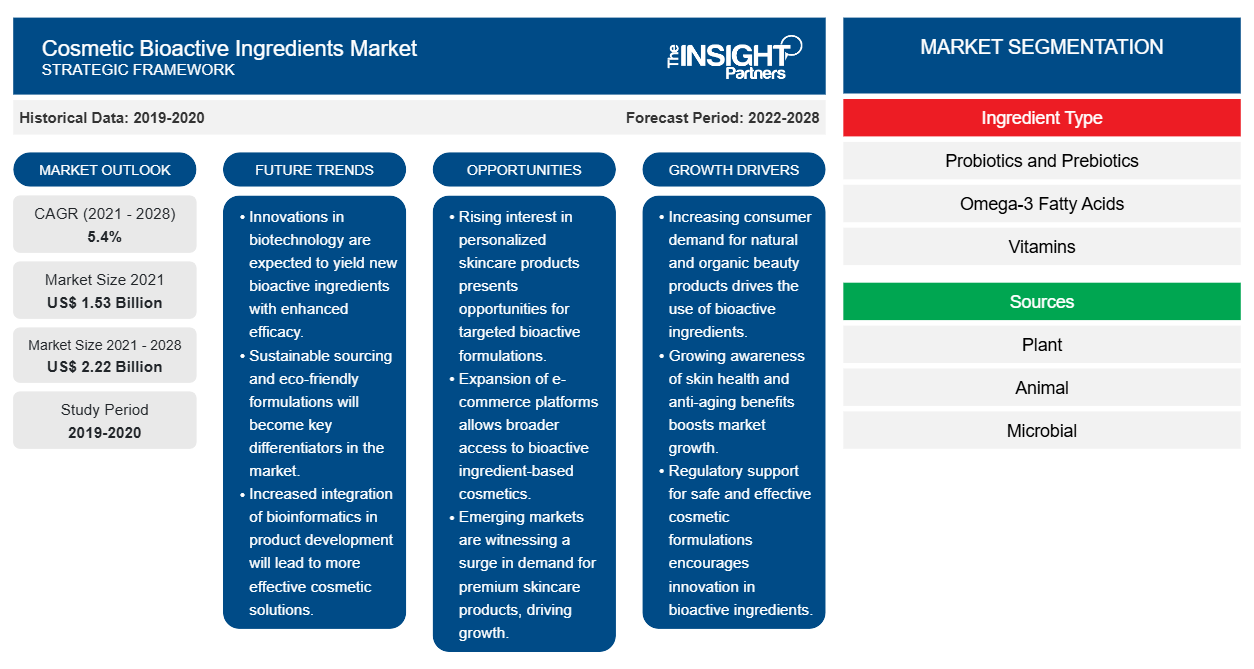
    CAGR (2021 - 2028)
    5,4 %
  • Marktgröße 2021
    1,53 Milliarden US-Dollar
  • Marktgröße 2028
    2,22 Milliarden US-Dollar

Marktdynamik

WACHSTUMSBESCHLEUNIGER
  • XXXXXXX
  • XXXXXXX
  • XXXXXXX
ZUKUNFTSTRENDS
  • XXXXXXX
  • XXXXXXX
  • XXXXXXX
GELEGENHEITEN
  • XXXXXXX
  • XXXXXXX
  • XXXXXXX

Schlüsselfiguren

  •  
  • Koninklijke DSM NV
  • Ajinomoto Co., Inc.
  • Roquette Freres
  • ADM
  • BASF SE
  • FMC Corporation
  • Vytrus Biotech
  • Cargill, Inc.
  • Sensient Technologies Corporation

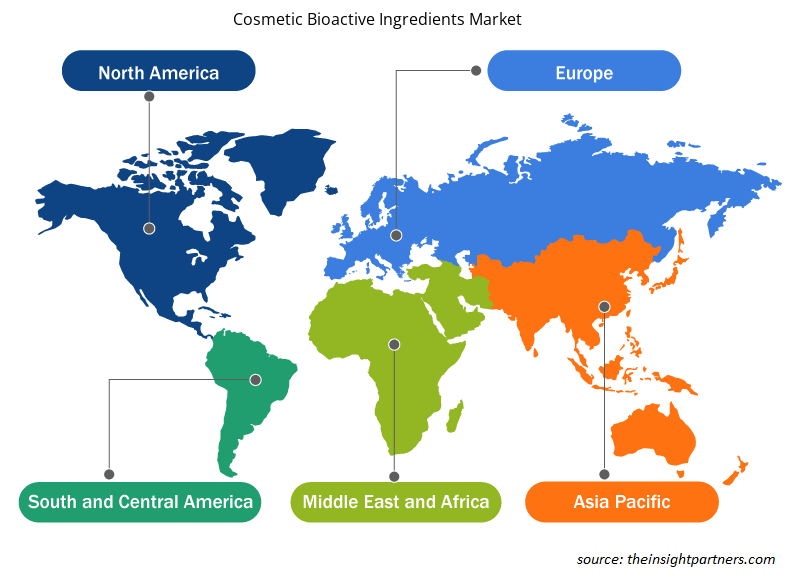
Regionaler Überblick

Cosmetic Bioactive Ingredients Market
  • Nordamerika
  • Europa
  • Asien-Pazifik
  • Süd- und Mittelamerika
  • Naher Osten und Afrika

Marktsegmentierung

Cosmetic Bioactive Ingredients MarketZutatentyp
  • Probiotika und Präbiotika
  • Omega-3-Fettsäuren
  • Vitamine
  • Carotinoide und Antioxidantien
  • Pflanzenextrakte
  • Mineralien
  • Aminosäuren
  • Proteine ​​und Peptide
  • Andere
Cosmetic Bioactive Ingredients MarketQuellen
  • Anlage
  • Tier
  • Mikrobiell
Cosmetic Bioactive Ingredients MarketErdkunde
  • Nordamerika
  • Europa
  • Asien-Pazifik
  • Naher Osten und Afrika
  • Süd- und Mittelamerika
  • Das Beispiel-PDF zeigt die Inhaltsstruktur und die Art der Informationen mit qualitativer und quantitativer Analyse.


Markteinblicke


Die steigende Nachfrage der Verbraucher nach Naturprodukten treibt die Forschung zu bioaktiven Substanzen voran, die in Kosmetika verwendet werden können. In Europa sind einige der größten Hersteller bioaktiver Inhaltsstoffe und Körperpflegemarken ansässig, darunter BASF und DSM. Die Einführung bioaktiver Inhaltsstoffe für die Körperpflegebranche treibt das Wachstum des Marktes voran. Im Juni 2019 brachte BASF Care Creations drei neue Wirkstoffe für den Schönheitsmarkt auf den Markt, die Rambutanbäume verwenden, die die Haut mit Feuchtigkeit versorgen und regenerieren. Ebenso brachte Lonza im April 2019 den bioaktiven Inhaltsstoff H2OBioEV auf den Markt, eine einzigartige Kombination aus Inhaltsstoffen natürlichen Ursprungs – Aphanothece Sacrum-Polysaccharide und Galactoarabinan – mit Wasser und Glycerin. Der Inhaltsstoff verleiht Feuchtigkeitseigenschaften, indem er wichtige Feuchthaltemittel auffüllt, was ein optimales Umfeld für die Bildung und Aufrechterhaltung einer starken epidermalen Proteinbarriere schafft.


Erkenntnisse auf Basis der Inhaltsstoffart


Basierend auf der Art der Inhaltsstoffe ist der Markt für kosmetische bioaktive Inhaltsstoffe in Probiotika und Präbiotika, Omega-3-Fettsäuren, Vitamine, Carotinoide und Antioxidantien, Pflanzenextrakte, Mineralien, Aminosäuren, Proteine ​​und Peptide und andere unterteilt. Das Aminosäurensegment wird im Jahr 2021 wahrscheinlich den größten Marktanteil haben. Es wird jedoch erwartet, dass das Segment Pflanzenextrakte im Prognosezeitraum die höchste durchschnittliche jährliche Wachstumsrate auf dem Markt verzeichnet.


Quellenbasierte Erkenntnisse


Der Markt für kosmetische bioaktive Inhaltsstoffe ist nach Quellen in pflanzliche, tierische und mikrobielle Inhaltsstoffe unterteilt. Das pflanzliche Segment dürfte 2021 den größten Marktanteil halten. Es wird jedoch erwartet, dass das mikrobielle Segment im Prognosezeitraum die höchste durchschnittliche jährliche Wachstumsrate (CAGR) auf dem Markt verzeichnet.

Unternehmen, die auf dem Markt für bioaktive Inhaltsstoffe in der Kosmetik tätig sind, verfolgen Strategien wie Produkteinführungen, Fusionen und Übernahmen, Kooperationen, Produktinnovationen und Produktportfolios, um ihre Präsenz weltweit auszubauen, ihren Markennamen zu wahren und die wachsende Nachfrage der Endverbraucher zu erfüllen.


Umfang des Marktberichts über bioaktive Inhaltsstoffe in der Kosmetik

BerichtsattributEinzelheiten
Marktgröße im Jahr 20211,53 Milliarden US-Dollar
Marktgröße bis 20282,22 Milliarden US-Dollar
Globale CAGR (2021 - 2028)5,4 %
Historische Daten2019-2020
Prognosezeitraum2022–2028
Abgedeckte SegmenteNach Zutatentyp
  • Probiotika und Präbiotika
  • Omega-3-Fettsäuren
  • Vitamine
  • Carotinoide und Antioxidantien
  • Pflanzenextrakte
  • Mineralien
  • Aminosäuren
  • Proteine ​​und Peptide
  • Andere
Nach Quellen
  • Anlage
  • Tier
  • Mikrobiell
Abgedeckte Regionen und LänderNordamerika
  • UNS
  • Kanada
  • Mexiko
Europa
  • Vereinigtes Königreich
  • Deutschland
  • Frankreich
  • Russland
  • Italien
  • Rest von Europa
Asien-Pazifik
  • China
  • Indien
  • Japan
  • Australien
  • Restlicher Asien-Pazifik-Raum
Süd- und Mittelamerika
  • Brasilien
  • Argentinien
  • Restliches Süd- und Mittelamerika
Naher Osten und Afrika
  • Südafrika
  • Saudi-Arabien
  • Vereinigte Arabische Emirate
  • Restlicher Naher Osten und Afrika
Marktführer und wichtige Unternehmensprofile
  •  
  • Koninklijke DSM NV
  • Ajinomoto Co., Inc.
  • Roquette Freres
  • ADM
  • BASF SE
  • FMC Corporation
  • Vytrus Biotech
  • Cargill, Inc.
  • Sensient Technologies Corporation
  • Das Beispiel-PDF zeigt die Inhaltsstruktur und die Art der Informationen mit qualitativer und quantitativer Analyse.


Markt für bioaktive Inhaltsstoffe in der Kosmetik – vonZutatentyp


  • Probiotika und Präbiotika
  • Omega-3-Fettsäuren
  • Vitamine
  • Carotinoide und Antioxidantien
  • Pflanzenextrakte
  • Mineralien
  • Aminosäuren
  • Proteine ​​und Peptide
  • Andere


Markt für kosmetische bioaktive Inhaltsstoffe – nach Quelle


  • Anlage
  • Tier
  • Mikrobiell


Markt für kosmetische bioaktive Inhaltsstoffe – nach Geografie


  • Nordamerika

    • UNS
    • Kanada
    • Mexiko
  • Europa

    • Frankreich
    • Deutschland
    • Italien
    • Vereinigtes Königreich
    • Spanien
    • Rest von Europa
  • Asien-Pazifik (APAC)

    • China
    • Indien
    • Südkorea
    • Japan
    • Australien
    • Restlicher Asien-Pazifik-Raum
  • Naher Osten und Afrika (MEA)

    • Südafrika
    • Saudi-Arabien
    • Vereinigte Arabische Emirate
    • Restlicher Naher Osten und Afrika
  • Südamerika (SAM)

    • Brasilien
    • Argentinien
    • Restliches Süd- und Mittelamerika


Firmenprofile


  • Koninklijke DSM NV
  • Ajinomoto Co., Inc.
  • Roquette Freres
  • ADM
  • BASF SE
  • FMC Corporation
  • Vytrus Biotech
  • Cargill, Inc.
  • Sensient Technologies Corporation
  • DUPONT
Report Coverage
Report Coverage

Revenue forecast, Company Analysis, Industry landscape, Growth factors, and Trends

Segment Covered
Segment Covered

This text is related
to segments covered.

Regional Scope
Regional Scope

North America, Europe, Asia Pacific, Middle East & Africa, South & Central America

Country Scope
Country Scope

This text is related
to country scope.

Frequently Asked Questions


What is the regional market scenario of cosmetic bioactive ingredients?

Global cosmetic bioactive ingredients market is segmented by region into North America, Europe, Asia Pacific, Middle East & Africa, and South & Central America. In North America, the U.S. is the largest market for cosmetic bioactive ingredients. The growth of the region is attributed to increasing product launches coupled with increasing adoption of cosmetics.
The Europe region is expected to account for the fastest growth in the cosmetic bioactive ingredients market. Technological advancement for extraction of bioactive ingredients in this region contribute to this dominant share. Additionally, rising preference for natural ingredients in cosmetic products are said to be responsible for this growth.

Who are the key players in the cosmetic bioactive ingredients market?

The cosmetic bioactive ingredients market majorly consists of the players such BASF SE, DuPont de Nemours, Inc., FMC CORPORATION, Cargill, Incorporated, Sensient Technologies Corporation, DSM, Ajinomoto Co. Inc., Roquette Frères, ADM, and Vytrus Biotech amongst others.

Which sources held the largest share in the cosmetic bioactive ingredients market?

The plant segment dominated the global cosmetic bioactive ingredients market and accounted for the largest revenue share of 62.50% in 2021.

Which ingredient type led the cosmetic bioactive ingredients market?

The amino acids segment dominated the global cosmetic bioactive ingredients market and held the largest revenue share of 20.81% in 2021.

What are the driving factors for the cosmetic bioactive ingredients market across the globe?

Key factors that are driving the growth of this market is rising preference for natural ingredients in cosmetic products and increasing launch of bioactive ingredients.

What are cosmetic bioactive ingredients?

Cosmetics are products made to apply to the skin and hair to cleansing, beautifying, promoting attractiveness, or improving appearance. Amid the active ingredients usually used in this type of preparation, there is a global trend of incorporating vegetable source products due to their commercial appeal, safety, and rich composition, often related with a synergistic or multifunctional effect. Botanical extracts are high in secondary metabolites that exist in plants with high structural diversity. Both flavonoids and non-flavonoids are related to interesting cosmetic properties like photoprotection, anti-aging, moisturizing, antioxidant, astringent, anti-irritant, and antimicrobial activity. With their bioactive components and pharmacologic actions, these bioactive ingredients have been shown to provide dermatologic benefits with potential applications for skin rejuvenation, photoprotection, wound healing, and more.

The List of Companies - Cosmetic Bioactive Ingredients Market

  1. Koninklijke DSM N.V.
  2. Ajinomoto Co., Inc.
  3. Roquette Freres
  4. ADM
  5. BASF SE
  6. FMC Corporation
  7. Vytrus Biotech
  8. Cargill, Inc.
  9. Sensient Technologies Corporation
  10. DUPONT

The Insight Partners performs research in 4 major stages: Data Collection & Secondary Research, Primary Research, Data Analysis and Data Triangulation & Final Review.

  1. Data Collection and Secondary Research:

As a market research and consulting firm operating from a decade, we have published and advised several client across the globe. First step for any study will start with an assessment of currently available data and insights from existing reports. Further, historical and current market information is collected from Investor Presentations, Annual Reports, SEC Filings, etc., and other information related to company’s performance and market positioning are gathered from Paid Databases (Factiva, Hoovers, and Reuters) and various other publications available in public domain.

Several associations trade associates, technical forums, institutes, societies and organization are accessed to gain technical as well as market related insights through their publications such as research papers, blogs and press releases related to the studies are referred to get cues about the market. Further, white papers, journals, magazines, and other news articles published in last 3 years are scrutinized and analyzed to understand the current market trends.

  1. Primary Research:

The primarily interview analysis comprise of data obtained from industry participants interview and answers to survey questions gathered by in-house primary team.

For primary research, interviews are conducted with industry experts/CEOs/Marketing Managers/VPs/Subject Matter Experts from both demand and supply side to get a 360-degree view of the market. The primary team conducts several interviews based on the complexity of the markets to understand the various market trends and dynamics which makes research more credible and precise.

A typical research interview fulfils the following functions:

  • Provides first-hand information on the market size, market trends, growth trends, competitive landscape, and outlook
  • Validates and strengthens in-house secondary research findings
  • Develops the analysis team’s expertise and market understanding

Primary research involves email interactions and telephone interviews for each market, category, segment, and sub-segment across geographies. The participants who typically take part in such a process include, but are not limited to:

  • Industry participants: VPs, business development managers, market intelligence managers and national sales managers
  • Outside experts: Valuation experts, research analysts and key opinion leaders specializing in the electronics and semiconductor industry.

Below is the breakup of our primary respondents by company, designation, and region:

Research Methodology

Once we receive the confirmation from primary research sources or primary respondents, we finalize the base year market estimation and forecast the data as per the macroeconomic and microeconomic factors assessed during data collection.

  1. Data Analysis:

Once data is validated through both secondary as well as primary respondents, we finalize the market estimations by hypothesis formulation and factor analysis at regional and country level.

  • Macro-Economic Factor Analysis:

We analyse macroeconomic indicators such the gross domestic product (GDP), increase in the demand for goods and services across industries, technological advancement, regional economic growth, governmental policies, the influence of COVID-19, PEST analysis, and other aspects. This analysis aids in setting benchmarks for various nations/regions and approximating market splits. Additionally, the general trend of the aforementioned components aid in determining the market's development possibilities.

  • Country Level Data:

Various factors that are especially aligned to the country are taken into account to determine the market size for a certain area and country, including the presence of vendors, such as headquarters and offices, the country's GDP, demand patterns, and industry growth. To comprehend the market dynamics for the nation, a number of growth variables, inhibitors, application areas, and current market trends are researched. The aforementioned elements aid in determining the country's overall market's growth potential.

  • Company Profile:

The “Table of Contents” is formulated by listing and analyzing more than 25 - 30 companies operating in the market ecosystem across geographies. However, we profile only 10 companies as a standard practice in our syndicate reports. These 10 companies comprise leading, emerging, and regional players. Nonetheless, our analysis is not restricted to the 10 listed companies, we also analyze other companies present in the market to develop a holistic view and understand the prevailing trends. The “Company Profiles” section in the report covers key facts, business description, products & services, financial information, SWOT analysis, and key developments. The financial information presented is extracted from the annual reports and official documents of the publicly listed companies. Upon collecting the information for the sections of respective companies, we verify them via various primary sources and then compile the data in respective company profiles. The company level information helps us in deriving the base number as well as in forecasting the market size.

  • Developing Base Number:

Aggregation of sales statistics (2020-2022) and macro-economic factor, and other secondary and primary research insights are utilized to arrive at base number and related market shares for 2022. The data gaps are identified in this step and relevant market data is analyzed, collected from paid primary interviews or databases. On finalizing the base year market size, forecasts are developed on the basis of macro-economic, industry and market growth factors and company level analysis.

  1. Data Triangulation and Final Review:

The market findings and base year market size calculations are validated from supply as well as demand side. Demand side validations are based on macro-economic factor analysis and benchmarks for respective regions and countries. In case of supply side validations, revenues of major companies are estimated (in case not available) based on industry benchmark, approximate number of employees, product portfolio, and primary interviews revenues are gathered. Further revenue from target product/service segment is assessed to avoid overshooting of market statistics. In case of heavy deviations between supply and demand side values, all thes steps are repeated to achieve synchronization.

We follow an iterative model, wherein we share our research findings with Subject Matter Experts (SME’s) and Key Opinion Leaders (KOLs) until consensus view of the market is not formulated – this model negates any drastic deviation in the opinions of experts. Only validated and universally acceptable research findings are quoted in our reports.

We have important check points that we use to validate our research findings – which we call – data triangulation, where we validate the information, we generate from secondary sources with primary interviews and then we re-validate with our internal data bases and Subject matter experts. This comprehensive model enables us to deliver high quality, reliable data in shortest possible time.

Your data will never be shared with third parties, however, we may send you information from time to time about our products that may be of interest to you. By submitting your details, you agree to be contacted by us. You may contact us at any time to opt-out.

Trends and growth analysis reports related to Food and Beverages : READ MORE..