Datenbusmarktwachstum, Größe, Anteil, Trends, Analyse der Hauptakteure und Prognose bis 2028

  • Report Code : TIPTE100000505
  • Category : Electronics and Semiconductor
  • Status : Published
  • No. of Pages : 199
Buy Now

Data Bus Market Size, Share & Global Industry Analysis by 2028

Buy Now


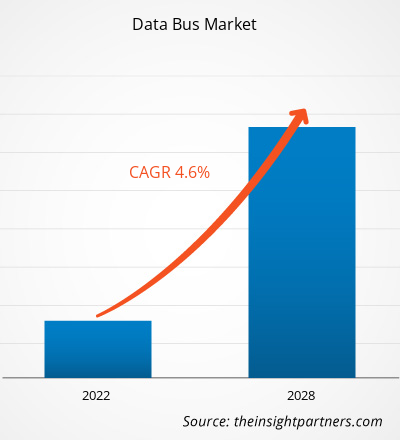
Der Datenbusmarkt soll von 18.488,9 Millionen US-Dollar im Jahr 2021 auf 25.258,0 Millionen US-Dollar im Jahr 2028 wachsen; für den Zeitraum 2021–2028 wird eine durchschnittliche jährliche Wachstumsrate (CAGR) von 4,6 % geschätzt.

Der Begriff „Datenbus“ bezieht sich auf einen internen Pfad, der für die Datenübertragung zwischen Prozessoren oder Speichern gebaut wurde. Im Laufe der Jahre haben sich zahlreiche Arten von Datenbussen entwickelt, die mit verschiedenen Hardwaregeräten wie Datenspeichereinheiten und Prozessoren kompatibel sind. Es haben sich verschiedene Arten von Datenbussystemen in Personalcomputern und anderer Hardware entwickelt. Datenbussysteme werden in verschiedenen Anwendungen eingesetzt, darunter in der Schifffahrt, im Automobilbau, in der kommerziellen Luftfahrt und im Militär. Die kontinuierliche Modernisierung von Militärflugzeugen kann die Wahrscheinlichkeit von Unfällen aufgrund von Fehlern der Piloten verringern, die Einsatzkapazitäten verbessern und das Verständnis der Umstände erhöhen. Das Wachstum des Datenbusmarktes ist auf die Zunahme der Pkw-Bestellungen, die Zunahme der Anzahl der Flugzeugauslieferungen, die Modernisierung von Marine- und Luftlandeprogrammen und die Notwendigkeit zurückzuführen, die Austauschspezifikationen zu reduzieren. Die durchschnittliche Lebensdauer eines Datenbusses beträgt 35 bis 45 Jahre, und danach müssen die Systeme aufgerüstet werden. Die lange Lebensdauer behindert das Wachstum des Datenbusmarktes, da sie die Wahrscheinlichkeit verringert, die derzeit verwendeten Systeme durch neue zu ersetzen.


Passen Sie die Forschung Ihren Anforderungen an

Wir können die Analyse und den Umfang optimieren und anpassen, die unsere Standardangebote nicht abdecken. Diese Flexibilität hilft Ihnen, genau die Informationen zu erhalten, die Sie für Ihre Geschäftsplanung und Entscheidungsfindung benötigen.

Datenbusmarkt:

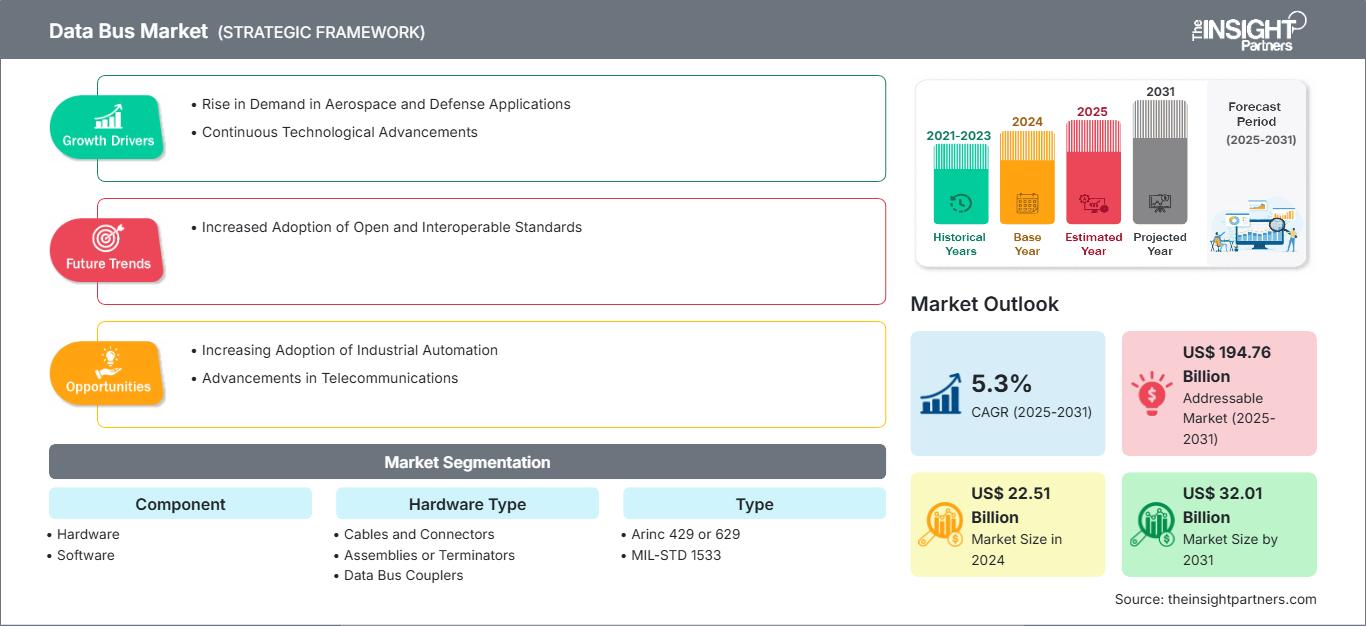
Data Bus Market: Strategic Insights

Data Bus Market
  • CAGR
    CAGR (2021 - 2028)
    4.6%
  • Market Size 2021
    US$ 18.49 Billion
  • Market Size 2028
    US$ 25.26 Billion

Market Dynamics

GROWTH DRIVERS
  • XXXXXXX
  • XXXXXXX
  • XXXXXXX
FUTURE TRENDS
  • XXXXXXX
  • XXXXXXX
  • XXXXXXX
OPPORTUNITIES
  • XXXXXXX
  • XXXXXXX
  • XXXXXXX

Key Players

  • Astronics Corporation
  • Amphenol Ltd
  • Collins Aerospace
  • Data Device Corporation
  • Data Bus Products Corporation
  • Fujikura Ltd
  • HUBER SUHNER
  • Nexans
  • TE Connectivity

Regional Overview

Regional And Country Scope
  • Nordamerika
  • Europa
  • Asien-Pazifik
  • Süd- und Mittelamerika
  • Naher Osten und Afrika

Market Segmentation

Segment 1Komponente
  • Hardware und Software
Segment2Protokoll
  • Arinc 429/629
  • Mil-Std 1553 und andere
Segment3Anwendung
  • Marine-
  • Automobil-
  • Verkehrs- und Militärluftfahrt

Datenbusmarkt
  • Data Bus Market
    CAGR (2021 - 2028)
    4,6 %
  • Marktgröße 2021
    18,49 Milliarden US-Dollar
  • Marktgröße 2028
    25,26 Milliarden US-Dollar

Marktdynamik

WACHSTUMSBESCHLEUNIGER
  • XXXXXXX
  • XXXXXXX
  • XXXXXXX
ZUKUNFTSTRENDS
  • XXXXXXX
  • XXXXXXX
  • XXXXXXX
GELEGENHEITEN
  • XXXXXXX
  • XXXXXXX
  • XXXXXXX

Schlüsselfiguren

  •  
  • Astronics Corporation
  • Amphenol Ltd.
  • Collins Luft- und Raumfahrt
  • Data Device Corporation
  • Data Bus Products Corporation
  • Fujikura Ltd.
  • HUBER+SUHNER
  • Nexans
  • TE-Konnektivität

Regionaler Überblick

Data Bus Market
  • Nordamerika
  • Europa
  • Asien-Pazifik
  • Süd- und Mittelamerika
  • Naher Osten und Afrika

Marktsegmentierung

Data Bus MarketKomponente
  • Hard-und Software
Data Bus MarketProtokoll
  • Arinc 429/629
  • Mil-Std 1553
  • Andere
Data Bus MarketAnwendung
  • Marine
  • Automobilindustrie
  • Kommerzielle Luftfahrt
  • Militärische Luftfahrt
  • Das Beispiel-PDF zeigt die Inhaltsstruktur und die Art der Informationen mit qualitativer und quantitativer Analyse.


Auswirkungen der COVID-19-Pandemie auf den Datenbusmarkt

Der COVID-19-Ausbruch hat die Welt erheblich beeinflusst und erschüttert weiterhin mehrere Länder. Bis zum Ausbruch von COVID-19 verzeichnete die Luft- und Raumfahrtindustrie trotz enormer Rückstände bei den Flugzeugherstellern ein erhebliches Produktionswachstum. Die globale Luftfahrtindustrie verzeichnete einen deutlichen Anstieg der Passagierzahlen und eine Zunahme der Flugzeugbeschaffung.

Leider dezimierte der COVID-19-Ausbruch die weltweite Nachfrage nach Flugzeugen, was sich in deutlich geringeren Auftragsvolumina bei den Flugzeugherstellern widerspiegelte, was zu einer geringeren Anzahl von Produktionen führte. Der Rückgang der Produktionsmengen wirkte sich negativ auf die Geschäfte verschiedener Komponentenhersteller und zugehöriger Technologien aus. So wurden die Geschäfte der Akteure auf dem Datenbusmarkt durch die Destabilisierung der Flugzeugproduktion stark beeinträchtigt.

Laut der Electronic Components Industry Association (ECIA) hat das Auftreten von COVID-19 zu Verzögerungen bei Produktveröffentlichungen, Störungen in der Lieferkette und anderen industriellen Aktivitäten geführt. Mehrere Hersteller haben die Produktionseinheiten vorübergehend eingestellt, da die Nachfrage nach den Produkten infolge von Sperrmaßnahmen und begrenzten Produktionsressourcen geringer war. Darüber hinaus haben die Hersteller verschiedener elektronischer und Halbleiterprodukte, einschließlich Datenkabel, erhebliche Verzögerungen bei den Lieferzeiten erlebt, was die Lieferkette geschwächt hat. Dies hat sich negativ auf den Datenbusmarkt ausgewirkt.

Während der Pandemie kam der gesamte Datenbusmarkt zum Stillstand, da nur minimale Ressourcen zur Vorhersage der Zukunft zur Verfügung standen. Mehrere Produktionseinheiten in den USA, Frankreich, Russland und China wurden vorübergehend stillgelegt, um die staatlichen Vorschriften bezüglich Ausgangssperren und physischer Distanzierung einzuhalten. Die Flugzeughersteller erlebten einen Umsatzrückgang von 14–15 % auf dem Markt für allgemeine Luftfahrt. Dies führte zu einem Umsatzrückgang auf dem Datenbusmarkt.


Einblicke in den Datenbusmarkt


Laufende Modernisierung in der Militärluftfahrt

Steigende Militärausgaben in Schwellenländern treiben Investitionen in die Modernisierung der vorhandenen Ausrüstung in alternden Flugzeugen voran. Aufgrund technischer Probleme mit verschiedenen Konstruktionen sowie Problemen mit Antrieb, Verbindung und anderen Systemen besteht eine wachsende Nachfrage nach technologisch überlegenen Militärflugzeugen als Ersatz für konventionelle Militärflugzeuge. Dies soll der ständig steigenden Zahl von Bedrohungen und völlig neuen Missionsanforderungen gerecht werden. Vollständig vernetzte Fluggesellschaften, am Boden und in der Luft, können Echtzeitdaten nutzen, um den Flugbetrieb zu verbessern, zukünftige Zeitpläne zu verkürzen und das Kundenerlebnis zu verbessern. Daher haben viele Flugzeughersteller ihre Flugzeuge mit Netzwerkfunktionen aufgerüstet, die Konnektivität während des Fluges ermöglichen, was die Nachfrage nach Datenbussen angekurbelt hat. Die Expansion des Luft- und Raumfahrt- und Militärsektors wird das globale Marktwachstum in den kommenden Jahren wahrscheinlich weiter ankurbeln. Die Einführung von FlexRay-Protokollen und organischen und anorganischen Wachstumstaktiken in der Militärluftfahrt wird voraussichtlich das Wachstum des globalen Datenbusmarktes ankurbeln. Die Expansion des globalen Datenbusmarktes wird weiter durch kommerzielle und militärische Flugzeuge vorangetrieben. Der Bedarf an der Integration von Vollduplex-Switching-Ethernet, Überwachungssystemen, Cockpitsystemen, Flugsteuerung, Navigationssystemen, Luftdatensystemen, Kommunikationssystemen und zentralen Wartungssystemen in einzelne modulare Avioniksysteme treibt auch den Datenbusmarkt an.


Komponentenbasierte Markteinblicke

Basierend auf den Komponenten ist der Datenbusmarkt in Hardware und Software segmentiert. Das Hardwaresegment umfasst außerdem Kabel und Steckverbinder , Baugruppen/Abschlusswiderstände, Datenbuskoppler, Schnittstellenkarten/-platinen und mehr.


Protokollbasierte Markteinblicke

Basierend auf dem Protokoll ist der Datenbusmarkt in Arinc 429/629, Mil-Std 1553 und andere unterteilt. Das Protokoll ist die Sprache, die auf einem Luftfahrtdatenbus verwendet wird. Protokolle sind eine Reihe formaler Regeln und Normen, die den Datenaustausch zwischen Systemen regeln. Das Protokoll spezifiziert die Übertragung und den Empfang von Daten auf einem Bus. Ebenfalls vom Protokoll und seinen zugehörigen Komponenten geregelt sind Datenkollisionsvermeidung, Integrität und Busgeschwindigkeit. Die elektrischen und physikalischen Standards werden über Protokolle auf niedriger Ebene definiert. Die Datenformatierung, einschließlich Nachrichtensyntax und -format, wird über Protokolle auf hoher Ebene abgewickelt.

Akteure, die auf dem Datenbusmarkt tätig sind, verfolgen Strategien wie Fusionen, Übernahmen und Marktinitiativen, um ihre Positionen auf dem Markt zu behaupten. Im Folgenden sind einige Entwicklungen der wichtigsten Akteure aufgeführt:

  • Im Jahr 2021 kündigte Astronics Corporation die Einführung neuer Protokollmodelle für seine Ballard ME1000-Familie von mPCIe-Avionik-Schnittstellenkarten für eingebettete Luft- und Raumfahrtanwendungen an. Die neuen Modelle bieten Schnittstellenfunktionen für die Datenbusprotokolle ARINC 429 und ARINC 717 und ergänzen zuvor veröffentlichte Modelle für MIL-STD-1553.


Umfang des Datenbus-Marktberichts

BerichtsattributEinzelheiten
Marktgröße im Jahr 202118,49 Milliarden US-Dollar
Marktgröße bis 202825,26 Milliarden US-Dollar
Globale CAGR (2021 - 2028)4,6 %
Historische Daten2019-2020
Prognosezeitraum2022–2028
Abgedeckte SegmenteNach Komponente
  • Hard-und Software
Nach Protokoll
  • Arinc 429/629
  • Mil-Std 1553
  • Andere
Nach Anwendung
  • Marine
  • Automobilindustrie
  • Kommerzielle Luftfahrt
  • Militärische Luftfahrt
Abgedeckte Regionen und LänderNordamerika
  • UNS
  • Kanada
  • Mexiko
Europa
  • Vereinigtes Königreich
  • Deutschland
  • Frankreich
  • Russland
  • Italien
  • Rest von Europa
Asien-Pazifik
  • China
  • Indien
  • Japan
  • Australien
  • Restlicher Asien-Pazifik-Raum
Süd- und Mittelamerika
  • Brasilien
  • Argentinien
  • Restliches Süd- und Mittelamerika
Naher Osten und Afrika
  • Südafrika
  • Saudi-Arabien
  • Vereinigte Arabische Emirate
  • Restlicher Naher Osten und Afrika
Marktführer und wichtige Unternehmensprofile
  •  
  • Astronics Corporation
  • Amphenol Ltd.
  • Collins Luft- und Raumfahrt
  • Data Device Corporation
  • Data Bus Products Corporation
  • Fujikura Ltd.
  • HUBER+SUHNER
  • Nexans
  • TE-Konnektivität
  • Das Beispiel-PDF zeigt die Inhaltsstruktur und die Art der Informationen mit qualitativer und quantitativer Analyse.


Der Datenbusmarkt wurde segmentiert und basierend auf Komponente, Protokoll und Anwendung analysiert. Basierend auf Komponente ist der Datenbusmarkt weiter segmentiert in Hardware und Software. In Bezug auf Protokoll ist der Datenbusmarkt segmentiert in ARINC 429/629, MIL–STD-1553 und andere. Basierend auf Anwendung ist der Datenbusmarkt weiter segmentiert in Automobil, Schifffahrt, kommerzielle Luftfahrt und Militärluftfahrt.

Astronics Corporation, Collins Aerospace, Fujikura Ltd., HUBER+SUHNER, Nexans, TE Connectivity Corporation, Amphenol Ltd., Data Device Corporation, Data Bus Corporation und OCC sind die wichtigsten Datenbusmarktakteure, die für die Forschungsstudie berücksichtigt wurden. Darüber hinaus wurden in diesem Forschungsbericht mehrere andere bedeutende Datenbusmarktakteure untersucht und analysiert, um einen ganzheitlichen Überblick über den globalen Datenbusmarkt und sein Ökosystem zu erhalten.

Data Bus Market Report Scope

Report Attribute Details
Market size in US$ 18.49 Billion
Market Size by US$ 25.26 Billion
Global CAGR 4.6%
Historical Data 2019-2020
Forecast period 2022-2028
Segments Covered By Komponente
  • Hardware und Software
By Protokoll
  • Arinc 429/629
  • Mil-Std 1553 und andere
By Anwendung
  • Marine-
  • Automobil-
  • Verkehrs- und Militärluftfahrt
Regions and Countries Covered Nordamerika
  • USA
  • Kanada
  • Mexiko
Europa
  • Großbritannien
  • Deutschland
  • Frankreich
  • Russland
  • Italien
  • Restliches Europa
Asien-Pazifik
  • China
  • Indien
  • Japan
  • Australien
  • Restlicher Asien-Pazifik
Süd- und Mittelamerika
  • Brasilien
  • Argentinien
  • Restliches Süd- und Mittelamerika
Naher Osten und Afrika
  • Südafrika
  • Saudi-Arabien
  • Vereinigte Arabische Emirate
  • Restlicher Naher Osten und Afrika
Market leaders and key company profiles
  • Astronics Corporation
  • Amphenol Ltd
  • Collins Aerospace
  • Data Device Corporation
  • Data Bus Products Corporation
  • Fujikura Ltd
  • HUBER SUHNER
  • Nexans
  • TE Connectivity
  • Report Coverage
    Report Coverage

    Revenue forecast, Company Analysis, Industry landscape, Growth factors, and Trends

    Segment Covered
    Segment Covered

    This text is related
    to segments covered.

    Regional Scope
    Regional Scope

    North America, Europe, Asia Pacific, Middle East & Africa, South & Central America

    Country Scope
    Country Scope

    This text is related
    to country scope.

    Frequently Asked Questions


    What trends are expected to drive the demand for various databus?

    On the onboard bus, there is an upsurge in traffic. Remote terminals expect improved services from the onboard bus as they become more "intelligent." They expect to access the bus on demand to transfer data packets. Many current software architectures are built around messaging capabilities, in which programs communicate via variable-length messages generated asynchronously. Because of the growing "intelligence" of remote terminals, their expectations for more complete communication services, and the necessity to support increasingly sophisticated, multi-bus designs, higher-level protocols are being used more frequently on the onboard bus. This, in turn, may increase traffic volume, particularly asynchronous traffic, but it also emphasizes the necessity for the onboard bus to provide asymmetric medium access service. While asynchronous packet traffic on spacecraft buses has been steadily increasing, the number of basic sensors and actuators that must be serviced through the bus has remained constant. In reality, there is strong evidence that such low-cost gadgets are increasing. The MIL-STD-1553B command and control bus is the most frequent aboard a spacecraft, and the additions in ECSS-E-ST-50-13C cover it for future European space use. However, as processing power grows and sub-systems become more complex, there is a growing demand for data networks that meet MIL-STD-1553B requirements while also being compatible with the miniaturized low-power devices they connect. Pin counts, connector sizes, and harness bulk can all be reduced in this way. The awareness that the building block method demands standardization above the basic bus protocols goes hand in hand with the requirement to improve connectivity. Future data system innovations include, among other things, the adoption of the CAN bus as a complement to MIL-STD-1553B, the creation and usage of higher-layer protocols, and the standardization of digital sensor buses as the most efficient means to decrease harness and integration costs.

    Which region is expected to dominate the databus market in the forecast period?

    North America is expected to hold the largest share of the Data Bus Market in the coming years as it includes a few of the world's fastest growing and leading economies. The North American Data Bus Market is segmented into the US, Canada, and Mexico. The growth of the Data Bus Market in North America can be attributed to the flourishing electric vehicles (EV) industry, in line with the increasing number of environmental regulations and green initiatives.

    Which protocol is expected to dominate the market during the forecast period?

    Based on Protocol, the Data Bus Market is segmented as Arinc 429/629, Mil-Std 1553, and others. The protocol is the language that is utilized on an aviation data bus. Protocols are a set of formal rules and norms that regulate data exchange between systems. The protocol specifies the transmission and receipt of data on a bus. Also governed by protocol and its accompanying components are data collision prevention, integrity, and bus speed. The electrical and physical standards are defined via low-level protocols. Data formatting, including message syntax and format, is dealt with by high-level protocols. The Mil-Std 1553 segment led the Data Bus Market with a market share of 47.5% in 2020. It is expected to account for 47.8% of the total market in 2028.

    Which component is expected to dominate the market in the forecast period?

    The hardware segment led the Data Bus Market with a market share of 65.9% in 2020. It is expected to account for 62.2% of the total market in 2028. The hardware segment for data bus further comprises of cables and connectors, assemblies/terminators, data bus couplers, interface cards/boards, and others.

    What are reasons behind databus market growth?

    The data bus systems are used in various applications, including marine, automotive, commercial aviation, and military applications. The continuous modernization of military aircraft can decrease the possibilities of mishaps resulting due to errors introduced by pilots, enhance mission capacities, and increase comprehension of circumstances. The growth of the Data Bus Market is attributed to the increase in passenger car orders, rise in the number of aircraft deliveries, upgrading of naval and airborne programs, and a need to decrease swap specifications. The average life of a data bus ranges from 35 to 45 years, and after that, the systems need an upgrade. The long life hampers the growth of the Data Bus Market as it reduces the chances of replacing the systems that are currently in use with the new ones.

    What are market opportunities for databus market?

    The demand for new military aircraft is increasing as countries attempt to update their fleets and expand their capabilities, especially in Asia-Pacific. The Australian Army received the first two of four new Boeing CH-47F Chinook transport helicopters in July 2021. The contract is worth USD 441 million and would add 14 CH-47F heavy-lift helicopters to the Army's fleet. The third and fourth helicopters are expected to arrive in mid-2022. The Royal Australian Air Force (RAAF) has placed another order for 2 P-8As, bringing the total number of P-8As under contract to 14. The P-8As are land-based antisubmarine and anti-surface ship planes built for intelligence, surveillance, and reconnaissance missions. Further, Indian government authorized the proposal for procuring 56 C295 transport aircraft from Airbus Defence and Space, Spain, in September 2021; Airbus Defence and Space, Spain has been awarded a contract for Rs 22,000 crore for the acquisition of the C 295MW cargo aircraft. 14 of the planes will be produced in Spain, with the remainder 40 being built in India as part of a joint venture between Airbus and Tata Group. In the last five years, China has added numerous new military aircraft to its inventory. As a result of these purchases, the demand for data bus is increasing in Asia Pacific as most new aircraft units are built upon data bus protocols.

    The List of Companies - Data Bus Market

    1. Astronics Corporation
    2. Amphenol Ltd.
    3. Collins Aerospace
    4. Data Device Corporation
    5. Data Bus Products Corporation
    6. Fujikura Ltd.
    7. HUBER+SUHNER
    8. Nexans
    9. TE Connectivity
    10. OCC

    The Insight Partners performs research in 4 major stages: Data Collection & Secondary Research, Primary Research, Data Analysis and Data Triangulation & Final Review.

    1. Data Collection and Secondary Research:

    As a market research and consulting firm operating from a decade, we have published and advised several client across the globe. First step for any study will start with an assessment of currently available data and insights from existing reports. Further, historical and current market information is collected from Investor Presentations, Annual Reports, SEC Filings, etc., and other information related to company’s performance and market positioning are gathered from Paid Databases (Factiva, Hoovers, and Reuters) and various other publications available in public domain.

    Several associations trade associates, technical forums, institutes, societies and organization are accessed to gain technical as well as market related insights through their publications such as research papers, blogs and press releases related to the studies are referred to get cues about the market. Further, white papers, journals, magazines, and other news articles published in last 3 years are scrutinized and analyzed to understand the current market trends.

    1. Primary Research:

    The primarily interview analysis comprise of data obtained from industry participants interview and answers to survey questions gathered by in-house primary team.

    For primary research, interviews are conducted with industry experts/CEOs/Marketing Managers/VPs/Subject Matter Experts from both demand and supply side to get a 360-degree view of the market. The primary team conducts several interviews based on the complexity of the markets to understand the various market trends and dynamics which makes research more credible and precise.

    A typical research interview fulfils the following functions:

    • Provides first-hand information on the market size, market trends, growth trends, competitive landscape, and outlook
    • Validates and strengthens in-house secondary research findings
    • Develops the analysis team’s expertise and market understanding

    Primary research involves email interactions and telephone interviews for each market, category, segment, and sub-segment across geographies. The participants who typically take part in such a process include, but are not limited to:

    • Industry participants: VPs, business development managers, market intelligence managers and national sales managers
    • Outside experts: Valuation experts, research analysts and key opinion leaders specializing in the electronics and semiconductor industry.

    Below is the breakup of our primary respondents by company, designation, and region:

    Research Methodology

    Once we receive the confirmation from primary research sources or primary respondents, we finalize the base year market estimation and forecast the data as per the macroeconomic and microeconomic factors assessed during data collection.

    1. Data Analysis:

    Once data is validated through both secondary as well as primary respondents, we finalize the market estimations by hypothesis formulation and factor analysis at regional and country level.

    • Macro-Economic Factor Analysis:

    We analyse macroeconomic indicators such the gross domestic product (GDP), increase in the demand for goods and services across industries, technological advancement, regional economic growth, governmental policies, the influence of COVID-19, PEST analysis, and other aspects. This analysis aids in setting benchmarks for various nations/regions and approximating market splits. Additionally, the general trend of the aforementioned components aid in determining the market's development possibilities.

    • Country Level Data:

    Various factors that are especially aligned to the country are taken into account to determine the market size for a certain area and country, including the presence of vendors, such as headquarters and offices, the country's GDP, demand patterns, and industry growth. To comprehend the market dynamics for the nation, a number of growth variables, inhibitors, application areas, and current market trends are researched. The aforementioned elements aid in determining the country's overall market's growth potential.

    • Company Profile:

    The “Table of Contents” is formulated by listing and analyzing more than 25 - 30 companies operating in the market ecosystem across geographies. However, we profile only 10 companies as a standard practice in our syndicate reports. These 10 companies comprise leading, emerging, and regional players. Nonetheless, our analysis is not restricted to the 10 listed companies, we also analyze other companies present in the market to develop a holistic view and understand the prevailing trends. The “Company Profiles” section in the report covers key facts, business description, products & services, financial information, SWOT analysis, and key developments. The financial information presented is extracted from the annual reports and official documents of the publicly listed companies. Upon collecting the information for the sections of respective companies, we verify them via various primary sources and then compile the data in respective company profiles. The company level information helps us in deriving the base number as well as in forecasting the market size.

    • Developing Base Number:

    Aggregation of sales statistics (2020-2022) and macro-economic factor, and other secondary and primary research insights are utilized to arrive at base number and related market shares for 2022. The data gaps are identified in this step and relevant market data is analyzed, collected from paid primary interviews or databases. On finalizing the base year market size, forecasts are developed on the basis of macro-economic, industry and market growth factors and company level analysis.

    1. Data Triangulation and Final Review:

    The market findings and base year market size calculations are validated from supply as well as demand side. Demand side validations are based on macro-economic factor analysis and benchmarks for respective regions and countries. In case of supply side validations, revenues of major companies are estimated (in case not available) based on industry benchmark, approximate number of employees, product portfolio, and primary interviews revenues are gathered. Further revenue from target product/service segment is assessed to avoid overshooting of market statistics. In case of heavy deviations between supply and demand side values, all thes steps are repeated to achieve synchronization.

    We follow an iterative model, wherein we share our research findings with Subject Matter Experts (SME’s) and Key Opinion Leaders (KOLs) until consensus view of the market is not formulated – this model negates any drastic deviation in the opinions of experts. Only validated and universally acceptable research findings are quoted in our reports.

    We have important check points that we use to validate our research findings – which we call – data triangulation, where we validate the information, we generate from secondary sources with primary interviews and then we re-validate with our internal data bases and Subject matter experts. This comprehensive model enables us to deliver high quality, reliable data in shortest possible time.

    Your data will never be shared with third parties, however, we may send you information from time to time about our products that may be of interest to you. By submitting your details, you agree to be contacted by us. You may contact us at any time to opt-out.

    Trends and growth analysis reports related to Electronics and Semiconductor : READ MORE..