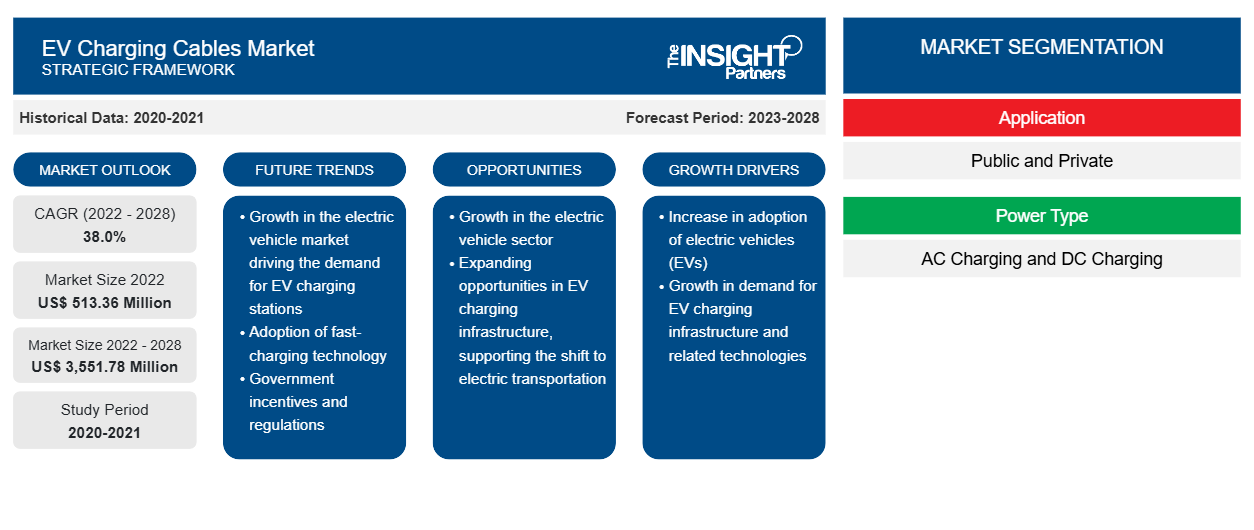
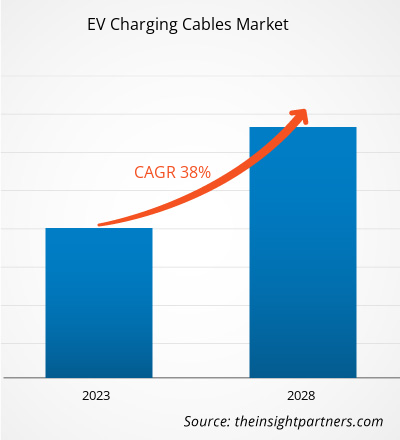
[Forschungsbericht] Der Markt für Ladekabel für Elektrofahrzeuge soll von 513,36 Millionen US-Dollar im Jahr 2022 auf 3.551,78 Millionen US-Dollar im Jahr 2028 wachsen. Von 2022 bis 2028 wird mit einer durchschnittlichen jährlichen Wachstumsrate von 38,0 % gerechnet.
Anreize mehrerer nationaler Regierungen dürften das Wachstum des europäischen Marktes für Ladekabel für Elektrofahrzeuge in den nächsten fünf Jahren vorantreiben. Europa ist eine der am schnellsten wachsenden Regionen des Marktes für Elektrofahrzeuge: Laut der Internationalen Energieagentur (IEA) betrug die durchschnittliche jährliche Wachstumsrate von 60 % von 2016 bis 2020, verglichen mit Zuwächsen von 36 % in China und 17 % in den USA. In Deutschland, dem größten Markt der EU, wurden mehrere Maßnahmen ergriffen, um die Größe des Marktes für Ladekabel für Elektrofahrzeuge zu steigern. Gemäß dieser Maßnahme sind alle bis Ende 2020 zugelassenen Elektrofahrzeuge in Privatbesitz 10 Jahre lang von der Steuer befreit, und Elektrofahrzeuge mit einem Verkaufspreis unter 45.300 US-Dollar haben bis Dezember 2021 Anspruch auf einen Zuschuss von 10.100 US-Dollar. Spanien hat die Steuer für Elektrofahrzeuge in Großstädten wie Madrid und Barcelona um 75 % gesenkt. Das Land hat außerdem ein Programm eingeführt, das den Kauf von Elektrofahrzeugen mit 4.067–5.083 USD subventioniert, je nachdem, ob ein Fahrzeug, das sieben Jahre oder älter ist, verschrottet wird. In Italien sind Elektrofahrzeuge ab der Zulassung fünf Jahre lang steuerfrei und erhalten danach eine Steuerermäßigung von 75 %. Italien hat auch ein Bonus-Malus-Programm. Gemäß diesem Programm werden Fahrzeuge, die weniger als 70 g CO2/km ausstoßen, mit bis zu 6.100 USD pro Auto subventioniert, jedoch mit 2.541 USD pro Auto bestraft, wenn sie mehr als 250 g CO2/km ausstoßen. Solche Initiativen europäischer Länder treiben die Einführung von Elektrofahrzeugen voran und beflügeln letztendlich das Wachstum des Marktes für Ladekabel für Elektrofahrzeuge in der Region.
Darüber hinaus unternimmt Europa beispiellose Schritte, um Benzin- und Dieselautos aus dem Verkehr zu ziehen und die fast 150 Jahre währende Ära des Verbrennungsmotors zu beenden. Das Verbot dieser konventionellen Autos in Großbritannien bis 2030 und die vierjährige Verlängerung der Subventionen für Elektrofahrzeuge in Deutschland spiegeln den Anreizansatz wider, den die Regierungen verfolgen, um die Automobilhersteller zur Elektrifizierung zu bewegen. Der regulatorische Druck hat bereits dazu beigetragen, dass Elektrofahrzeuge in Europa einen größeren Anteil am Autoabsatz einnehmen als in jedem anderen entwickelten Automarkt der Welt, wodurch das Wachstum des Marktes für Ladekabel für Elektrofahrzeuge zugenommen hat. Um die Kostenlücke zwischen Elektrofahrzeugen und konventionellen Autos zu schließen, bieten nationale oder lokale Regierungen in Europa außerdem häufig Verbraucheranreize in Form von einmaligen Subventionen, Steuererleichterungen beim Kauf und Betrieb von Fahrzeugen oder bevorzugtem oder kostenlosem Zugang zu bestimmten Straßeninfrastrukturen. Außerdem hat die Europäische Union (EU) Anfang 2019 Vorschriften verabschiedet, die die Installation von Ladegeräten für Elektroautos in jedem neuen Haus oder Apartmentgebäude vorschreiben. Dieser Schritt wurde als entscheidend für den Erfolg der Einführung von Elektrofahrzeugen angesehen. In den führenden europäischen Märkten zeichnen sich unterschiedliche Muster öffentlicher Ladeinfrastrukturen ab, was den Marktanteil von Ladekabeln für Elektrofahrzeuge in der Region im Prognosezeitraum erhöhen dürfte.
Passen Sie diesen Bericht Ihren Anforderungen an
Sie erhalten kostenlos individuelle Anpassungen an jedem Bericht, einschließlich Teilen dieses Berichts oder einer Analyse auf Länderebene, eines Excel-Datenpakets sowie tolle Angebote und Rabatte für Start-ups und Universitäten.
- Holen Sie sich die wichtigsten Markttrends aus diesem Bericht.Dieses KOSTENLOSE Beispiel umfasst eine Datenanalyse von Markttrends bis hin zu Schätzungen und Prognosen.
Auswirkungen der COVID-19-Pandemie auf den Markt für EV-Ladekabel
Im Jahr 2020 waren die Auswirkungen der COVID-19-Pandemie in ganz Europa von Land zu Land unterschiedlich. In der Region waren Großbritannien, Italien, Russland, Frankreich, Deutschland und Spanien am stärksten von der Pandemie betroffen. Aufgrund der steigenden Zahl registrierter Fälle mussten einige dieser Länder 2020 strenge und längere Lockdowns und soziale Isolation verhängen. Der Lockdown beeinträchtigte die Verkäufe von Elektroautos, es gab jedoch erste Anzeichen für eine Widerstandsfähigkeit des Marktes für Elektrofahrzeuge, und zwar aus zwei Hauptgründen. Erstens war die politische Unterstützung stark, insbesondere in Europa, da 2020 ein wichtiges Zieljahr für Emissionsstandards war. Die Kaufanreize nahmen zu, vor allem in Deutschland. Zweitens sinken die Batteriekosten weiter, da modernisierte Erstausrüster (OEMs) Modellauswahl und Leistung bieten, Flottenbetreiber ihren Technologiewandel einleiten und die Begeisterung der Käufer von Elektroautos (oft wohlhabende Haushalte, die vom wirtschaftlichen Abschwung weniger betroffen sind) einen fruchtbaren Boden für die weitere Verbreitung von Elektrofahrzeugen bietet.
Markteinblicke – Markt für EV-Ladekabel
Der Markt für Ladekabel für Elektrofahrzeuge wurde vom Rest der Welt dominiert. Europa leistet den zweitgrößten Beitrag zum Markt, gefolgt von Nordamerika.
In Nordamerika treiben die steigende Nachfrage von Elektrofahrzeugbesitzern nach kürzeren Ladezeiten für Elektrofahrzeuge und das steigende Interesse und die Entwicklung verschiedener öffentlicher und privater Marktteilnehmer in der Region die Größe des Marktes für Ladekabel für Elektrofahrzeuge voran. Beispielsweise plante Xcel Energy im Jahr 2020, 110 Millionen US-Dollar zu investieren, um bis 2030 eine Marktdurchdringung von 20 % für Elektrofahrzeuge in Colorado vorzubereiten. Im Jahr 2020 kündigten Uber und Lyft an, bis 2030 zu 100 % elektrisch zu sein. Kalifornien und Massachusetts beabsichtigen, bis 2035 einen Absatz von 100 % Elektrofahrzeugen vorzuschreiben. Außerdem sieht die Wiedergenehmigung der US-Autobahnen, der amerikanische Transportation Infrastructure Act von 2019, Kapital für die öffentliche Ladeinfrastruktur für Elektrofahrzeuge vor. Daher würde eine Erhöhung der staatlichen Mittel für den Ausbau der öffentlichen Ladeinfrastruktur das Wachstum der Elektrofahrzeugmärkte vorantreiben und letztendlich den Marktanteil der Ladekabel für Elektrofahrzeuge stärken.
Erkenntnisse auf Basis der Kabellänge
Basierend auf der Kabellänge ist der Markt für EV-Ladekabel in 2–5 Meter, 6–10 Meter und >10 Meter unterteilt. Im Jahr 2021 dominierte das 2-5-Meter-Segment den Markt für EV-Ladekabel. Es besteht eine hohe Nachfrage nach 2–5 Meter langen Kabeln in Haushalten und an Ladestationen, wo die Fläche der Station klein ist. Außerdem wird erwartet, dass dasselbe Segment im Prognosezeitraum seine Dominanz behält.
Coroplast Group; Sinbon Electronics Co., Ltd.; TE Connectivity; Phoneix Contact; Besen International Group Co., Ltd.; Dyden Corporation; Teison Energy Technology Co., Ltd.; General Cable Technologies Corporation; System Wire Cable; Aptiv; Leoni AG; Brugg eConnect; Ionity Gmbh; Chengdu Khons Technology Co., Ltd. gehören zu den Unternehmen, die in der Marktstudie für Ladekabel für Elektrofahrzeuge vorgestellt werden. Zusätzlich zu diesen Akteuren wurden im Rahmen der Marktstudie mehrere prominente globale und regionale Unternehmen, aufstrebende Akteure, Marktdisruptoren und Nischenmarktakteure analysiert.
Regionale Einblicke in den Markt für Ladekabel für Elektrofahrzeuge
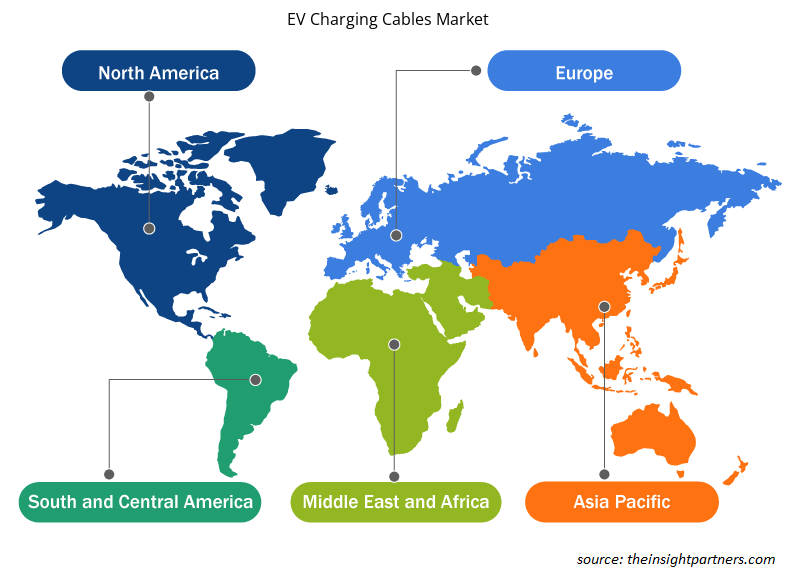
Die regionalen Trends und Faktoren, die den Markt für Ladekabel für Elektrofahrzeuge im Prognosezeitraum beeinflussen, wurden von den Analysten von Insight Partners ausführlich erläutert. In diesem Abschnitt werden auch die Marktsegmente und die Geografie für Ladekabel für Elektrofahrzeuge in Nordamerika, Europa, im asiatisch-pazifischen Raum, im Nahen Osten und Afrika sowie in Süd- und Mittelamerika erörtert.

- Holen Sie sich die regionalen Daten für den Markt für Ladekabel für Elektrofahrzeuge
Umfang des Marktberichts zu Ladekabeln für Elektrofahrzeuge
| Berichtsattribut | Details |
|---|---|
| Marktgröße im Jahr 2022 | 513,36 Millionen US-Dollar |
| Marktgröße bis 2028 | 3.551,78 Millionen US-Dollar |
| Globale CAGR (2022 - 2028) | 38,0 % |
| Historische Daten | 2020-2021 |
| Prognosezeitraum | 2023–2028 |
| Abgedeckte Segmente | Nach Anwendung
|
| Abgedeckte Regionen und Länder | Nordamerika
|
| Marktführer und wichtige Unternehmensprofile |
|
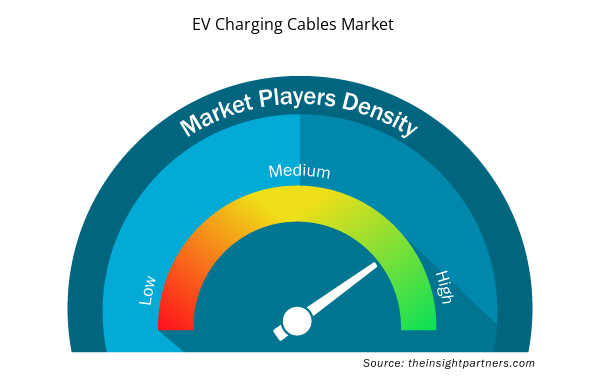
Marktteilnehmerdichte für Ladekabel für Elektrofahrzeuge: Auswirkungen auf die Geschäftsdynamik verstehen
Der Markt für Ladekabel für Elektrofahrzeuge wächst rasant. Dies wird durch die steigende Nachfrage der Endnutzer aufgrund von Faktoren wie sich entwickelnden Verbraucherpräferenzen, technologischen Fortschritten und einem größeren Bewusstsein für die Vorteile des Produkts vorangetrieben. Mit steigender Nachfrage erweitern Unternehmen ihr Angebot, entwickeln Innovationen, um die Bedürfnisse der Verbraucher zu erfüllen, und nutzen neue Trends, was das Marktwachstum weiter ankurbelt.
Die Marktteilnehmerdichte bezieht sich auf die Verteilung der Firmen oder Unternehmen, die in einem bestimmten Markt oder einer bestimmten Branche tätig sind. Sie gibt an, wie viele Wettbewerber (Marktteilnehmer) in einem bestimmten Marktraum im Verhältnis zu seiner Größe oder seinem gesamten Marktwert präsent sind.
Die wichtigsten auf dem Markt für Ladekabel für Elektrofahrzeuge tätigen Unternehmen sind:
- Besen International Group Co., Ltd.
- Coroplast Gruppe
- Dyden Corporation
- General Cable Technologies Corporation
- Phoenix Contact E-Mobilität
Haftungsausschluss : Die oben aufgeführten Unternehmen sind nicht in einer bestimmten Reihenfolge aufgeführt.

- Erhalten Sie einen Überblick über die wichtigsten Akteure auf dem Markt für Ladekabel für Elektrofahrzeuge
Die Marktteilnehmer für Ladekabel für Elektrofahrzeuge verfolgen hauptsächlich die Strategie der Marktinitiativen, die die Ausweitung der Präsenz weltweit und die Erfüllung der steigenden Kundennachfrage beinhaltet. Die Marktteilnehmer konzentrieren sich hauptsächlich auf Produkt- und Serviceverbesserungen, indem sie fortschrittliche Funktionen und Technologien in ihre Angebote integrieren.
- Im Februar 2022 kündigte das US-Verkehrsministerium seine Pläne an, den US-Bundesstaaten in den nächsten fünf Jahren 5 Milliarden US-Dollar für den Aufbau einer Ladeinfrastruktur für Elektrofahrzeuge entlang des US-Autobahnsystems zur Verfügung zu stellen.
- Historische Analyse (2 Jahre), Basisjahr, Prognose (7 Jahre) mit CAGR
- PEST- und SWOT-Analyse
- Marktgröße Wert/Volumen – Global, Regional, Land
- Branche und Wettbewerbsumfeld
- Excel-Datensatz


Report Coverage
Revenue forecast, Company Analysis, Industry landscape, Growth factors, and Trends

Segment Covered
This text is related
to segments covered.

Regional Scope
North America, Europe, Asia Pacific, Middle East & Africa, South & Central America

Country Scope
This text is related
to country scope.
Häufig gestellte Fragen
The incremental growth of the EV charging cables market for the RoW region is USD $1,551.76 million.
The private segment led the EV charging cables market in 2021.
The rest of the world is the fastest-growing regional market in the global EV charging cables market in 2021.
The key players holding the major market share of the EV charging cables market are Leoni AG, TE Connectivity, BESEN, Aptiv, and Coroplast.
The global EV charging cables market size is projected to reach US$ 3,551.78 million by 2028.
The global EV charging cables market is expected to be valued at US$ 513.36 million in 2022
The Future trends impacting the EV charging cables market are -- Emergence of E-Mobility and Advanced Charging Technologies
The driving factors impacting the EV charging cables market are
I. Surge in EV Vehicle Production
II. Increase in EV Charging Facilities
Trends and growth analysis reports related to Electronics and Semiconductor : READ MORE..
The List of Companies - EV Charging Cable Market
- Besen International Group Co., Ltd.
- Coroplast Group
- Dyden Corporation
- General Cable Technologies Corporation
- Phoenix Contact E-Mobility
- Sinbon Electronics Co., Ltd.
- Systems Wire and Cable
- TE Connectivity
- Teison Energy Technology Co., Ltd.
- Aptiv
- Leoni AG
- BRUGG eConnect
- Ionity GmbH
- Chengdu Khons Technology Co., Ltd
The Insight Partners performs research in 4 major stages: Data Collection & Secondary Research, Primary Research, Data Analysis and Data Triangulation & Final Review.
- Data Collection and Secondary Research:
As a market research and consulting firm operating from a decade, we have published and advised several client across the globe. First step for any study will start with an assessment of currently available data and insights from existing reports. Further, historical and current market information is collected from Investor Presentations, Annual Reports, SEC Filings, etc., and other information related to company’s performance and market positioning are gathered from Paid Databases (Factiva, Hoovers, and Reuters) and various other publications available in public domain.
Several associations trade associates, technical forums, institutes, societies and organization are accessed to gain technical as well as market related insights through their publications such as research papers, blogs and press releases related to the studies are referred to get cues about the market. Further, white papers, journals, magazines, and other news articles published in last 3 years are scrutinized and analyzed to understand the current market trends.
- Primary Research:
The primarily interview analysis comprise of data obtained from industry participants interview and answers to survey questions gathered by in-house primary team.
For primary research, interviews are conducted with industry experts/CEOs/Marketing Managers/VPs/Subject Matter Experts from both demand and supply side to get a 360-degree view of the market. The primary team conducts several interviews based on the complexity of the markets to understand the various market trends and dynamics which makes research more credible and precise.
A typical research interview fulfils the following functions:
- Provides first-hand information on the market size, market trends, growth trends, competitive landscape, and outlook
- Validates and strengthens in-house secondary research findings
- Develops the analysis team’s expertise and market understanding
Primary research involves email interactions and telephone interviews for each market, category, segment, and sub-segment across geographies. The participants who typically take part in such a process include, but are not limited to:
- Industry participants: VPs, business development managers, market intelligence managers and national sales managers
- Outside experts: Valuation experts, research analysts and key opinion leaders specializing in the electronics and semiconductor industry.
Below is the breakup of our primary respondents by company, designation, and region:

Once we receive the confirmation from primary research sources or primary respondents, we finalize the base year market estimation and forecast the data as per the macroeconomic and microeconomic factors assessed during data collection.
- Data Analysis:
Once data is validated through both secondary as well as primary respondents, we finalize the market estimations by hypothesis formulation and factor analysis at regional and country level.
- Macro-Economic Factor Analysis:
We analyse macroeconomic indicators such the gross domestic product (GDP), increase in the demand for goods and services across industries, technological advancement, regional economic growth, governmental policies, the influence of COVID-19, PEST analysis, and other aspects. This analysis aids in setting benchmarks for various nations/regions and approximating market splits. Additionally, the general trend of the aforementioned components aid in determining the market's development possibilities.
- Country Level Data:
Various factors that are especially aligned to the country are taken into account to determine the market size for a certain area and country, including the presence of vendors, such as headquarters and offices, the country's GDP, demand patterns, and industry growth. To comprehend the market dynamics for the nation, a number of growth variables, inhibitors, application areas, and current market trends are researched. The aforementioned elements aid in determining the country's overall market's growth potential.
- Company Profile:
The “Table of Contents” is formulated by listing and analyzing more than 25 - 30 companies operating in the market ecosystem across geographies. However, we profile only 10 companies as a standard practice in our syndicate reports. These 10 companies comprise leading, emerging, and regional players. Nonetheless, our analysis is not restricted to the 10 listed companies, we also analyze other companies present in the market to develop a holistic view and understand the prevailing trends. The “Company Profiles” section in the report covers key facts, business description, products & services, financial information, SWOT analysis, and key developments. The financial information presented is extracted from the annual reports and official documents of the publicly listed companies. Upon collecting the information for the sections of respective companies, we verify them via various primary sources and then compile the data in respective company profiles. The company level information helps us in deriving the base number as well as in forecasting the market size.
- Developing Base Number:
Aggregation of sales statistics (2020-2022) and macro-economic factor, and other secondary and primary research insights are utilized to arrive at base number and related market shares for 2022. The data gaps are identified in this step and relevant market data is analyzed, collected from paid primary interviews or databases. On finalizing the base year market size, forecasts are developed on the basis of macro-economic, industry and market growth factors and company level analysis.
- Data Triangulation and Final Review:
The market findings and base year market size calculations are validated from supply as well as demand side. Demand side validations are based on macro-economic factor analysis and benchmarks for respective regions and countries. In case of supply side validations, revenues of major companies are estimated (in case not available) based on industry benchmark, approximate number of employees, product portfolio, and primary interviews revenues are gathered. Further revenue from target product/service segment is assessed to avoid overshooting of market statistics. In case of heavy deviations between supply and demand side values, all thes steps are repeated to achieve synchronization.
We follow an iterative model, wherein we share our research findings with Subject Matter Experts (SME’s) and Key Opinion Leaders (KOLs) until consensus view of the market is not formulated – this model negates any drastic deviation in the opinions of experts. Only validated and universally acceptable research findings are quoted in our reports.
We have important check points that we use to validate our research findings – which we call – data triangulation, where we validate the information, we generate from secondary sources with primary interviews and then we re-validate with our internal data bases and Subject matter experts. This comprehensive model enables us to deliver high quality, reliable data in shortest possible time.


 Holen Sie sich ein kostenloses Muster für diesen Bericht