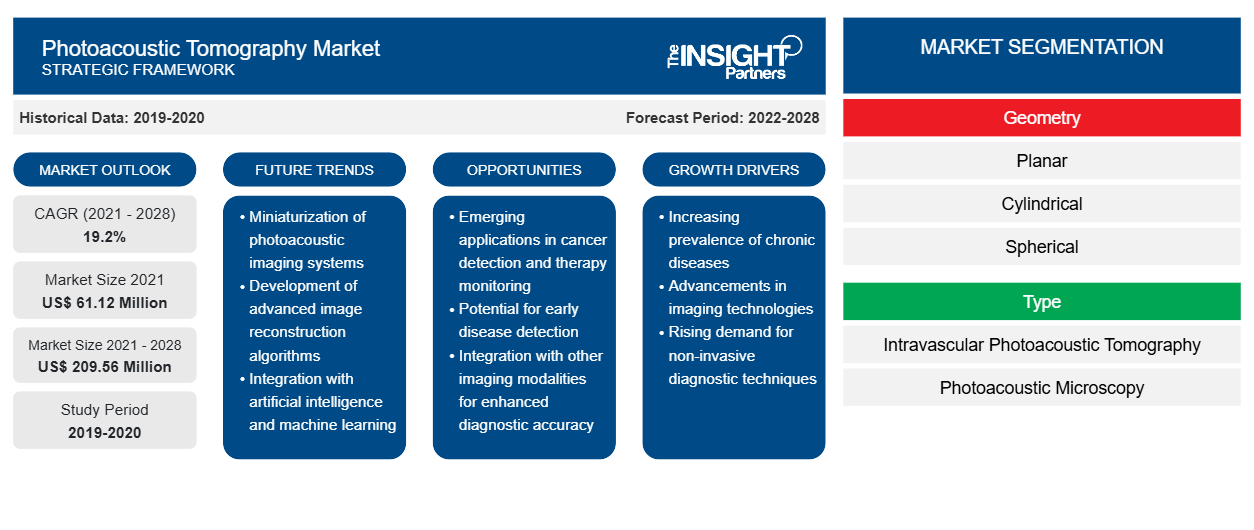
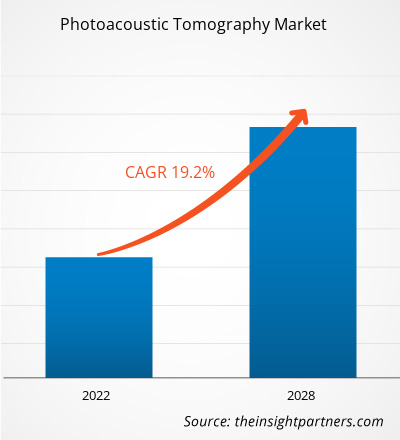
Der Markt für photoakustische Tomographie soll von 61,12 Millionen US-Dollar im Jahr 2021 auf 209,56 Millionen US-Dollar im Jahr 2028 anwachsen; von 2021 bis 2028 wird mit einer durchschnittlichen jährlichen Wachstumsrate von 19,2 % gerechnet.
Die photoakustische Tomographie ist eine Art biomedizinisches Bildgebungsverfahren, das die Kombination von optischer und Ultraschalltechnologie nutzt, um Bilder von biologischem Gewebe zu erhalten, ohne ionisierende Strahlung zu verwenden oder Gewebe zu entfernen. Die Tomographie-Bildgebungstechnik in vivo kann für Anwendungen wie die Überwachung der Tumorangiogenese, die Kartierung der Blutsauerstoffversorgung, die Erkennung von Hautmelanomen, die funktionelle Gehirnbildgebung und die Methämoglobinmessung verwendet werden.
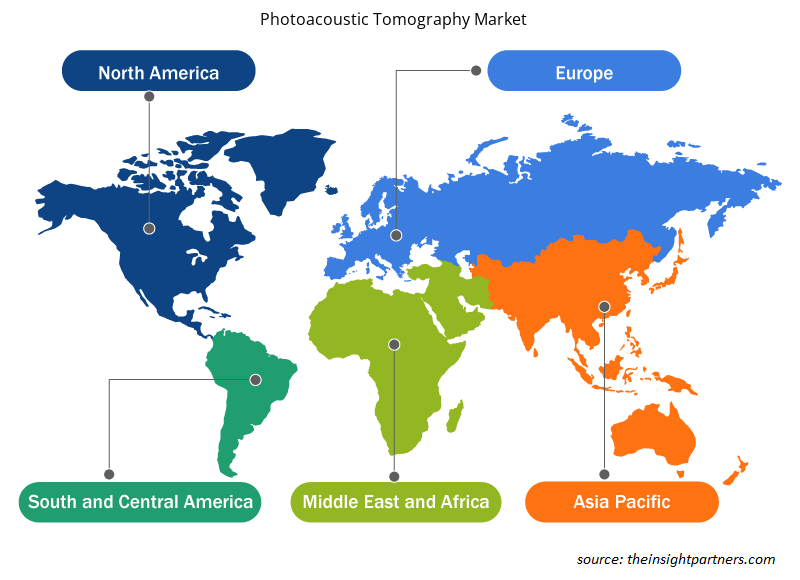
Der Markt für photoakustische Tomographie ist nach Geometrie, Typ, Anwendung, Endbenutzer und Geografie segmentiert. Der Markt ist geografisch grob in Nordamerika, Europa, Asien-Pazifik, den Nahen Osten und Afrika sowie Süd- und Mittelamerika unterteilt. Der Marktbericht zur photoakustischen Tomographie bietet Einblicke und eine eingehende Analyse des Marktes und betont Parameter wie Marktgröße, Trends, technologische Fortschritte und Marktdynamik sowie die Analyse der Wettbewerbslandschaft der weltweit führenden Marktteilnehmer.
Passen Sie diesen Bericht Ihren Anforderungen an
Sie erhalten kostenlos individuelle Anpassungen an jedem Bericht, einschließlich Teilen dieses Berichts oder einer Analyse auf Länderebene, eines Excel-Datenpakets sowie tolle Angebote und Rabatte für Start-ups und Universitäten.
- Holen Sie sich die wichtigsten Markttrends aus diesem Bericht.Dieses KOSTENLOSE Beispiel umfasst eine Datenanalyse von Markttrends bis hin zu Schätzungen und Prognosen.
Das Wachstum des Marktes für photoakustische Tomographie ist auf die Zunahme präklinischer Studien zur photoakustischen Tomographie in mehreren akademischen und Forschungsinstituten sowie auf Fortschritte bei der Bildgebungstechnik der photoakustischen Tomographie zurückzuführen. Die hohen Kosten der Geräte und ihrer Installation schränken das Marktwachstum jedoch ein.
Markteinblicke:
Die zunehmende Zahl kardiovaskulärer Erkrankungen fördert das Wachstum des Marktes für photoakustische Tomographie
Arteriosklerose ist die Verdickung oder Verhärtung der Arterien, die durch die Bildung von Plaques in der Innenauskleidung einer Arterie verursacht wird. Die Plaques bestehen aus Ablagerungen von Cholesterin, Fettsubstanzen, zellulären Abfallprodukten, Fibrin und Kalzium und behindern den Blutfluss, da sie die Arterien durch Ablagerungen an ihren Wänden verstopfen. Diese Verstopfung kann zu verschiedenen Herz-Kreislauf-Erkrankungen (CVDs) führen. Laut Angaben der Weltgesundheitsorganisation (WHO) gelten CVDs als weltweit häufigste Todesursache und fordern jedes Jahr etwa 17,9 Millionen Menschenleben. Mehr als vier von fünf CVD-Todesfällen sind auf Herzinfarkte und Schlaganfälle zurückzuführen, und ein Drittel dieser Todesfälle tritt vorzeitig bei Menschen unter 70 Jahren ein. Laut den Centers for Disease Control and Prevention (CDC) erleidet in den USA alle 40 Sekunden jemand einen Herzinfarkt, und jedes Jahr erleiden in den USA etwa 805.000 Menschen einen Herzinfarkt. Laut der American Heart Association litten in den USA zwischen 2015 und 2018 126,9 Millionen Erwachsene an irgendeiner Form von Herz-Kreislauf-Erkrankung. Darüber hinaus beliefen sich die direkten und indirekten Kosten für Herz-Kreislauf-Erkrankungen im Land zwischen 2017 und 2018 auf insgesamt 378,0 Milliarden US-Dollar (226,2 Milliarden US-Dollar direkte Kosten und 151,8 Milliarden US-Dollar indirekte Kosten aufgrund von Produktivitätsverlusten/Sterblichkeit).CVDs). According to the World Health Organization (WHO) data, CVDs are considered the leading cause of death worldwide, taking approximately 17.9 million lives every year. More than four out of five CVD deaths are due to CVD. Additionally, during 2017–2018, direct and indirect costs of total CVD to the country summed up to US$ 378.0 billion (US$ 226.2. billion in direct costs and US$ 151.8 billion in indirect costs due to lost productivity/mortality).
Darüber hinaus werden verschiedene Technologien wie Angiographie, intravaskulärer Ultraschall (IVUS) und intravaskuläre photoakustische Tomographie zur Erkennung von Herz-Kreislauf-Erkrankungen eingesetzt. Die IVUS-Bildgebung, die kombinierte IVPA- und IVUS-Bildgebung können zur Erkennung und Charakterisierung atherosklerotischer Plaques verwendet werden. Die IVPA-Tomographie bietet gegenüber anderen Techniken verschiedene Vorteile bei der Bildgebung atherosklerotischer Plaques. Durch die Analyse der photoakustischen Reaktionen der Gefäßwand bei mehreren Wellenlängen ist es möglich, zwischen verschiedenen Gewebe-/Zelltypen zu unterscheiden. Mit einem Hochfrequenzwandler kann das photoakustische Signal mit einer räumlichen Auflösung in der Größenordnung von einigen zehn Mikrometern aufgelöst werden – eine solche Auflösung ist für die Erkennung anfälliger Plaques geeignet.angiography, ultrasound (IVUS)intravascular photoacoustic tomography, are used to detect CVDs. The IVUS imaging, combined IVPA, and IVUS imaging can be used to detect and characterize atherosclerotic plaques. The IVPA tomography offers various advantages in atherosclerotic plaque imaging over other techniques. Analyzing the multi-wavelength photoacoustic responses of the vessel wall makes it possible to discriminate between different tissue/cell types. With a high-frequency transducer, the photoacoustic signal can be resolved with a spatial resolution in the order of a few tens of micrometers—such resolution is appropriate for the detection of vulnerable plaques.
Geometriebasierte Erkenntnisse
Der Markt für photoakustische Tomographie ist basierend auf der Geometrie in planare, zylindrische und sphärische Segmente unterteilt. Das planare Segment hatte 2021 den größten Marktanteil. Es wird jedoch erwartet, dass das sphärische Segment im Prognosezeitraum die höchste durchschnittliche jährliche Wachstumsrate verzeichnet.photoacoustic tomography market, based on geometry, is segmented into planar, cylindrical, and spherical. The planar segment held the largest share of the market in 2021. However, the spherical segment is anticipated to register the highest CAGR during the forecast period.
Typbasierte Erkenntnisse
Der Markt für photoakustische Tomographie ist je nach Typ in intravaskuläre photoakustische Tomographie, photoakustische Mikroskopie und andere unterteilt. Das Segment der intravaskulären photoakustischen Tomographie hatte im Jahr 2021 den größten Marktanteil. Darüber hinaus wird erwartet, dass es im Prognosezeitraum die höchste durchschnittliche jährliche Wachstumsrate verzeichnet.photoacoustic tomography market, based on type, is segmented into intravascular photoacoustic tomography, photoacoustic microscopy, and others. The intravascular photoacoustic tomography segment held the largest share of the market in 2021. It is further anticipated to register the highest CAGR during the forecast period.
Anwendungsbasierte Erkenntnisse
Der Markt für photoakustische Tomographie ist je nach Anwendung in Tumorangiogenese, Blutsauerstoffkartierung, funktionelle Gehirnbildgebung, Hautmelanomerkennung, Methämoglobinmessung und andere unterteilt. Das Segment Tumorangiogenese hatte 2021 den größten Marktanteil. Es wird jedoch erwartet, dass das Segment Blutsauerstoffkartierung im Prognosezeitraum die höchste durchschnittliche jährliche Wachstumsrate verzeichnet.photoacoustic tomography market, based on application, is segmented into tumor angiogenesis, blood oxygenation mapping, functional brain imaging, skin melanoma detection, methemoglobin measuring, and others. The tumor angiogenesis segment held the largest market share in 2021. However, the blood oxygenation mapping segment is anticipated to register the highest CAGR during the forecast period.
Endbenutzerbasierte Erkenntnisse
Der Markt für photoakustische Tomographie ist nach Endverbrauchern segmentiert in Krankenhäuser, Zentren für diagnostische Bildgebung, akademische und Forschungsinstitute und andere. Das Krankenhaussegment hatte 2021 den größten Marktanteil. Es wird jedoch erwartet, dass das Segment der Zentren für diagnostische Bildgebung im Prognosezeitraum die höchste durchschnittliche jährliche Wachstumsrate verzeichnet.photoacoustic tomography market, based on end user, is segmented into hospitals, diagnostics imaging centers, academic and research institutes, and others. The hospital segment held the largest market share in 2021. However, the diagnostics imaging centers segment is anticipated to register the highest CAGR during the forecast period.
Photoakustische Tomographie
Regionale Einblicke in den Markt für photoakustische Tomographie
Die regionalen Trends und Faktoren, die den Markt für photoakustische Tomographie im Prognosezeitraum beeinflussen, wurden von den Analysten von Insight Partners ausführlich erläutert. In diesem Abschnitt werden auch die Marktsegmente und die Geografie der photoakustischen Tomographie in Nordamerika, Europa, im asiatisch-pazifischen Raum, im Nahen Osten und Afrika sowie in Süd- und Mittelamerika erörtert.

- Erhalten Sie regionale Daten zum Markt für photoakustische Tomographie
Umfang des Marktberichts zur photoakustischen Tomographie
| Berichtsattribut | Details |
|---|---|
| Marktgröße im Jahr 2021 | 61,12 Millionen US-Dollar |
| Marktgröße bis 2028 | 209,56 Millionen US-Dollar |
| Globale CAGR (2021 - 2028) | 19,2 % |
| Historische Daten | 2019-2020 |
| Prognosezeitraum | 2022–2028 |
| Abgedeckte Segmente | Nach Geometrie
|
| Abgedeckte Regionen und Länder | Nordamerika
|
| Marktführer und wichtige Unternehmensprofile |
|
Dichte der Marktteilnehmer im Bereich photoakustische Tomographie: Die Auswirkungen auf die Geschäftsdynamik verstehen
Der Markt für photoakustische Tomographie wächst rasant, angetrieben durch die steigende Nachfrage der Endnutzer aufgrund von Faktoren wie sich entwickelnden Verbraucherpräferenzen, technologischen Fortschritten und einem größeren Bewusstsein für die Vorteile des Produkts. Mit steigender Nachfrage erweitern Unternehmen ihr Angebot, entwickeln Innovationen, um die Bedürfnisse der Verbraucher zu erfüllen, und nutzen neue Trends, was das Marktwachstum weiter ankurbelt.
Die Marktteilnehmerdichte bezieht sich auf die Verteilung der Firmen oder Unternehmen, die in einem bestimmten Markt oder einer bestimmten Branche tätig sind. Sie gibt an, wie viele Wettbewerber (Marktteilnehmer) in einem bestimmten Marktraum im Verhältnis zu seiner Größe oder seinem gesamten Marktwert präsent sind.
Die wichtigsten auf dem Markt für photoakustische Tomographie tätigen Unternehmen sind:
- FUJIFILM Visualsonics Inc.
- TomoWave Laboratories, Inc.
- Advantest Corporation
- Kibero
- Aspectus GmbH
Haftungsausschluss : Die oben aufgeführten Unternehmen sind nicht in einer bestimmten Reihenfolge aufgeführt.

- Überblick über die wichtigsten Akteure auf dem Markt für photoakustische Tomographie
Produkteinführungen und -zulassungen gehören zu den häufig angewandten Strategien von Unternehmen, um ihre globale Präsenz und ihr Produktportfolio zu erweitern. Die Akteure auf dem Markt für photoakustische Tomographie konzentrieren sich auch auf die Partnerschaftsstrategie, um ihren Kundenstamm zu vergrößern, was ihnen wiederum ermöglicht, ihren Markennamen weltweit aufrechtzuerhalten. Sie zielen darauf ab, ihre Marktanteile durch die Entwicklung innovativer Produkte auszubauen. FUJIFILM Visualsonics Inc.; TomoWave Laboratories, Inc.; Advantest Corporation; kibero; Aspectus GmbH; iThera Medical GmbH; CYBERDYNE INC.; InnoLas Laser GmbH; OPOTEK LLC; und Seno Medical gehören zu den führenden Unternehmen auf dem Markt für photoakustische Tomographie.
- Historische Analyse (2 Jahre), Basisjahr, Prognose (7 Jahre) mit CAGR
- PEST- und SWOT-Analyse
- Marktgröße Wert/Volumen – Global, Regional, Land
- Branche und Wettbewerbsumfeld
- Excel-Datensatz


- Ceiling Fans Market
- Visualization and 3D Rendering Software Market
- Authentication and Brand Protection Market
- Explosion-Proof Equipment Market
- Radiopharmaceuticals Market
- Hydrogen Compressors Market
- Pharmacovigilance and Drug Safety Software Market
- Europe Surety Market
- Antibiotics Market
- Volumetric Video Market

Report Coverage
Revenue forecast, Company Analysis, Industry landscape, Growth factors, and Trends

Segment Covered
This text is related
to segments covered.

Regional Scope
North America, Europe, Asia Pacific, Middle East & Africa, South & Central America

Country Scope
This text is related
to country scope.
Häufig gestellte Fragen
FUJIFILM VisualSonics Inc., TomoWave Laboratories, Inc., Advantest Corporation, kibero, Seno Medical Instruments, iThera Medical GmbH, Aspectus GmbH, OPOTEK LLC., CYBERDYNE Inc., and InnoLas Laser GmbH are among the leading companies operating in the global photoacoustic tomography market.
Based on geometry, planar geometry segment took the forefront leaders in the worldwide market by accounting largest share in 2021 and is expected to continue to do so durting the forecast period.
Rising prevalence of cancer and growing instances of cardiovascular diseases are the most significant factors responsible for the overall market growth.
North America is the largest market and it is expected to be the biggest revenue generator throughout the forecast period.
Trends and growth analysis reports related to Life Sciences : READ MORE..
The List of Companies - Photoacoustic Tomography Market
- FUJIFILM Visualsonics Inc.
- TomoWave Laboratories, Inc.
- Advantest Corporation
- Kibero
- Aspectus GmbH
- iThera Medical GmbH
- CYBERDYNE INC.
- InnoLas Laser GmbH
- OPOTEK LLC
- Seno Medical
The Insight Partners performs research in 4 major stages: Data Collection & Secondary Research, Primary Research, Data Analysis and Data Triangulation & Final Review.
- Data Collection and Secondary Research:
As a market research and consulting firm operating from a decade, we have published and advised several client across the globe. First step for any study will start with an assessment of currently available data and insights from existing reports. Further, historical and current market information is collected from Investor Presentations, Annual Reports, SEC Filings, etc., and other information related to company’s performance and market positioning are gathered from Paid Databases (Factiva, Hoovers, and Reuters) and various other publications available in public domain.
Several associations trade associates, technical forums, institutes, societies and organization are accessed to gain technical as well as market related insights through their publications such as research papers, blogs and press releases related to the studies are referred to get cues about the market. Further, white papers, journals, magazines, and other news articles published in last 3 years are scrutinized and analyzed to understand the current market trends.
- Primary Research:
The primarily interview analysis comprise of data obtained from industry participants interview and answers to survey questions gathered by in-house primary team.
For primary research, interviews are conducted with industry experts/CEOs/Marketing Managers/VPs/Subject Matter Experts from both demand and supply side to get a 360-degree view of the market. The primary team conducts several interviews based on the complexity of the markets to understand the various market trends and dynamics which makes research more credible and precise.
A typical research interview fulfils the following functions:
- Provides first-hand information on the market size, market trends, growth trends, competitive landscape, and outlook
- Validates and strengthens in-house secondary research findings
- Develops the analysis team’s expertise and market understanding
Primary research involves email interactions and telephone interviews for each market, category, segment, and sub-segment across geographies. The participants who typically take part in such a process include, but are not limited to:
- Industry participants: VPs, business development managers, market intelligence managers and national sales managers
- Outside experts: Valuation experts, research analysts and key opinion leaders specializing in the electronics and semiconductor industry.
Below is the breakup of our primary respondents by company, designation, and region:

Once we receive the confirmation from primary research sources or primary respondents, we finalize the base year market estimation and forecast the data as per the macroeconomic and microeconomic factors assessed during data collection.
- Data Analysis:
Once data is validated through both secondary as well as primary respondents, we finalize the market estimations by hypothesis formulation and factor analysis at regional and country level.
- Macro-Economic Factor Analysis:
We analyse macroeconomic indicators such the gross domestic product (GDP), increase in the demand for goods and services across industries, technological advancement, regional economic growth, governmental policies, the influence of COVID-19, PEST analysis, and other aspects. This analysis aids in setting benchmarks for various nations/regions and approximating market splits. Additionally, the general trend of the aforementioned components aid in determining the market's development possibilities.
- Country Level Data:
Various factors that are especially aligned to the country are taken into account to determine the market size for a certain area and country, including the presence of vendors, such as headquarters and offices, the country's GDP, demand patterns, and industry growth. To comprehend the market dynamics for the nation, a number of growth variables, inhibitors, application areas, and current market trends are researched. The aforementioned elements aid in determining the country's overall market's growth potential.
- Company Profile:
The “Table of Contents” is formulated by listing and analyzing more than 25 - 30 companies operating in the market ecosystem across geographies. However, we profile only 10 companies as a standard practice in our syndicate reports. These 10 companies comprise leading, emerging, and regional players. Nonetheless, our analysis is not restricted to the 10 listed companies, we also analyze other companies present in the market to develop a holistic view and understand the prevailing trends. The “Company Profiles” section in the report covers key facts, business description, products & services, financial information, SWOT analysis, and key developments. The financial information presented is extracted from the annual reports and official documents of the publicly listed companies. Upon collecting the information for the sections of respective companies, we verify them via various primary sources and then compile the data in respective company profiles. The company level information helps us in deriving the base number as well as in forecasting the market size.
- Developing Base Number:
Aggregation of sales statistics (2020-2022) and macro-economic factor, and other secondary and primary research insights are utilized to arrive at base number and related market shares for 2022. The data gaps are identified in this step and relevant market data is analyzed, collected from paid primary interviews or databases. On finalizing the base year market size, forecasts are developed on the basis of macro-economic, industry and market growth factors and company level analysis.
- Data Triangulation and Final Review:
The market findings and base year market size calculations are validated from supply as well as demand side. Demand side validations are based on macro-economic factor analysis and benchmarks for respective regions and countries. In case of supply side validations, revenues of major companies are estimated (in case not available) based on industry benchmark, approximate number of employees, product portfolio, and primary interviews revenues are gathered. Further revenue from target product/service segment is assessed to avoid overshooting of market statistics. In case of heavy deviations between supply and demand side values, all thes steps are repeated to achieve synchronization.
We follow an iterative model, wherein we share our research findings with Subject Matter Experts (SME’s) and Key Opinion Leaders (KOLs) until consensus view of the market is not formulated – this model negates any drastic deviation in the opinions of experts. Only validated and universally acceptable research findings are quoted in our reports.
We have important check points that we use to validate our research findings – which we call – data triangulation, where we validate the information, we generate from secondary sources with primary interviews and then we re-validate with our internal data bases and Subject matter experts. This comprehensive model enables us to deliver high quality, reliable data in shortest possible time.


 Holen Sie sich ein kostenloses Muster für diesen Bericht