Wachstum, Größe, Anteil, Trends, Analyse der wichtigsten Akteure und Prognose des Photovoltaikmarktes bis 2027

  • Report Code : TIPTE100000386
  • Category : Electronics and Semiconductor
  • Status : Published
  • No. of Pages : 154
Buy Now


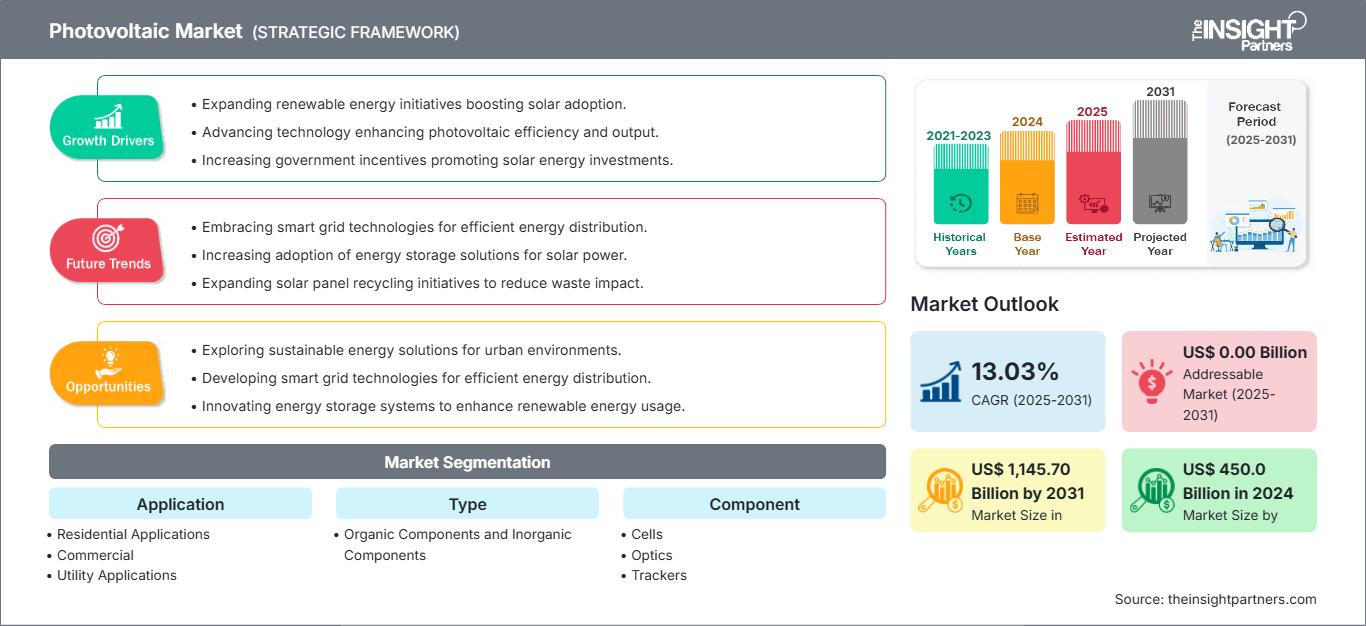
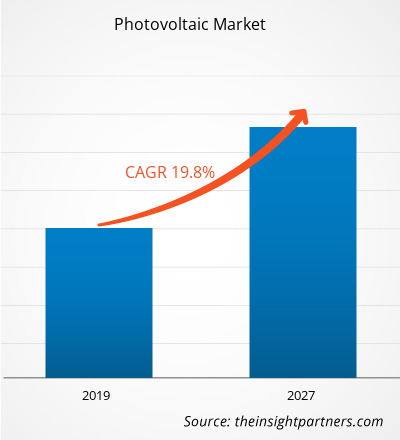
Der Photovoltaikmarkt soll von 153,9 Milliarden US-Dollar im Jahr 2018 auf 768,1 Milliarden US-Dollar im Jahr 2027 wachsen, was einer durchschnittlichen jährlichen Wachstumsrate (CAGR) von 19,8 % zwischen 2019 und 2027 entspricht.

Im Zuge der technologischen Entwicklung und der Fokussierung auf einen wachsenden Trend der Solar-PV-Technologie haben die deutsche und die spanische Regierung robuste politische Rahmenbedingungen wie klare nationale Ziele, attraktive Anreize zur Förderung des Verbrauchs und integrierte Pläne zur Förderung der technologischen Entwicklung und der Einführung der PV-Technologie in der Solarenergie geschaffen und so das Wachstum des Photovoltaikmarktes vorangetrieben. In der Region Asien-Pazifik wurden von den Regierungen mehrere Initiativen ergriffen, um die Kosten der Gesamtanlage zu minimieren und die weitreichenden Vorteile einer netzunabhängigen Option bei der Elektrifizierung ländlicher Gebiete zu maximieren. Gleichzeitig wurde der Fokus auf nachhaltige Umweltbedingungen gelegt. Darüber hinaus haben mehrere Länder, wie beispielsweise China, Richtlinien zur Steigerung des Produktionsniveaus von Photovoltaik- Solarstrom eingeführt . Die oben genannten Faktoren tragen also zum Wachstum des Photovoltaikmarktes bei.

Photovoltaik (PV)-Energie wächst rasant und trägt einen wesentlichen Teil zur Energiebilanz der Stromsysteme der Wirtschaft bei. Diese Systeme haben sich als ausgereifte Technologie etabliert, die für die allgemeine Stromerzeugung genutzt wird und das Wachstum des Photovoltaikmarktes vorantreibt. Solarbetriebene PV-Systeme erzeugen jedoch Strom im Überschuss. Stromversorger auf der ganzen Welt bieten eine Nettomessung an, bei der der überschüssige Strom, der von netzgekoppelten erneuerbaren Energiesystemen erzeugt wird , an den Stromzähler zurückgeführt wird. Dies vermeidet Verschwendung und verbessert die Energieverteilung je nach Bedarf. PV-Systeme mit Netztechnologie machen etwa 99 % der installierten Kapazität aus, verglichen mit eigenständigen Systemen, die Batterien benötigen. Batterielose netzgekoppelte PV gilt als kostengünstige Lösung und erfordert weniger Wartung, was die Einführung von PV-basierten Produkten fördert und somit den Marktanteil der Photovoltaik steigert.

Darüber hinaus gelten netzgekoppelte PV-Systeme für Menschen, die auf Solarmodule umsteigen, als kostengünstige Möglichkeit, ihren gesamten Strombedarf zu decken. Die Installation von Inselsystemen ist zudem recht mühsam und erfordert mehr Kapital und Platz als die von PV-Netzsystemen. Daher wird die zunehmende Nutzung von PV-Netzsystemen das Wachstum des Photovoltaikmarktes weiter vorantreiben . Da außerdem der Fokus zunehmend auf die Nutzung erneuerbarer Energien und den Trend zur Energieeinsparung gerichtet ist, erweisen sich netzgekoppelte PV-Systeme als wirtschaftlich tragfähige Option. Allerdings ist ihre Anwendbarkeit derzeit noch recht begrenzt und könnte in den kommenden Jahren zunehmen.


Passen Sie diesen Bericht Ihren Anforderungen an

Sie erhalten kostenlos individuelle Anpassungen an jedem Bericht, einschließlich Teilen dieses Berichts oder einer Analyse auf Länderebene, eines Excel-Datenpakets sowie tolle Angebote und Rabatte für Start-ups und Universitäten.

Photovoltaikmarkt:

Photovoltaic Market
  • Holen Sie sich die wichtigsten Markttrends aus diesem Bericht.
    Dieses KOSTENLOSE Beispiel umfasst eine Datenanalyse von Markttrends bis hin zu Schätzungen und Prognosen.


Einblicke in den Photovoltaikmarkt

Zunehmender Einsatz von Photovoltaikfarben zur Nutzung von Sonnenenergie

Die Volatilität der Rohölpreise, Umweltbedenken im Zusammenhang mit Wasserkraft und das mit nuklearer Strahlung verbundene Risiko haben die Last der Energieversorgung auf die Solarenergie verlagert. Die technologischen Fortschritte, der Fokus auf die Senkung der Installationskosten und die schnelle Nutzung der Photovoltaiktechnologie in Wohngebäuden gehören zu den Faktoren, die den Einsatz der Photovoltaiktechnologie neu definieren. Im Zeitalter der zunehmenden Nutzung von Solarenergie ist die Einführung von Solarfarben zu einer bemerkenswerten Errungenschaft geworden. Solarfarben, im Volksmund auch als Photovoltaikfarben bekannt, können auf jede Oberfläche aufgetragen werden, um Sonnenenergie einzufangen und in Elektrizität umzuwandeln. Die Bestandteile der Farbe werden mit Milliarden von darin suspendierten lichtempfindlichen Materialstücken kombiniert, was dazu beitragen könnte, eine normale Farbe in eine superstarke Energiegewinnungsfarbe zu verwandeln. Die Verwendung von Photovoltaikfarbe kann die Abhängigkeit von Metall effektiv verringern und eine Kombination aus pn-Übergangsdiodenprinzip und thermoelektrischem Effekt zur Erzeugung elektrischer Energie aus Sonneneinstrahlung nutzen. Dies wird zu einem Anstieg der Nutzung von Solarenergie führen und schließlich das Wachstum des Photovoltaikmarktes vorantreiben. Unternehmen wie die Onyx Solar Group LLC zielen auf die Entwicklung von Technologien ab, indem sie sich auf F&E-Aktivitäten konzentrieren und mit Instituten zusammenarbeiten, um Photovoltaikfarbe zu entwickeln und so das Wachstum des Photovoltaikmarktes voranzutreiben. Obwohl Solarfarben oder Photovoltaikfarbentechnologie derzeit noch in den Kinderschuhen stecken, werden sie wahrscheinlich in naher Zukunft an Bedeutung gewinnen. Mit dem Fortschreiten und der Weiterentwicklung der Solarindustrie hat Solarfarbe eine hervorragende Chance, eine vernünftige Option zu werden. Somit schaffen die oben genannten Faktoren eine Chance für den Photovoltaikmarkt.


Regionale Einblicke in den Photovoltaikmarkt

Die regionalen Trends und Faktoren, die den Photovoltaikmarkt im Prognosezeitraum beeinflussen, wurden von den Analysten von Insight Partners ausführlich erläutert. In diesem Abschnitt werden auch die Photovoltaikmarktsegmente und die Geografie in Nordamerika, Europa, im asiatisch-pazifischen Raum, im Nahen Osten und Afrika sowie in Süd- und Mittelamerika erörtert.

Photovoltaic Market
  • Erhalten Sie regionale Daten zum Photovoltaikmarkt

Umfang des Photovoltaik-Marktberichts

BerichtsattributDetails
Marktgröße im Jahr 2018153,9 Milliarden US-Dollar
Marktgröße bis 2027768,1 Milliarden US-Dollar
Globale CAGR (2018 - 2027)19,8 %
Historische Daten2016-2017
Prognosezeitraum2019–2027
Abgedeckte SegmenteNach Anwendung
  • Wohnanwendungen
  • Kommerziell
  • Utility-Anwendungen
Nach Typ
  • Organische Komponenten und anorganische Komponenten
Nach Komponente
  • Zellen
  • Optik
  • Tracker
Abgedeckte Regionen und LänderNordamerika
  • UNS
  • Kanada
  • Mexiko
Europa
  • Vereinigtes Königreich
  • Deutschland
  • Frankreich
  • Russland
  • Italien
  • Restliches Europa
Asien-Pazifik
  • China
  • Indien
  • Japan
  • Australien
  • Restlicher Asien-Pazifik-Raum
Süd- und Mittelamerika
  • Brasilien
  • Argentinien
  • Restliches Süd- und Mittelamerika
Naher Osten und Afrika
  • Südafrika
  • Saudi-Arabien
  • Vereinigte Arabische Emirate
  • Restlicher Naher Osten und Afrika
Marktführer und wichtige Unternehmensprofile
  •  
  • Mitsubishi Electric Corporation
  • Panasonic Corporation
  • Kaneka Corporation
  • KYOCERA Corporation
  • Sharp Corporation
  • JA Solar Co.,Ltd.
  • Renesola Co. Ltd
  • Trina Solar
  • Jinko Solar

Marktteilnehmerdichte: Der Einfluss auf die Geschäftsdynamik

Der Photovoltaikmarkt wächst rasant, angetrieben durch die steigende Nachfrage der Endverbraucher aufgrund von Faktoren wie sich entwickelnden Verbraucherpräferenzen, technologischen Fortschritten und einem größeren Bewusstsein für die Vorteile des Produkts. Mit steigender Nachfrage erweitern Unternehmen ihr Angebot, entwickeln Innovationen, um die Bedürfnisse der Verbraucher zu erfüllen, und nutzen neue Trends, was das Marktwachstum weiter ankurbelt.
Die Marktteilnehmerdichte bezieht sich auf die Verteilung der Firmen oder Unternehmen, die in einem bestimmten Markt oder einer bestimmten Branche tätig sind. Sie gibt an, wie viele Wettbewerber (Marktteilnehmer) in einem bestimmten Marktraum im Verhältnis zu seiner Größe oder seinem gesamten Marktwert präsent sind.

Die wichtigsten auf dem Photovoltaikmarkt tätigen Unternehmen sind:

  1. Mitsubishi Electric Corporation
  2. Panasonic Corporation
  3. Kaneka Corporation
  4. KYOCERA Corporation
  5. Sharp Corporation

Haftungsausschluss : Die oben aufgeführten Unternehmen sind nicht in einer bestimmten Reihenfolge aufgeführt.


Photovoltaic Market


  • Überblick über die wichtigsten Akteure auf dem Photovoltaikmarkt


Komponentenbasierte Markteinblicke

Photovoltaikzellen bestehen aus zwei oder mehr dünnen Schichten aus Halbleitermaterial. Das am häufigsten verwendete Material in Photovoltaikzellen ist Silizium. Die Halbleiterzellen werden Licht ausgesetzt, um elektrische Ladungen zu erzeugen. Diese können über Metallkontakte als Gleichstrom (DC) weitergeleitet werden. Daher wird die zunehmende Verbreitung von PV-Zellen den weltweiten Photovoltaikmarkt im Prognosezeitraum vergrößern.

Akteure auf dem Photovoltaikmarkt verfolgen Strategien wie Fusionen, Übernahmen und Marktinitiativen, um ihre Position auf dem Photovoltaikmarkt zu behaupten. Nachfolgend sind einige Entwicklungen der wichtigsten Akteure aufgeführt:

  • Im Jahr 2021 nahm Royal Dutch Shell PLC seine 25-Megawatt-Solaranlage Qabas in Betrieb. Das Projekt besteht aus über 88.000 Solarmodulen und befindet sich auf einem 50 Hektar großen Gelände in der Freihandelszone Sohar im Norden Omans. Es trägt dazu bei, rund 25.000 Tonnen CO2-Emissionen pro Jahr einzusparen.
  • Im Jahr 2021 wurde das 300 MW Sakaka PV IPP, das erste erneuerbare Energieprojekt des Landes im Versorgungsmaßstab, von ACWA Power zu einem Preis von 1,2 Milliarden Saudi-Riyal eingeweiht. ACWA Power erhielt den Auftrag zu einem Weltrekordtarif von 2,3417 US-Dollar Cent pro kWh (8,781 Halalas pro kWh).
  • Historical Analysis (2 Years), Base Year, Forecast (7 Years) with CAGR
  • PEST and SWOT Analysis
  • Market Size Value / Volume - Global, Regional, Country
  • Industry and Competitive Landscape
  • Excel Dataset
Report Coverage
Report Coverage

Revenue forecast, Company Analysis, Industry landscape, Growth factors, and Trends

Segment Covered
Segment Covered

This text is related
to segments covered.

Regional Scope
Regional Scope

North America, Europe, Asia Pacific, Middle East & Africa, South & Central America

Country Scope
Country Scope

This text is related
to country scope.

Frequently Asked Questions


What is the major driving factor to favor the 3D sensor market all over the globe?

Renewable energy is regarded as a clean form of energy obtained from natural sources, which can be continuously replenished. Energy derived from renewable sources such as sunlight, wind, tides, and geothermal heat are sustainable and cost-effective. With the increase in population coupled with a rise in industrialization and economic development, the energy requirements have grown consistently, which is posing a burden upon natural resources. For instance, in the US, about 29% of global warming emissions are contributed to the electricity sector. Such emissions are resulted from the utilization of fossil fuels such as coal and natural gas. Over-exploitation and depletion of natural resources along with environmental degradation have led to a shift over renewable forms of energy. The demand for electricity is associated with social and economic development that generates a requirement to shift to renewables in order to tackle climate change and promote sustainability of the environment while meeting energy demands of future generations. Renewable forms of energy generate little or no global warming emissions.

By Type, which was the leading segment to hold the largest share in the market and by what CAGR?

The leading type of photovoltaic type is inorganic components that has noted to account a CAGR of 22.3%. Organic components or solar cells are made of thin films of organic semiconducting materials so as to convert solar energy into electrical energy. A typical organic components device consists of one or more photoactive materials between two electrodes. A primary advantage of organic components technology over inorganic components is its ability to be applied in a large area and flexible solar modules.

Which was the region to account the largest share for the Photovoltaic market?

The Asia Pacific region led the photovoltaic market with a market share of 52.13%in 2018. Solar energy has brought significant changes to energy usage pattern, from being an alternative source of energy to becoming a primary source of energy for power generation. It is quite evitable with the growing research and development activities focused on the increased production of solar energy, coupled with positive government initiatives and decreasing costs of photovoltaic equipment, in the Asian countries. Further, the diversification in the use of solar energy generation techniques by harnessing various technologies such as PV cell, thermal heating, and concentrated solar power technology is also leading to the growth of this industry.

Trends and growth analysis reports related to Electronics and Semiconductor : READ MORE..   
Your data will never be shared with third parties, however, we may send you information from time to time about our products that may be of interest to you. By submitting your details, you agree to be contacted by us. You may contact us at any time to opt-out.

The List of Companies

  1. Mitsubishi Electric Corporation
  2. Panasonic Corporation
  3. Kaneka Corporation
  4. KYOCERA Corporation
  5. Sharp Corporation
  6. JA Solar Co.,Ltd.
  7. Renesola Co. Ltd
  8. Trina Solar
  9. Jinko Solar
  10. Shunfeng International Clean Energy Co., Ltd.

Buy Now  

The Insight Partners performs research in 4 major stages: Data Collection & Secondary Research, Primary Research, Data Analysis and Data Triangulation & Final Review.

  1. Data Collection and Secondary Research:

As a market research and consulting firm operating from a decade, we have published and advised several client across the globe. First step for any study will start with an assessment of currently available data and insights from existing reports. Further, historical and current market information is collected from Investor Presentations, Annual Reports, SEC Filings, etc., and other information related to company’s performance and market positioning are gathered from Paid Databases (Factiva, Hoovers, and Reuters) and various other publications available in public domain.

Several associations trade associates, technical forums, institutes, societies and organization are accessed to gain technical as well as market related insights through their publications such as research papers, blogs and press releases related to the studies are referred to get cues about the market. Further, white papers, journals, magazines, and other news articles published in last 3 years are scrutinized and analyzed to understand the current market trends.

  1. Primary Research:

The primarily interview analysis comprise of data obtained from industry participants interview and answers to survey questions gathered by in-house primary team.

For primary research, interviews are conducted with industry experts/CEOs/Marketing Managers/VPs/Subject Matter Experts from both demand and supply side to get a 360-degree view of the market. The primary team conducts several interviews based on the complexity of the markets to understand the various market trends and dynamics which makes research more credible and precise.

A typical research interview fulfils the following functions:

  • Provides first-hand information on the market size, market trends, growth trends, competitive landscape, and outlook
  • Validates and strengthens in-house secondary research findings
  • Develops the analysis team’s expertise and market understanding

Primary research involves email interactions and telephone interviews for each market, category, segment, and sub-segment across geographies. The participants who typically take part in such a process include, but are not limited to:

  • Industry participants: VPs, business development managers, market intelligence managers and national sales managers
  • Outside experts: Valuation experts, research analysts and key opinion leaders specializing in the electronics and semiconductor industry.

Below is the breakup of our primary respondents by company, designation, and region:

Research Methodology

Once we receive the confirmation from primary research sources or primary respondents, we finalize the base year market estimation and forecast the data as per the macroeconomic and microeconomic factors assessed during data collection.

  1. Data Analysis:

Once data is validated through both secondary as well as primary respondents, we finalize the market estimations by hypothesis formulation and factor analysis at regional and country level.

  • Macro-Economic Factor Analysis:

We analyse macroeconomic indicators such the gross domestic product (GDP), increase in the demand for goods and services across industries, technological advancement, regional economic growth, governmental policies, the influence of COVID-19, PEST analysis, and other aspects. This analysis aids in setting benchmarks for various nations/regions and approximating market splits. Additionally, the general trend of the aforementioned components aid in determining the market's development possibilities.

  • Country Level Data:

Various factors that are especially aligned to the country are taken into account to determine the market size for a certain area and country, including the presence of vendors, such as headquarters and offices, the country's GDP, demand patterns, and industry growth. To comprehend the market dynamics for the nation, a number of growth variables, inhibitors, application areas, and current market trends are researched. The aforementioned elements aid in determining the country's overall market's growth potential.

  • Company Profile:

The “Table of Contents” is formulated by listing and analyzing more than 25 - 30 companies operating in the market ecosystem across geographies. However, we profile only 10 companies as a standard practice in our syndicate reports. These 10 companies comprise leading, emerging, and regional players. Nonetheless, our analysis is not restricted to the 10 listed companies, we also analyze other companies present in the market to develop a holistic view and understand the prevailing trends. The “Company Profiles” section in the report covers key facts, business description, products & services, financial information, SWOT analysis, and key developments. The financial information presented is extracted from the annual reports and official documents of the publicly listed companies. Upon collecting the information for the sections of respective companies, we verify them via various primary sources and then compile the data in respective company profiles. The company level information helps us in deriving the base number as well as in forecasting the market size.

  • Developing Base Number:

Aggregation of sales statistics (2020-2022) and macro-economic factor, and other secondary and primary research insights are utilized to arrive at base number and related market shares for 2022. The data gaps are identified in this step and relevant market data is analyzed, collected from paid primary interviews or databases. On finalizing the base year market size, forecasts are developed on the basis of macro-economic, industry and market growth factors and company level analysis.

  1. Data Triangulation and Final Review:

The market findings and base year market size calculations are validated from supply as well as demand side. Demand side validations are based on macro-economic factor analysis and benchmarks for respective regions and countries. In case of supply side validations, revenues of major companies are estimated (in case not available) based on industry benchmark, approximate number of employees, product portfolio, and primary interviews revenues are gathered. Further revenue from target product/service segment is assessed to avoid overshooting of market statistics. In case of heavy deviations between supply and demand side values, all thes steps are repeated to achieve synchronization.

We follow an iterative model, wherein we share our research findings with Subject Matter Experts (SME’s) and Key Opinion Leaders (KOLs) until consensus view of the market is not formulated – this model negates any drastic deviation in the opinions of experts. Only validated and universally acceptable research findings are quoted in our reports.

We have important check points that we use to validate our research findings – which we call – data triangulation, where we validate the information, we generate from secondary sources with primary interviews and then we re-validate with our internal data bases and Subject matter experts. This comprehensive model enables us to deliver high quality, reliable data in shortest possible time.