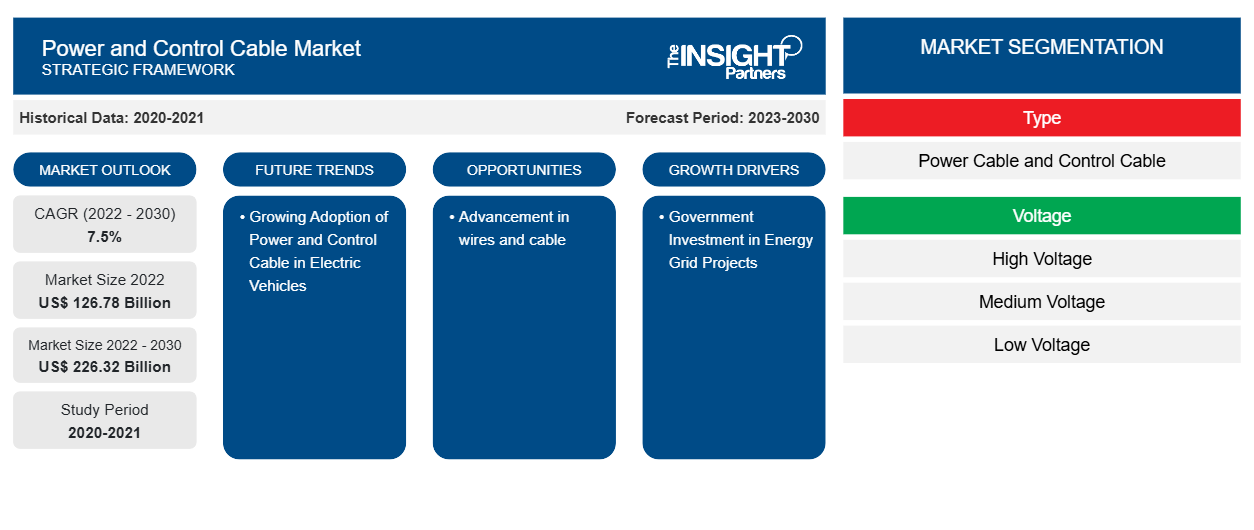
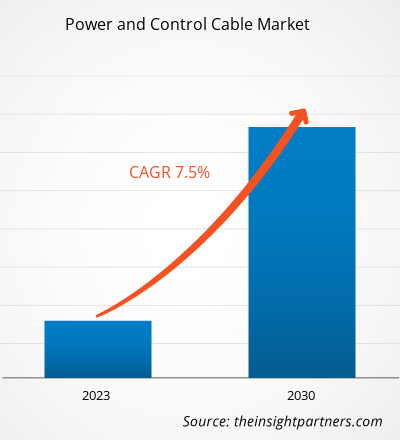
Der Markt für Strom- und Steuerkabel soll von 126,78 Milliarden US-Dollar im Jahr 2022 auf 226,32 Milliarden US-Dollar im Jahr 2030 anwachsen. Der Markt wird im Zeitraum 2022–2030 voraussichtlich eine durchschnittliche jährliche Wachstumsrate von 7,5 % verzeichnen. Die Weiterentwicklung von Drähten und Kabeln dürfte ein wichtiger Trend auf dem Markt bleiben.
Marktanalyse für Strom- und Steuerkabel
Der zunehmende Einsatz von Strom- und Steuerkabeln in Elektrofahrzeugen und die steigende Nachfrage nach zuverlässiger Stromversorgung treiben den Markt an. Aufgrund der Entwicklung des Übertragungs- und Verteilungssektors wird für den Prognosezeitraum ein Marktwachstum erwartet. Darüber hinaus schaffen staatliche Investitionen in Energienetzprojekte und die steigende Nachfrage nach Rechenzentren und Cloud-Computing lukrative Möglichkeiten für den Markt.
Übersicht über die Marke Strom- und Steuerkabel
Stromkabel übertragen Energie von einer Quelle zu Geräten. Steuerkabel übertragen Signale, die den Betrieb von Geräten steuern. Strom- und Steuerkabel sind die gängigsten Arten von Elektrokabeln, die in Wohn-, Gewerbe- und Industrieanwendungen zur Stromversorgung und Signalübertragung verwendet werden. Die Anwendungsanforderungen für Strom- und Steuerkabel unterscheiden sich hinsichtlich Spannungspegel, Abschirmungsalternativen, Flexibilitätsanforderungen, Ölbeständigkeit und Isolierungsarten, um Umwelt- und Betriebsbedingungen standzuhalten.
Passen Sie diesen Bericht Ihren Anforderungen an
Sie erhalten kostenlose Anpassungen an jedem Bericht, einschließlich Teilen dieses Berichts oder einer Analyse auf Länderebene, eines Excel-Datenpakets sowie tolle Angebote und Rabatte für Start-ups und Universitäten.
Markt für Strom- und Steuerkabel:
- Holen Sie sich die wichtigsten Markttrends aus diesem Bericht.Dieses KOSTENLOSE Beispiel umfasst eine Datenanalyse von Markttrends bis hin zu Schätzungen und Prognosen.
Treiber und Chancen auf dem Markt für Strom- und Steuerkabel
Zunehmender Einsatz von Strom- und Steuerkabeln in Elektrofahrzeugen begünstigt den Markt
Im August 2022 schätzte das japanische Ministerium für Wirtschaft, Handel und Industrie, dass Investitionen von über 24 Milliarden US-Dollar erforderlich sind, um eine wettbewerbsfähige Produktionsbasis für Batterien für Elektrofahrzeuge (EVs) und Energiespeichersysteme aufzubauen. Die steigende Nachfrage nach EVs und die staatliche Unterstützung bei der Einführung von EVs treiben den Markt an. Im Februar 2023 kündigte die südkoreanische Regierung ihren Plan an, die Zahl der subventionierten EVs um 34 % zu erhöhen, von 160.000 Einheiten im Jahr 2022 auf 215.000 Fahrzeuge im Jahr 2023. Die wachsende Nachfrage nach EVs erhöht den Bedarf an Ladeinfrastruktur und damit auch den Bedarf an Stromkabeln.
Staatliche Investitionen in Energienetzprojekte
Die wachsende Zahl industrieller Aktivitäten lässt den Energiebedarf der Industrie steigen und erhöht den Einsatz von Strom- und Steuerkabeln für eine angemessene Energieübertragung. Der Energiebedarf ermutigt die Regierung, Korrekturmaßnahmen für eine effektive Energieübertragung zu ergreifen. Im Folgenden sind einige staatliche Investitionen zur Erweiterung von Energienetzprojekten aufgeführt:
- Im Juni 2023 genehmigte die Weltbank ein Darlehen in Höhe von 268,4 Millionen US-Dollar für das Projekt „Tunesien-Italien-Interkonnektor“ (ELMED), das das Energienetz Tunesiens über ein 600-Megawatt-Unterseekabel nach Italien mit dem europäischen Stromnetz verbinden soll. Die Europäische Bank für Wiederaufbau und Entwicklung (EBWE), die Europäische Investitionsbank (EIB) und die deutsche staatliche Bank KfW werden einen Teil des 1,08 Milliarden US-Dollar teuren Projekts finanzieren, der italienische Übertragungsnetzbetreiber Terna den Rest.
- Im März 2023 kündigte der italienische Übertragungsnetzbetreiber Terna Pläne an, in den nächsten zehn Jahren mehr als 22,2 Milliarden US-Dollar in den Ausbau des italienischen Energienetzes zu investieren. Die Investitionsankündigung war Teil von Ternas Entwicklungsplan 2023 für das nationale Stromnetz.
Darüber hinaus eröffnen steigende staatliche Investitionen in Energienetzprojekte im Prognosezeitraum Chancen auf dem Markt .
Segmentierungsanalyse des Marktberichts für Strom- und Steuerkabel
Wichtige Segmente, die zur Ableitung der Marktanalyse für Strom- und Steuerkabel beigetragen haben , sind Typ, Spannung und Anwendung.
- Der Markt für Strom- und Steuerkabel ist nach Typ in Stromkabel und Steuerkabel unterteilt. Das Segment Stromkabel hatte im Jahr 2022 einen größeren Marktanteil.
- Nach Spannung ist der Markt in Hochspannung, Mittelspannung und Niederspannung segmentiert. Das Niederspannungssegment hatte im Jahr 2022 einen größeren Marktanteil.
- Auf der Grundlage der Anwendung wird der Markt in Versorgungsunternehmen und Industrie unterteilt. Das Versorgungssegment hielt im Jahr 2022 einen größeren Marktanteil.
Marktanteilsanalyse für Strom- und Steuerkabel nach geografischer Lage
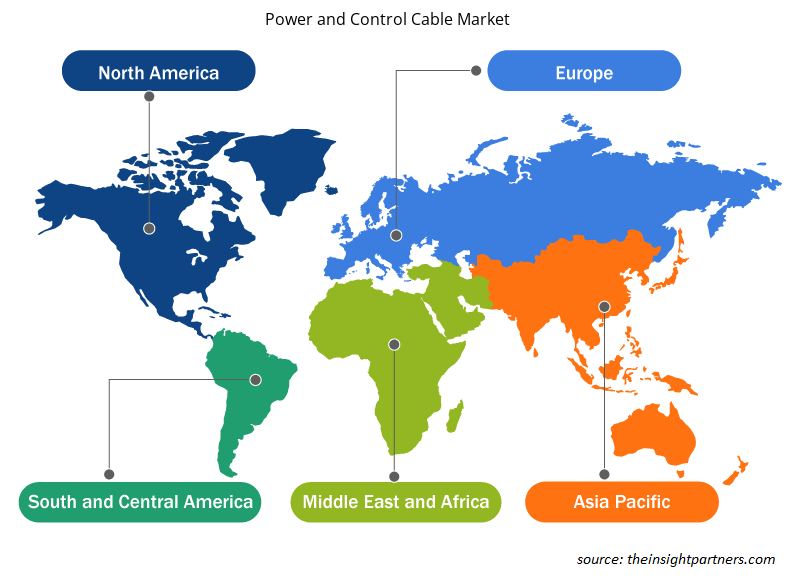
Der geografische Umfang des Marktberichts für Strom- und Steuerkabel ist hauptsächlich in fünf Regionen unterteilt: Nordamerika, Asien-Pazifik, Europa, Naher Osten und Afrika sowie Süd- und Mittelamerika.
Der Markt im asiatisch-pazifischen Raum wird im Prognosezeitraum voraussichtlich wachsen. Im April 2023 kündigte die indische Regierung Pläne an, die Leitungskilometer von 425.500 (Stand 31. Mai 2020) bis 2024–2025 auf 454.200 zu erweitern, was im Rahmen des Gati Shakti Masterplans zu einem Zuwachs von ~28.700 Leitungskilometern führt. Der Zuwachs wurde im Interstate Transmission System (ISTS)-Netz und für Spannungsebenen von 220 kV und mehr vorgeschlagen. Ebenso erhielt die staatliche Power Grid Corporation im Februar 2023 im Rahmen eines tarifbasierten Ausschreibungsverfahrens den Zuschlag für fünf zwischenstaatliche Stromübertragungsprojekte, die auf der Grundlage von „Build, Own, Operate and Transfer“ (BOOT) durchgeführt werden. Daher beflügeln staatliche Initiativen zur Verbesserung der Stromübertragung den Markt in der Region.
Regionale Einblicke in den Markt für Strom- und Steuerkabel
Die regionalen Trends und Faktoren, die den Markt für Strom- und Steuerkabel während des Prognosezeitraums beeinflussen, wurden von den Analysten von Insight Partners ausführlich erläutert. In diesem Abschnitt werden auch die Marktsegmente und die Geografie für Strom- und Steuerkabel in Nordamerika, Europa, im asiatisch-pazifischen Raum, im Nahen Osten und Afrika sowie in Süd- und Mittelamerika erörtert.
- Erhalten Sie regionale Daten zum Markt für Strom- und Steuerkabel
Umfang des Marktberichts zu Strom- und Steuerkabeln
| Berichtsattribut | Details |
|---|---|
| Marktgröße im Jahr 2022 | 126,78 Milliarden US-Dollar |
| Marktgröße bis 2030 | 226,32 Milliarden US-Dollar |
| Globale CAGR (2022 - 2030) | 7,5 % |
| Historische Daten | 2020-2021 |
| Prognosezeitraum | 2023–2030 |
| Abgedeckte Segmente | Nach Typ
|
| Abgedeckte Regionen und Länder | Nordamerika
|
| Marktführer und wichtige Unternehmensprofile |
|
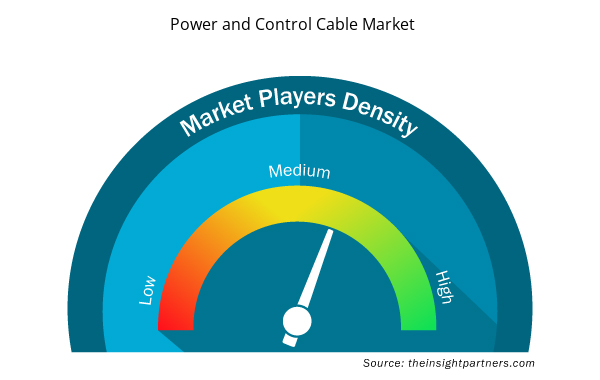
Marktteilnehmerdichte: Der Einfluss auf die Geschäftsdynamik
Der Markt für Strom- und Steuerkabel wächst rasant. Dies wird durch die steigende Nachfrage der Endnutzer aufgrund von Faktoren wie sich entwickelnden Verbraucherpräferenzen, technologischen Fortschritten und einem größeren Bewusstsein für die Vorteile des Produkts vorangetrieben. Mit der steigenden Nachfrage erweitern Unternehmen ihr Angebot, entwickeln Innovationen, um die Bedürfnisse der Verbraucher zu erfüllen, und nutzen neue Trends, was das Marktwachstum weiter ankurbelt.
Die Marktteilnehmerdichte bezieht sich auf die Verteilung der Firmen oder Unternehmen, die in einem bestimmten Markt oder einer bestimmten Branche tätig sind. Sie gibt an, wie viele Wettbewerber (Marktteilnehmer) in einem bestimmten Marktraum im Verhältnis zu seiner Größe oder seinem gesamten Marktwert präsent sind.
Die wichtigsten auf dem Markt für Strom- und Steuerkabel tätigen Unternehmen sind:
- Belden Inc
- Encore Wire Corp
- Furukawa Electric Co Ltd
- HENGTONG GROUP CO., LTD.
- LEONI AG
- Nexans SA
Haftungsausschluss : Die oben aufgeführten Unternehmen sind nicht in einer bestimmten Reihenfolge aufgeführt.
- Überblick über die wichtigsten Akteure auf dem Markt für Strom- und Steuerkabel
Neuigkeiten und aktuelle Entwicklungen zum Markt für Strom- und Steuerkabel
Der Markt für Strom- und Steuerkabel wird durch die Erhebung qualitativer und quantitativer Daten nach Primär- und Sekundärforschung bewertet, die wichtige Unternehmensveröffentlichungen, Verbandsdaten und Datenbanken umfasst. Nachfolgend sind einige der Entwicklungen auf dem Markt für Strom- und Steuerkabel aufgeführt:
- Sumitomo Electric Industries, Ltd. hat Pläne zur Errichtung einer Stromkabelfabrik in Schottland, Großbritannien, bekannt gegeben. (Quelle: Sumitomo Electric Industries Ltd, Unternehmenswebsite, März 2023)
Marktbericht zu Strom- und Steuerkabeln – Umfang und Ergebnisse
Der Bericht „Marktgröße und Prognose für Strom- und Steuerkabel (2020–2030)“ bietet eine detaillierte Analyse des Marktes, die die folgenden Bereiche abdeckt:
- Marktgröße und Prognose für Strom- und Steuerkabel auf globaler, regionaler und Länderebene für alle wichtigen Marktsegmente, die im Rahmen des Berichts abgedeckt sind
- Markttrends für Strom- und Steuerkabel sowie Marktdynamik wie Treiber, Einschränkungen und wichtige Chancen
- Detaillierte PEST/Porters Five Forces- und SWOT-Analyse
- Marktanalyse für Strom- und Steuerkabel, die wichtige Markttrends, globale und regionale Rahmenbedingungen, wichtige Akteure, Vorschriften und aktuelle Marktentwicklungen umfasst
- Branchenlandschaft und Wettbewerbsanalyse, einschließlich Marktkonzentration, Heatmap-Analyse, prominenten Akteuren und aktuellen Entwicklungen auf dem Markt für Strom- und Steuerkabel
- Detaillierte Firmenprofile
- Historische Analyse (2 Jahre), Basisjahr, Prognose (7 Jahre) mit CAGR
- PEST- und SWOT-Analyse
- Marktgröße Wert/Volumen – Global, Regional, Land
- Branche und Wettbewerbsumfeld
- Excel-Datensatz

Report Coverage
Revenue forecast, Company Analysis, Industry landscape, Growth factors, and Trends

Segment Covered
This text is related
to segments covered.

Regional Scope
North America, Europe, Asia Pacific, Middle East & Africa, South & Central America

Country Scope
This text is related
to country scope.
Häufig gestellte Fragen
The global power and control cable market is estimated to register a CAGR of 7.5% during the forecast period 2022–2030.
The key players holding majority shares in the global power and control cable market are Belden Inc, Encore Wire Corp, Furukawa Electric Co Ltd, HENGTONG GROUP CO., LTD, LEONI AG, Nexans SA, Prysmian SpA, Riyadh Cables Group Co, Southwire Company LLC, Sumitomo Electric Industries Ltd.
The global power and control cable market is expected to reach US$ 226.32 billion by 2030.
Asia Pacific dominated the power and control cable market in 2022.
The growing adoption of video analytics powered by computer vision and the rising adoption of the Industry 4.0 Concept are the major factors that propel the global power and control cable market.
Advancements in wires and cable to play a significant role in the global power and control cable market in the coming years.
Trends and growth analysis reports related to Electronics and Semiconductor : READ MORE..
The List of Companies - Power and Control Cable Market
- Belden Inc
- Encore Wire Corp
- Furukawa Electric Co Ltd
- HENGTONG GROUP CO., LTD
- LEONI AG
- Nexans SA
- Prysmian SpA
- Riyadh Cables Group
- Southwire Company LLC
- Sumitomo Electric Industries Ltd
The Insight Partners performs research in 4 major stages: Data Collection & Secondary Research, Primary Research, Data Analysis and Data Triangulation & Final Review.
- Data Collection and Secondary Research:
As a market research and consulting firm operating from a decade, we have published and advised several client across the globe. First step for any study will start with an assessment of currently available data and insights from existing reports. Further, historical and current market information is collected from Investor Presentations, Annual Reports, SEC Filings, etc., and other information related to company’s performance and market positioning are gathered from Paid Databases (Factiva, Hoovers, and Reuters) and various other publications available in public domain.
Several associations trade associates, technical forums, institutes, societies and organization are accessed to gain technical as well as market related insights through their publications such as research papers, blogs and press releases related to the studies are referred to get cues about the market. Further, white papers, journals, magazines, and other news articles published in last 3 years are scrutinized and analyzed to understand the current market trends.
- Primary Research:
The primarily interview analysis comprise of data obtained from industry participants interview and answers to survey questions gathered by in-house primary team.
For primary research, interviews are conducted with industry experts/CEOs/Marketing Managers/VPs/Subject Matter Experts from both demand and supply side to get a 360-degree view of the market. The primary team conducts several interviews based on the complexity of the markets to understand the various market trends and dynamics which makes research more credible and precise.
A typical research interview fulfils the following functions:
- Provides first-hand information on the market size, market trends, growth trends, competitive landscape, and outlook
- Validates and strengthens in-house secondary research findings
- Develops the analysis team’s expertise and market understanding
Primary research involves email interactions and telephone interviews for each market, category, segment, and sub-segment across geographies. The participants who typically take part in such a process include, but are not limited to:
- Industry participants: VPs, business development managers, market intelligence managers and national sales managers
- Outside experts: Valuation experts, research analysts and key opinion leaders specializing in the electronics and semiconductor industry.
Below is the breakup of our primary respondents by company, designation, and region:

Once we receive the confirmation from primary research sources or primary respondents, we finalize the base year market estimation and forecast the data as per the macroeconomic and microeconomic factors assessed during data collection.
- Data Analysis:
Once data is validated through both secondary as well as primary respondents, we finalize the market estimations by hypothesis formulation and factor analysis at regional and country level.
- Macro-Economic Factor Analysis:
We analyse macroeconomic indicators such the gross domestic product (GDP), increase in the demand for goods and services across industries, technological advancement, regional economic growth, governmental policies, the influence of COVID-19, PEST analysis, and other aspects. This analysis aids in setting benchmarks for various nations/regions and approximating market splits. Additionally, the general trend of the aforementioned components aid in determining the market's development possibilities.
- Country Level Data:
Various factors that are especially aligned to the country are taken into account to determine the market size for a certain area and country, including the presence of vendors, such as headquarters and offices, the country's GDP, demand patterns, and industry growth. To comprehend the market dynamics for the nation, a number of growth variables, inhibitors, application areas, and current market trends are researched. The aforementioned elements aid in determining the country's overall market's growth potential.
- Company Profile:
The “Table of Contents” is formulated by listing and analyzing more than 25 - 30 companies operating in the market ecosystem across geographies. However, we profile only 10 companies as a standard practice in our syndicate reports. These 10 companies comprise leading, emerging, and regional players. Nonetheless, our analysis is not restricted to the 10 listed companies, we also analyze other companies present in the market to develop a holistic view and understand the prevailing trends. The “Company Profiles” section in the report covers key facts, business description, products & services, financial information, SWOT analysis, and key developments. The financial information presented is extracted from the annual reports and official documents of the publicly listed companies. Upon collecting the information for the sections of respective companies, we verify them via various primary sources and then compile the data in respective company profiles. The company level information helps us in deriving the base number as well as in forecasting the market size.
- Developing Base Number:
Aggregation of sales statistics (2020-2022) and macro-economic factor, and other secondary and primary research insights are utilized to arrive at base number and related market shares for 2022. The data gaps are identified in this step and relevant market data is analyzed, collected from paid primary interviews or databases. On finalizing the base year market size, forecasts are developed on the basis of macro-economic, industry and market growth factors and company level analysis.
- Data Triangulation and Final Review:
The market findings and base year market size calculations are validated from supply as well as demand side. Demand side validations are based on macro-economic factor analysis and benchmarks for respective regions and countries. In case of supply side validations, revenues of major companies are estimated (in case not available) based on industry benchmark, approximate number of employees, product portfolio, and primary interviews revenues are gathered. Further revenue from target product/service segment is assessed to avoid overshooting of market statistics. In case of heavy deviations between supply and demand side values, all thes steps are repeated to achieve synchronization.
We follow an iterative model, wherein we share our research findings with Subject Matter Experts (SME’s) and Key Opinion Leaders (KOLs) until consensus view of the market is not formulated – this model negates any drastic deviation in the opinions of experts. Only validated and universally acceptable research findings are quoted in our reports.
We have important check points that we use to validate our research findings – which we call – data triangulation, where we validate the information, we generate from secondary sources with primary interviews and then we re-validate with our internal data bases and Subject matter experts. This comprehensive model enables us to deliver high quality, reliable data in shortest possible time.
 Holen Sie sich ein kostenloses Muster für diesen Bericht