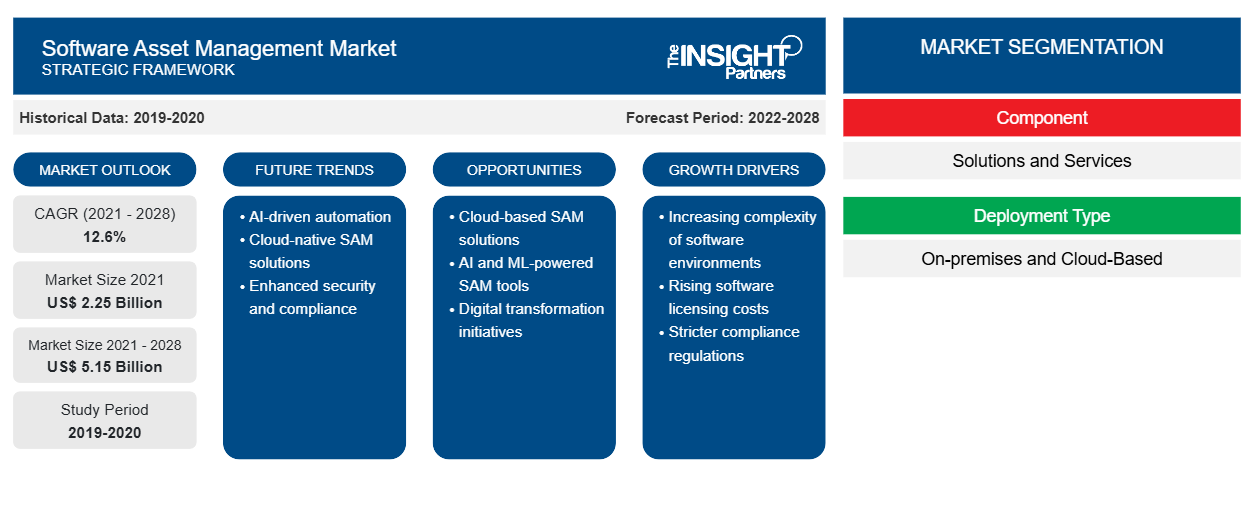
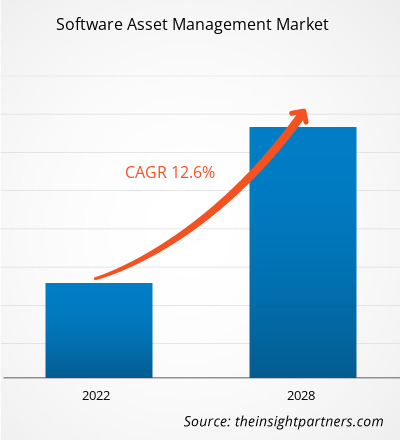
[Forschungsbericht] Der Markt für Software Asset Management soll von 2.250,37 Millionen US-Dollar im Jahr 2021 auf 5.150,51 Millionen US-Dollar im Jahr 2028 wachsen; von 2021 bis 2028 wird mit einer durchschnittlichen jährlichen Wachstumsrate von 12,6 % gerechnet.
Die Verwaltung von Systemen, Regeln und Verfahren, die den Erwerb, die Implementierung, die Nutzung, die Wartung und die Entsorgung von Softwareanwendungen innerhalb einer Organisation ermöglichen, wird als Software Asset Management (SAM) bezeichnet. Der Software Asset Management-Markt ist eine Komponente des IT-Asset-Managements, die sicherstellen soll, dass das Unternehmen Lizenzvereinbarungen einhält und nicht zu viel für Software ausgibt. Die Identifizierung von Software-Assets, die Gültigkeit von Endbenutzer-Lizenzvereinbarungen (EULAs) und die angemessene Verwendung kostenloser Software sind allesamt entscheidende Ziele jedes SAM-Vorhabens. SAM-Dokumentation kann das eigene Unternehmen vor Piraterieklagen schützen, unbeabsichtigten Lizenzmissbrauch minimieren und Kontrolle über die Schattensoftware im Netzwerk bieten.
Das Software-Asset-Management in einem großen Unternehmen kann so kompliziert sein, dass es die Entwicklung und Pflege einer Datenbank erfordert, die Informationen über Softwarekäufe, Abonnements, Lizenzen und Patches enthält. Ein solches Team ist oft für die Erneuerung von Softwarelizenzen, das Aushandeln neuer Lizenzvereinbarungen und das Erkennen und Entfernen von Software verantwortlich, die selten oder nie verwendet wird. Der Software-Asset-Management-Markt prüft die Anzahl der gekauften Softwarelizenzen und gleicht sie mit der Anzahl der installierten Lizenzen ab, um die Informationsbeschaffung aus zahlreichen Inventarquellen für Mobilgeräte, Desktops, Rechenzentren und Clouds zu automatisieren. SAM-Tools können auch den Überblick darüber behalten, wie viele Lizenzen noch übrig sind. Um die Kosten niedrig zu halten, kann dieses Wissen genutzt werden, um nicht verwendete Software zu löschen oder neu zuzuweisen.
Passen Sie diesen Bericht Ihren Anforderungen an
Sie erhalten kostenlos individuelle Anpassungen an jedem Bericht, einschließlich Teilen dieses Berichts oder einer Analyse auf Länderebene, eines Excel-Datenpakets sowie tolle Angebote und Rabatte für Start-ups und Universitäten.
- Holen Sie sich die wichtigsten Markttrends aus diesem Bericht.Dieses KOSTENLOSE Beispiel umfasst eine Datenanalyse von Markttrends bis hin zu Schätzungen und Prognosen.
Regionale Einblicke in den Markt für Software Asset Management
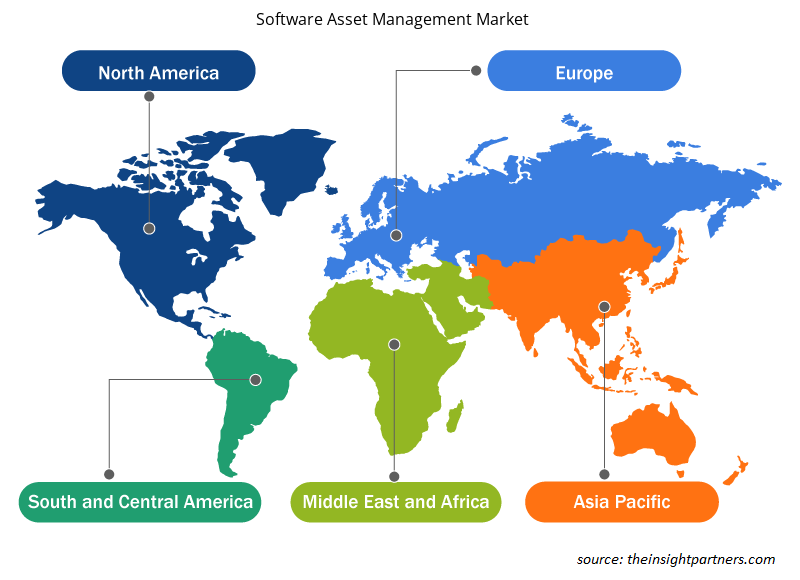
Die regionalen Trends und Faktoren, die den Markt für Software Asset Management im Prognosezeitraum beeinflussen, wurden von den Analysten von Insight Partners ausführlich erläutert. In diesem Abschnitt werden auch die Marktsegmente und die Geografie von Software Asset Management in Nordamerika, Europa, im asiatisch-pazifischen Raum, im Nahen Osten und Afrika sowie in Süd- und Mittelamerika erörtert.

- Erhalten Sie regionale Daten zum Software Asset Management-Markt
Umfang des Marktberichts zum Software Asset Management
| Berichtsattribut | Details |
|---|---|
| Marktgröße im Jahr 2021 | 2,25 Milliarden US-Dollar |
| Marktgröße bis 2028 | 5,15 Milliarden US-Dollar |
| Globale CAGR (2021 - 2028)CAGR (2021 - 2028) | 12,6 % |
| Historische Daten | 2019-2020 |
| Prognosezeitraum | 2022–2028 |
| Abgedeckte Segmente | Nach Komponente
|
| Abgedeckte Regionen und Länder | Nordamerika
|
| Marktführer und wichtige Unternehmensprofile |
|
Marktteilnehmerdichte: Der Einfluss auf die Geschäftsdynamik
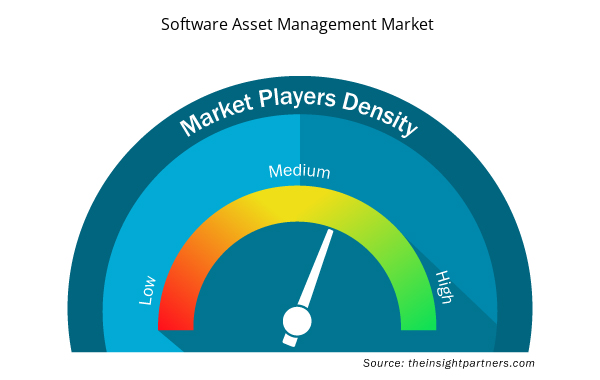
Der Markt für Software Asset Management wächst rasant, angetrieben durch die steigende Nachfrage der Endnutzer aufgrund von Faktoren wie sich entwickelnden Verbraucherpräferenzen, technologischen Fortschritten und einem größeren Bewusstsein für die Vorteile des Produkts. Mit steigender Nachfrage erweitern Unternehmen ihr Angebot, entwickeln Innovationen, um die Bedürfnisse der Verbraucher zu erfüllen, und nutzen neue Trends, was das Marktwachstum weiter ankurbelt.
Die Marktteilnehmerdichte bezieht sich auf die Verteilung von Firmen oder Unternehmen, die in einem bestimmten Markt oder einer bestimmten Branche tätig sind. Sie gibt an, wie viele Wettbewerber (Marktteilnehmer) in einem bestimmten Marktraum im Verhältnis zu seiner Größe oder seinem gesamten Marktwert präsent sind.
Die wichtigsten auf dem Software Asset Management-Markt tätigen Unternehmen sind:
- Microsoft Corporation
- IVANTI
- SNOW SOFTWARE
- BMC SOFTWARE, INC.
- CERTERO
Haftungsausschluss : Die oben aufgeführten Unternehmen sind nicht in einer bestimmten Reihenfolge aufgeführt.

- Überblick über die wichtigsten Akteure auf dem Software Asset Management-Markt
Markt für Software Asset Management – Firmenprofile
- Microsoft Corporation
- IVANTI
- SNOW SOFTWARE
- BMC SOFTWARE, INC.
- CERTERO
- FLEXERA
- IBM Corporation
- MIKROFOKUS
- SERVICENOW
- BROADCOM, INC.
- Historische Analyse (2 Jahre), Basisjahr, Prognose (7 Jahre) mit CAGR
- PEST- und SWOT-Analyse
- Marktgröße Wert/Volumen – Global, Regional, Land
- Branche und Wettbewerbsumfeld
- Excel-Datensatz


Report Coverage
Revenue forecast, Company Analysis, Industry landscape, Growth factors, and Trends

Segment Covered
This text is related
to segments covered.

Regional Scope
North America, Europe, Asia Pacific, Middle East & Africa, South & Central America

Country Scope
This text is related
to country scope.
Häufig gestellte Fragen
The software asset management market based on component type is segmented into solutions, and services. In 2020, the solution segment held the largest software asset management market share.
SAM helps an organization to decrease software costs, increase compliance, and improve processes for employee software requests. The capability of an entity to replace, update, or enhance the overall skills of the enterprise can become critically impaired. Furthermore, support and managing costs for these critical assets necessarily grow to be a significant inconvenience. The need to follow the organization’s policies, control licensing, and assured security for the internal network, is needed for the enterprise to be successful. Software license management tools are driving the market.
In addition to managing software assets, software asset management (SAM) for cloud settings focuses on cost management, software portfolio management, and regulatory challenges. In cloud settings, where services are provided, configured, reconfigured, and released in a matter of minutes, software asset management (SAM) as a process must adapt to the quick speed of change. The various cloud approaches – Infrastructure as a Service (IaaS), Platform as a Service (PaaS), and Software as a Service (SaaS) – have varying effects on software asset management (SAM), and organizations will need to carefully and proactively consider the impact their cloud strategy has on their software asset management (SAM) programs, in general, and specifically on their software licensing. For instance, Cloud Economics is a periodic comprehensive service that gives clients transparency and control over their Cloud deployment while also assisting them with budgeting, contract renewals, infrastructure changes, mergers and acquisitions, standards, rules, and processes.
On the basis of industry vertical, the global software asset management market is segmented as BFSI, IT and Telecom, manufacturing, retail, and consumer goods, government, healthcare and life sciences, education, media and entertainment, others. Manufacturing segment held the largest software asset management market share in 2020.
IoT-enabled software asset monitoring and analytics solutions leverage web, analytics, and wireless to combine all the traditional solutions, processes, assets, and workflows into a single solution to offer a centralized consolidated tracking and monitoring and analytics system. These systems provide anytime, anywhere access and any device connectivity with enormous scalability and effective IT-OT (information technology systems - operational technology systems) integrations. Companies may utilize IoT-based solutions to keep track of all of their assets, recover and maintain them, identify issue areas, stock inventories, build up a replenishment system, properly evaluate risk and compliance, and analyze asset usage and condition. Business entities will now have the time and resources to evaluate the quality, quantity, and placement of assets to enhance work processes, eliminate waste, and avoid unexpected equipment failure to keep a cost-effective system running, which in turn is likely to gain momentum for the software asset management (SAM) market over the forecasted period.
Based on deployment type, the software asset management is categorized into on-premise, and cloud-based. Cloud segment dominate the market. The increasing utilization of cloud-based services and big data tools is acting as a major growth-inducing factor. Software asset management solutions deployed in the cloud provide web-based management and enterprise-wide protection solutions with increased scalability, network security, and speed.
Trends and growth analysis reports related to Technology, Media and Telecommunications : READ MORE..
The Insight Partners performs research in 4 major stages: Data Collection & Secondary Research, Primary Research, Data Analysis and Data Triangulation & Final Review.
- Data Collection and Secondary Research:
As a market research and consulting firm operating from a decade, we have published and advised several client across the globe. First step for any study will start with an assessment of currently available data and insights from existing reports. Further, historical and current market information is collected from Investor Presentations, Annual Reports, SEC Filings, etc., and other information related to company’s performance and market positioning are gathered from Paid Databases (Factiva, Hoovers, and Reuters) and various other publications available in public domain.
Several associations trade associates, technical forums, institutes, societies and organization are accessed to gain technical as well as market related insights through their publications such as research papers, blogs and press releases related to the studies are referred to get cues about the market. Further, white papers, journals, magazines, and other news articles published in last 3 years are scrutinized and analyzed to understand the current market trends.
- Primary Research:
The primarily interview analysis comprise of data obtained from industry participants interview and answers to survey questions gathered by in-house primary team.
For primary research, interviews are conducted with industry experts/CEOs/Marketing Managers/VPs/Subject Matter Experts from both demand and supply side to get a 360-degree view of the market. The primary team conducts several interviews based on the complexity of the markets to understand the various market trends and dynamics which makes research more credible and precise.
A typical research interview fulfils the following functions:
- Provides first-hand information on the market size, market trends, growth trends, competitive landscape, and outlook
- Validates and strengthens in-house secondary research findings
- Develops the analysis team’s expertise and market understanding
Primary research involves email interactions and telephone interviews for each market, category, segment, and sub-segment across geographies. The participants who typically take part in such a process include, but are not limited to:
- Industry participants: VPs, business development managers, market intelligence managers and national sales managers
- Outside experts: Valuation experts, research analysts and key opinion leaders specializing in the electronics and semiconductor industry.
Below is the breakup of our primary respondents by company, designation, and region:

Once we receive the confirmation from primary research sources or primary respondents, we finalize the base year market estimation and forecast the data as per the macroeconomic and microeconomic factors assessed during data collection.
- Data Analysis:
Once data is validated through both secondary as well as primary respondents, we finalize the market estimations by hypothesis formulation and factor analysis at regional and country level.
- Macro-Economic Factor Analysis:
We analyse macroeconomic indicators such the gross domestic product (GDP), increase in the demand for goods and services across industries, technological advancement, regional economic growth, governmental policies, the influence of COVID-19, PEST analysis, and other aspects. This analysis aids in setting benchmarks for various nations/regions and approximating market splits. Additionally, the general trend of the aforementioned components aid in determining the market's development possibilities.
- Country Level Data:
Various factors that are especially aligned to the country are taken into account to determine the market size for a certain area and country, including the presence of vendors, such as headquarters and offices, the country's GDP, demand patterns, and industry growth. To comprehend the market dynamics for the nation, a number of growth variables, inhibitors, application areas, and current market trends are researched. The aforementioned elements aid in determining the country's overall market's growth potential.
- Company Profile:
The “Table of Contents” is formulated by listing and analyzing more than 25 - 30 companies operating in the market ecosystem across geographies. However, we profile only 10 companies as a standard practice in our syndicate reports. These 10 companies comprise leading, emerging, and regional players. Nonetheless, our analysis is not restricted to the 10 listed companies, we also analyze other companies present in the market to develop a holistic view and understand the prevailing trends. The “Company Profiles” section in the report covers key facts, business description, products & services, financial information, SWOT analysis, and key developments. The financial information presented is extracted from the annual reports and official documents of the publicly listed companies. Upon collecting the information for the sections of respective companies, we verify them via various primary sources and then compile the data in respective company profiles. The company level information helps us in deriving the base number as well as in forecasting the market size.
- Developing Base Number:
Aggregation of sales statistics (2020-2022) and macro-economic factor, and other secondary and primary research insights are utilized to arrive at base number and related market shares for 2022. The data gaps are identified in this step and relevant market data is analyzed, collected from paid primary interviews or databases. On finalizing the base year market size, forecasts are developed on the basis of macro-economic, industry and market growth factors and company level analysis.
- Data Triangulation and Final Review:
The market findings and base year market size calculations are validated from supply as well as demand side. Demand side validations are based on macro-economic factor analysis and benchmarks for respective regions and countries. In case of supply side validations, revenues of major companies are estimated (in case not available) based on industry benchmark, approximate number of employees, product portfolio, and primary interviews revenues are gathered. Further revenue from target product/service segment is assessed to avoid overshooting of market statistics. In case of heavy deviations between supply and demand side values, all thes steps are repeated to achieve synchronization.
We follow an iterative model, wherein we share our research findings with Subject Matter Experts (SME’s) and Key Opinion Leaders (KOLs) until consensus view of the market is not formulated – this model negates any drastic deviation in the opinions of experts. Only validated and universally acceptable research findings are quoted in our reports.
We have important check points that we use to validate our research findings – which we call – data triangulation, where we validate the information, we generate from secondary sources with primary interviews and then we re-validate with our internal data bases and Subject matter experts. This comprehensive model enables us to deliver high quality, reliable data in shortest possible time.


 Holen Sie sich ein kostenloses Muster für diesen Bericht