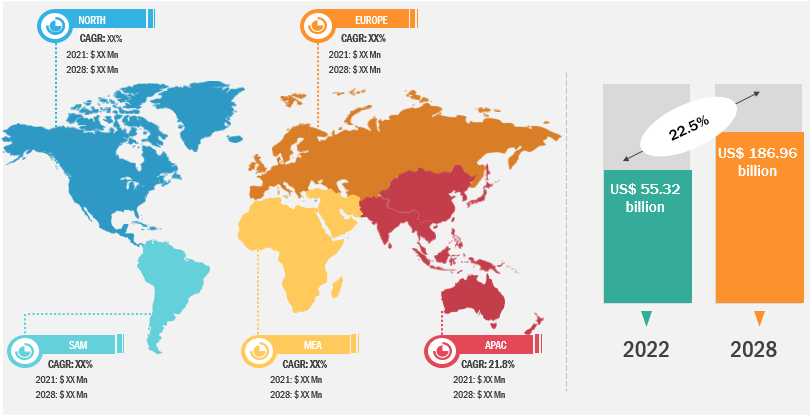
Der Markt für softwaredefinierte Rechenzentren wird voraussichtlich von 55,32 Milliarden US-Dollar im Jahr 2022 auf US-Dollar wachsen 186,96 Milliarden US-Dollar bis 2031; Von 2022 bis 2031 wird ein durchschnittliches jährliches Wachstum von 22,5 % erwartet.
Software Defined Data Centers (SDDC) helfen Organisationen und Unternehmen, skalierbare und agile Rechenzentren basierend auf dynamischen Geschäftsanforderungen zu schaffen. Es ermöglicht Endbenutzern, die Kapazität des Rechenzentrums zu erhöhen und trägt dazu bei, optimale Investitionsausgaben (CAPEX) zu erzielen. SDDC-Lösungen wie softwaredefinierter Speicher, softwaredefinierte Netzwerke und Servervirtualisierung werden massiv eingesetzt, da sie Endbenutzern dabei helfen, Kosteneinsparungen, eine verbesserte Energieeffizienz und eine einfache Skalierbarkeit zu erzielen. Darüber hinaus wird erwartet, dass der florierende Trend zu Cloud-basierten Datenmanagementlösungen im Prognosezeitraum die Einführung softwaredefinierter Rechenzentrumslösungen in mehreren Branchen vorantreiben wird.
Die Präsenz bekannter und finanzstarker Unternehmen wie VMware, Inc.; Microsoft; Orakel; und Huawei Technologies Co., Ltd. charakterisieren den globalen Markt für softwaredefinierte Rechenzentren.
Die Software definiert Das Speichersegment (SDS) hatte im Jahr 2021 einen großen Marktanteil und wird im Prognosezeitraum voraussichtlich ein stetiges Marktwachstum verzeichnen. Mit der zunehmenden Durchdringung des IoT und der rasanten Zunahme der Datengenerierung automatisieren mehrere Unternehmen ihre Rechenzentren. Darüber hinaus ermöglicht SDS Unternehmen eine hohe Effizienz, schnellere Skalierbarkeit und größere Flexibilität, indem es Speicherressourcen programmierbar macht, und trägt dazu bei, Betriebsausgaben und Speicherkosten zu senken, wodurch das Wachstum des Software-Defined-Storage-Segments (SDS) vorangetrieben wird.
Basierend auf Branchenvertikalen, BFSI und IT & Telekommunikationsvertikale machen mehr als die Hälfte des weltweiten Marktanteils von softwaredefinierten Rechenzentren aus. Softwaredefinierte Rechenzentren bieten diesen Segmenten energieeffiziente Datenmanagementlösungen sowie hohe Agilität und Skalierbarkeit entsprechend den sich ändernden Geschäftsanforderungen. Dies hat die Einführung von Software Defined Data Center für die Organisationen in diesen Sektoren attraktiver gemacht.
Strategische Einblicke
Regionale Analyse des Marktes für softwaredefinierte Rechenzentren
Lukrative Regionen – Marktanteil von Software Defined Data Center
 < /span>
Markteinblicke – Markt für softwaredefinierte Rechenzentren
Branche vertikal -basierte Erkenntnisse
Basiert auf der Branche vertikal, die Software Der definierte Rechenzentrumsmarkt ist in BFSI, IT & Telekommunikation, Gesundheitswesen, Regierung & Verteidigung, Bildung, Einzelhandel, Fertigung und andere. Im Jahr 2021 hatte das BFSI-Segment den größten Anteil am Markt für softwaredefinierte Rechenzentren. Finanzdienstleistungsunternehmen befassen sich mit der Übertragung, Speicherung und dem Zugriff auf große Mengen kundenbezogener Daten, die äußerst sensibel und vertraulich sind. Die Verwaltung gesicherter Übertragungen und des garantiert gesicherten Zugriffs auf Daten ohne Sicherheitslücken und einer zuverlässigen Speicherung erfordert erhebliche IT-Eingriffe. Softwaredefinierte Rechenzentren bieten Finanzinstituten und ihren Kunden Agilität, Flexibilität und Sicherheit für den Austausch von Dateien und sensiblen Daten zwischen Filialen, Hauptsitzen und Bankkunden, ohne die Bankdienstleistungen zu unterbrechen oder zu verzögern.
< span style="font-size: 10pt; font-family: verdana, geneva, sans-serif;">Spieler, die auf dem Markt für softwaredefinierte Rechenzentren tätig sind, konzentrieren sich hauptsächlich auf die Entwicklung fortschrittlicher und effizienter Produkte.
- Im September 2021 entwickelte Nutanix sein bestehendes Cloud-Plattform-Angebot und veröffentlichte die AOS-Software Version 6, die Unternehmen beim Aufbau moderner softwaredefinierter Rechenzentren unterstützen und auch ihre hybriden Multi-Cloud-Umgebungen beschleunigen soll.
- Im Mai 2021 nutzte das moderne Netzwerk-Framework von VMware die NSX-Technologie, um Netzwerke im Cloud-Maßstab mithilfe eines Multi-Cloud-Netzwerks aufzubauen, das den Anwendungsverkehr innerhalb und zwischen Clouds sichert. Darüber hinaus zielte diese Technologie darauf ab, die Zuweisung von Netzwerkdiensten in Cloud-basierten Rechenzentren zu automatisieren und zu steigern und so zu einem wichtigen Faktor für das Wachstum des Marktes für softwaredefinierte Rechenzentren zu werden.
Der Markt für softwaredefinierte Rechenzentren ist in fünf Hauptregionen unterteilt: Nordamerika, Europa, Asien-Pazifik (APAC), Naher Osten und Asien. Afrika und Südamerika. Im Jahr 2022 war Nordamerika mit einem erheblichen Umsatzanteil Marktführer, gefolgt von Europa. Darüber hinaus wird erwartet, dass der asiatisch-pazifische Raum von 2022 bis 2031 die höchste CAGR im Markt für softwaredefinierte Rechenzentren verzeichnen wird.
Hewlett Packard Enterprise Development LP; Microsoft; Dell Inc.; VMware, Inc.; Orakel; IBM Corporation; Nutanix; Cisco Systems, Inc.; Huawei Technologies Co., Ltd.; und Fujitsu gehören zu den Hauptakteuren auf dem Markt für softwaredefinierte Rechenzentren. Der Marktbericht bietet detaillierte Markteinblicke, die den Hauptakteuren dabei helfen, Wachstumsstrategien für die kommenden Jahre zu entwickeln.
- Historische Analyse (2 Jahre), Basisjahr, Prognose (7 Jahre) mit CAGR
- PEST- und SWOT-Analyse
- Marktgröße Wert/Volumen – Global, Regional, Land
- Branche und Wettbewerbsumfeld
- Excel-Datensatz


Report Coverage
Revenue forecast, Company Analysis, Industry landscape, Growth factors, and Trends

Segment Covered
This text is related
to segments covered.

Regional Scope
North America, Europe, Asia Pacific, Middle East & Africa, South & Central America

Country Scope
This text is related
to country scope.
Häufig gestellte Fragen
Some of the customization options available based on the request are an additional 3–5 company profiles and country-specific analysis of 3–5 countries of your choice. Customizations are to be requested/discussed before making final order confirmation# as our team would review the same and check the feasibility
The report can be delivered in PDF/PPT format; we can also share excel dataset based on the request
Increased adoption of hybrid and multi-cloud architectures and integration with artificial intelligence and machine learning are anticipated to play a significant role in the global software defined data center market in the coming years
Demand for flexibility and scalability and cost optimization and operational efficiency are the major factors driving the software defined data center market
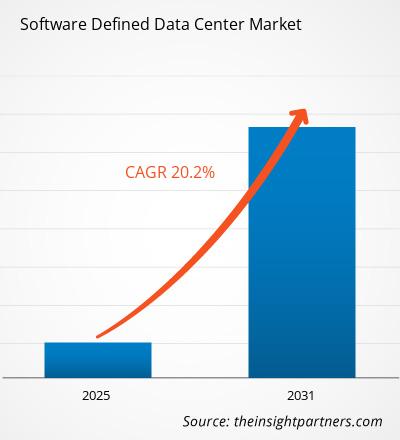
The global software defined data center market is expected to grow at a CAGR of 20.2% during the forecast period 2024 - 2031.
Trends and growth analysis reports related to Technology, Media and Telecommunications : READ MORE..
The List of Companies
- Cisco Systems, Inc.
- Citrix Systems, Inc.
- Fujitsu Ltd.
- Hitachi, Ltd.
- Hewlett Packard Enterprise
- Huawei Technologies Co. Ltd.
- IBM Corporation
- Microsoft Corporation
- Oracle Corporation
- VMware, Inc.
The Insight Partners performs research in 4 major stages: Data Collection & Secondary Research, Primary Research, Data Analysis and Data Triangulation & Final Review.
- Data Collection and Secondary Research:
As a market research and consulting firm operating from a decade, we have published and advised several client across the globe. First step for any study will start with an assessment of currently available data and insights from existing reports. Further, historical and current market information is collected from Investor Presentations, Annual Reports, SEC Filings, etc., and other information related to company’s performance and market positioning are gathered from Paid Databases (Factiva, Hoovers, and Reuters) and various other publications available in public domain.
Several associations trade associates, technical forums, institutes, societies and organization are accessed to gain technical as well as market related insights through their publications such as research papers, blogs and press releases related to the studies are referred to get cues about the market. Further, white papers, journals, magazines, and other news articles published in last 3 years are scrutinized and analyzed to understand the current market trends.
- Primary Research:
The primarily interview analysis comprise of data obtained from industry participants interview and answers to survey questions gathered by in-house primary team.
For primary research, interviews are conducted with industry experts/CEOs/Marketing Managers/VPs/Subject Matter Experts from both demand and supply side to get a 360-degree view of the market. The primary team conducts several interviews based on the complexity of the markets to understand the various market trends and dynamics which makes research more credible and precise.
A typical research interview fulfils the following functions:
- Provides first-hand information on the market size, market trends, growth trends, competitive landscape, and outlook
- Validates and strengthens in-house secondary research findings
- Develops the analysis team’s expertise and market understanding
Primary research involves email interactions and telephone interviews for each market, category, segment, and sub-segment across geographies. The participants who typically take part in such a process include, but are not limited to:
- Industry participants: VPs, business development managers, market intelligence managers and national sales managers
- Outside experts: Valuation experts, research analysts and key opinion leaders specializing in the electronics and semiconductor industry.
Below is the breakup of our primary respondents by company, designation, and region:

Once we receive the confirmation from primary research sources or primary respondents, we finalize the base year market estimation and forecast the data as per the macroeconomic and microeconomic factors assessed during data collection.
- Data Analysis:
Once data is validated through both secondary as well as primary respondents, we finalize the market estimations by hypothesis formulation and factor analysis at regional and country level.
- Macro-Economic Factor Analysis:
We analyse macroeconomic indicators such the gross domestic product (GDP), increase in the demand for goods and services across industries, technological advancement, regional economic growth, governmental policies, the influence of COVID-19, PEST analysis, and other aspects. This analysis aids in setting benchmarks for various nations/regions and approximating market splits. Additionally, the general trend of the aforementioned components aid in determining the market's development possibilities.
- Country Level Data:
Various factors that are especially aligned to the country are taken into account to determine the market size for a certain area and country, including the presence of vendors, such as headquarters and offices, the country's GDP, demand patterns, and industry growth. To comprehend the market dynamics for the nation, a number of growth variables, inhibitors, application areas, and current market trends are researched. The aforementioned elements aid in determining the country's overall market's growth potential.
- Company Profile:
The “Table of Contents” is formulated by listing and analyzing more than 25 - 30 companies operating in the market ecosystem across geographies. However, we profile only 10 companies as a standard practice in our syndicate reports. These 10 companies comprise leading, emerging, and regional players. Nonetheless, our analysis is not restricted to the 10 listed companies, we also analyze other companies present in the market to develop a holistic view and understand the prevailing trends. The “Company Profiles” section in the report covers key facts, business description, products & services, financial information, SWOT analysis, and key developments. The financial information presented is extracted from the annual reports and official documents of the publicly listed companies. Upon collecting the information for the sections of respective companies, we verify them via various primary sources and then compile the data in respective company profiles. The company level information helps us in deriving the base number as well as in forecasting the market size.
- Developing Base Number:
Aggregation of sales statistics (2020-2022) and macro-economic factor, and other secondary and primary research insights are utilized to arrive at base number and related market shares for 2022. The data gaps are identified in this step and relevant market data is analyzed, collected from paid primary interviews or databases. On finalizing the base year market size, forecasts are developed on the basis of macro-economic, industry and market growth factors and company level analysis.
- Data Triangulation and Final Review:
The market findings and base year market size calculations are validated from supply as well as demand side. Demand side validations are based on macro-economic factor analysis and benchmarks for respective regions and countries. In case of supply side validations, revenues of major companies are estimated (in case not available) based on industry benchmark, approximate number of employees, product portfolio, and primary interviews revenues are gathered. Further revenue from target product/service segment is assessed to avoid overshooting of market statistics. In case of heavy deviations between supply and demand side values, all thes steps are repeated to achieve synchronization.
We follow an iterative model, wherein we share our research findings with Subject Matter Experts (SME’s) and Key Opinion Leaders (KOLs) until consensus view of the market is not formulated – this model negates any drastic deviation in the opinions of experts. Only validated and universally acceptable research findings are quoted in our reports.
We have important check points that we use to validate our research findings – which we call – data triangulation, where we validate the information, we generate from secondary sources with primary interviews and then we re-validate with our internal data bases and Subject matter experts. This comprehensive model enables us to deliver high quality, reliable data in shortest possible time.

 Holen Sie sich ein kostenloses Muster für diesen Bericht