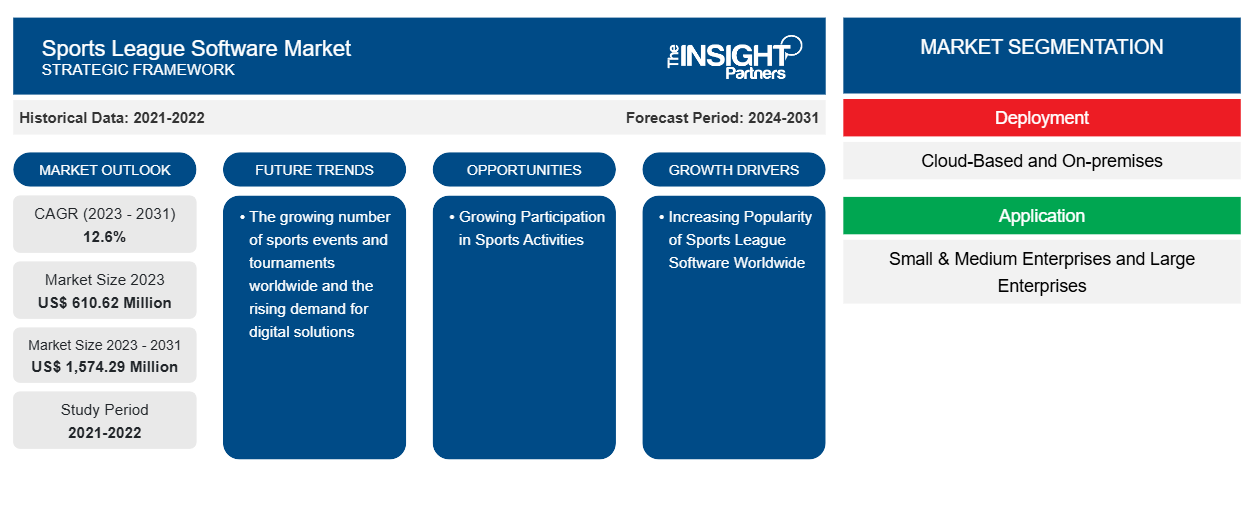
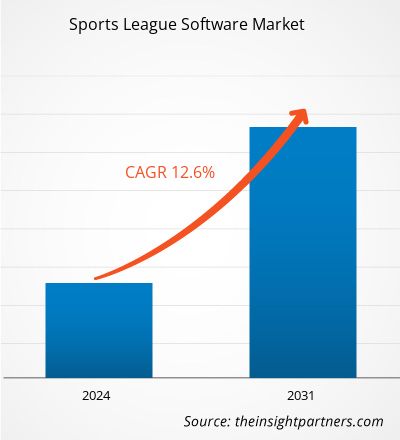
Der Markt für Sportliga-Software soll von 610,62 Millionen US-Dollar im Jahr 2023 auf 1.574,29 Millionen US-Dollar im Jahr 2031 anwachsen. Der Markt soll zwischen 2023 und 2031 eine durchschnittliche jährliche Wachstumsrate (CAGR) von 12,6 % verzeichnen. Die wachsende Zahl von Sportveranstaltungen und Turnieren weltweit und die steigende Nachfrage nach digitalen Lösungen dürften weiterhin ein wichtiger Trend auf dem Markt für Sportliga-Software bleiben.
Analyse des Softwaremarktes für Sportligen
Der Markt für Sportliga-Software wächst rasant, da diese weltweit immer beliebter wird und die Nachfrage nach Fan-Engagement über physische Events hinaus steigt. Der Markt wächst stetig, angetrieben durch die steigende Popularität von Online-Sportspielen und die zunehmende Präferenz für mobilfunkbasierte Sportliga-Software. Darüber hinaus bieten steigende Investitionen in die Entwicklung der Technologieinfrastruktur und die wachsende Teilnahme an Sportaktivitäten lukrative Möglichkeiten für Marktwachstum.
Überblick über den Markt für Sportliga-Software
Mit der Software für Sportligen können Sportadministratoren und -organisatoren Veranstaltungen planen , Einrichtungen verwalten, die Veranstaltungsregistrierung automatisieren und Spielerdaten und Teamzuweisungen verfolgen. Die Software ist mit leistungsstarken Algorithmen und verschiedenen Schnittstellen ausgestattet, die eine effiziente Datenanalyse ermöglichen und Erkenntnisse liefern, die zur Leistungsverbesserung und strategischen Planung beitragen. Normalerweise läuft die Software auf Cloud-basierten Plattformen, einige Versionen unterstützen jedoch auch die Installation vor Ort. Die Software bietet Benutzern die Vorteile der Überwachung und Steuerung vieler Elemente des Sportbetriebs mit minimalem manuellen Aufwand. Sie bietet benutzerfreundliche Dashboards und angepasste Module, die die Verwaltungsarbeit rationalisieren und die Ressourcenzuweisung optimieren. Die wachsenden Investitionen von Bildungseinrichtungen in Sportaktivitäten schaffen jedoch Chancen für das Marktwachstum.
Passen Sie diesen Bericht Ihren Anforderungen an
Sie erhalten kostenlos individuelle Anpassungen an jedem Bericht, einschließlich Teilen dieses Berichts oder einer Analyse auf Länderebene, eines Excel-Datenpakets sowie tolle Angebote und Rabatte für Start-ups und Universitäten.
Markt für Sportliga-Software:
- Holen Sie sich die wichtigsten Markttrends aus diesem Bericht.Dieses KOSTENLOSE Beispiel umfasst eine Datenanalyse von Markttrends bis hin zu Schätzungen und Prognosen.
Treiber und Chancen auf dem Sportliga-Softwaremarkt
Die weltweit zunehmende Popularität von Sportliga-Software treibt den Markt an
Steigende Nachfrage nach Cloud-basierter Sportliga-Software aufgrund des wachsenden Bewusstseins für das Potenzial von Cloud Computing in der Sportbranche. Die Branche sieht den Wert von Cloud Computing darin, rationalisiertere und effektivere Abläufe zu ermöglichen. Cloud-basierte Sportliga-Software ermöglicht es Unternehmen, ihre Sportaktivitäten von überall aus zu verwalten, mit den zusätzlichen Vorteilen von Skalierbarkeit und Kosteneffizienz. Darüber hinaus macht die Sportliga-Software die menschliche Dateneingabe überflüssig, was zu höherer Datengenauigkeit und schnellerer Entscheidungsfindung führt. Diese Faktoren werden voraussichtlich den Markt im Prognosezeitraum antreiben.
Wachsende Teilnahme an sportlichen Aktivitäten – eine Chance auf dem Markt für Sportliga-Software
Eine steigende Zahl an Sportteilnehmern, verbunden mit der wachsenden Zahl an Profisportlern und der steigenden Popularität von Online-Sportspielen, treibt den Markt weltweit an. Dies erhöht die Nachfrage nach Sportliga-Software bei Unternehmen, um ihre Abläufe effektiv zu verwalten und die Rentabilität zu maximieren. Darüber hinaus hat die Verbreitung mobiler Geräte es Sportlern und Sportteams ermöglicht, unterwegs auf Sportliga-Software zuzugreifen, was die Betriebseffizienz steigert. Diese Faktoren schaffen also in naher Zukunft erhebliche Wachstumschancen für den Markt.participations in sports associated with the expanding number of professional athletes and the rising popularity of online sports gaming is driving the market around the world. This increases the demand for sports league software among businesses to effectively manage their operations to maximize profitability. Furthermore, the growth of mobile devices has allowed athletes and sports teams to access sports league software while on the go, hence enhancing operational efficiency. Thus, these factors are creating significant growth opportunities for the market in the near future.
Segmentierungsanalyse des Marktberichts für Sportliga-Software
Wichtige Segmente, die zur Ableitung der Marktanalyse für Sportliga-Software beigetragen haben, sind Bereitstellung und Anwendung.
- Basierend auf der Bereitstellung ist der Markt für Sportliga-Software in Cloud-basierte und On-Premise-Systeme unterteilt. Das Segment der Cloud-basierten Systeme hatte im Jahr 2023 einen größeren Marktanteil.
- In Bezug auf die Anwendung wird der Markt in kleine und mittlere Unternehmen sowie in große Unternehmen unterteilt. Das Segment der großen Unternehmen hatte im Jahr 2023 einen größeren Marktanteil.
Marktanteilsanalyse für Sportliga-Software nach geografischer Lage
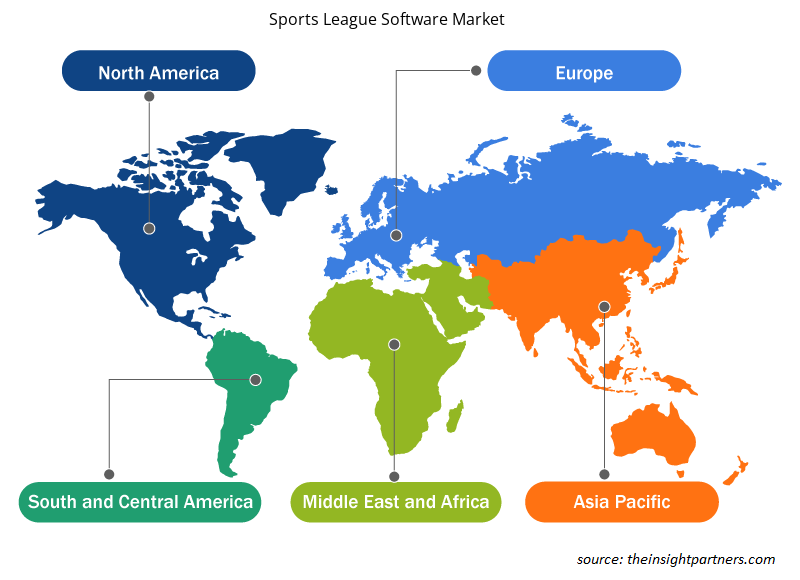
Der geografische Umfang des Marktberichts für Sportliga-Software ist hauptsächlich in fünf Regionen unterteilt: Nordamerika, Asien-Pazifik, Europa, Naher Osten und Afrika sowie Südamerika/Süd- und Mittelamerika.
In Bezug auf den Umsatz hatte Nordamerika den größten Marktanteil im Bereich der Sportliga-Software, was auf die steigende Zahl der Sportteams und den wachsenden Bedarf an kostengünstigen Lösungen für die effiziente Verwaltung von Sportaktivitäten zurückzuführen ist. Es wird erwartet, dass der Markt in naher Zukunft wachsen wird, was auf technologische Fortschritte und die zunehmende Verbreitung von Cloud-basierten Lösungen zurückzuführen ist. Diese Lösungen bieten den Benutzern erhebliche Vorteile, darunter Flexibilität, Skalierbarkeit und Kosteneffizienz, die Sportteams und -organisationen anziehen. Darüber hinaus beflügelt eine zunehmende Zahl von Sportveranstaltungen und Turnieren den Markt im Prognosezeitraum.
Regionale Einblicke in den Markt für Sportliga-Software
Die regionalen Trends und Faktoren, die den Markt für Sportliga-Software im Prognosezeitraum beeinflussen, wurden von den Analysten von Insight Partners ausführlich erläutert. In diesem Abschnitt werden auch die Marktsegmente und die Geografie des Marktes für Sportliga-Software in Nordamerika, Europa, im asiatisch-pazifischen Raum, im Nahen Osten und Afrika sowie in Süd- und Mittelamerika erörtert.
- Erhalten Sie regionale Daten zum Markt für Sportliga-Software
Umfang des Marktberichts zur Sportliga-Software
| Berichtsattribut | Details |
|---|---|
| Marktgröße im Jahr 2023 | 610,62 Millionen US-Dollar |
| Marktgröße bis 2031 | 1.574,29 Millionen US-Dollar |
| Globale CAGR (2023 - 2031) | 12,6 % |
| Historische Daten | 2021-2022 |
| Prognosezeitraum | 2024–2031 |
| Abgedeckte Segmente | Nach Bereitstellung
|
| Abgedeckte Regionen und Länder | Nordamerika
|
| Marktführer und wichtige Unternehmensprofile |
|
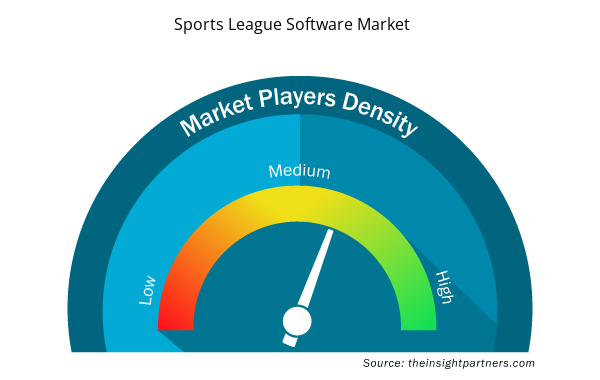
Dichte der Akteure auf dem Markt für Sportliga-Software: Die Auswirkungen auf die Geschäftsdynamik verstehen
Der Markt für Sportliga-Software wächst rasant, angetrieben durch die steigende Nachfrage der Endnutzer aufgrund von Faktoren wie sich entwickelnden Verbraucherpräferenzen, technologischen Fortschritten und einem größeren Bewusstsein für die Vorteile des Produkts. Mit steigender Nachfrage erweitern Unternehmen ihr Angebot, entwickeln Innovationen, um die Bedürfnisse der Verbraucher zu erfüllen, und nutzen neue Trends, was das Marktwachstum weiter ankurbelt.
Die Marktteilnehmerdichte bezieht sich auf die Verteilung der Firmen oder Unternehmen, die in einem bestimmten Markt oder einer bestimmten Branche tätig sind. Sie gibt an, wie viele Wettbewerber (Marktteilnehmer) in einem bestimmten Marktraum im Verhältnis zu seiner Größe oder seinem gesamten Marktwert präsent sind.
Die wichtigsten auf dem Markt für Sportliga-Software tätigen Unternehmen sind:
- ACTIVE Network, LLC
- Engage Sports, LLC
- EZ-Einrichtung
- Jersey-Uhr
- LigaRepublik
- PlayyOn, Inc.
Haftungsausschluss : Die oben aufgeführten Unternehmen sind nicht in einer bestimmten Reihenfolge aufgeführt.
- Überblick über die wichtigsten Akteure auf dem Sportliga-Softwaremarkt
Neuigkeiten und aktuelle Entwicklungen zum Sportliga-Softwaremarkt
Der Markt für Sportliga-Software wird durch die Erfassung qualitativer und quantitativer Daten nach Primär- und Sekundärforschung bewertet, die wichtige Unternehmensveröffentlichungen, Verbandsdaten und Datenbanken umfasst. Im Folgenden finden Sie eine Liste der Entwicklungen auf dem Markt für Sportliga-Software und -Strategien:
- Im Januar 2023 nahm Jonas Club Software an der PGA Show 2023 teil, die vom 24. bis 27. Januar 2023 in Orlando, Florida, stattfand. Das Unternehmen präsentierte seine neuesten innovativen Produkte und Software, darunter eine exklusive Vorschau der komplett neu gestalteten ClubHouse Online Mobile App am Stand Nr. 3929 und anderer Sportmanagement-Software. (Quelle: Jonas Club Software, Pressemitteilung, 2023)
Marktbericht zu Sportliga-Software – Abdeckung und Ergebnisse
Der Bericht „Marktgröße und Prognose für Sportliga-Software (2021–2031)“ bietet eine detaillierte Analyse des Marktes, die die folgenden Bereiche abdeckt:
- Marktgröße und Prognose auf globaler, regionaler und Länderebene für alle wichtigen Marktsegmente, die im Rahmen des Projekts abgedeckt sind
- Marktdynamik wie Treiber, Beschränkungen und wichtige Chancen
- Wichtige Zukunftstrends
- Detaillierte PEST/Porters Five Forces- und SWOT-Analyse
- Globale und regionale Marktanalyse mit wichtigen Markttrends, wichtigen Akteuren, Vorschriften und aktuellen Marktentwicklungen
- Branchenlandschaft und Wettbewerbsanalyse, einschließlich Marktkonzentration, Heatmap-Analyse, prominenten Akteuren und aktuellen Entwicklungen
- Detaillierte Firmenprofile
- Historische Analyse (2 Jahre), Basisjahr, Prognose (7 Jahre) mit CAGR
- PEST- und SWOT-Analyse
- Marktgröße Wert/Volumen – Global, Regional, Land
- Branche und Wettbewerbsumfeld
- Excel-Datensatz

Report Coverage
Revenue forecast, Company Analysis, Industry landscape, Growth factors, and Trends

Segment Covered
This text is related
to segments covered.

Regional Scope
North America, Europe, Asia Pacific, Middle East & Africa, South & Central America

Country Scope
This text is related
to country scope.
Häufig gestellte Fragen
The global sports league software market was estimated to be US$ 610.62 million in 2023 and is expected to grow at a CAGR of 12.6% during the forecast period 2023 - 2031.
The increasing popularity of sports league software worldwide and the growing demand for fan engagement beyond physical events are the major factors that propel the global sports league software market.
The growing number of sports events and tournaments worldwide and the rising demand for digital solutions to play a significant role in the global sports league software market in the coming years.
The key players holding majority shares in the global sports league software market are ACTIVE Network, LLC, Engage Sports, LLC, EZ Facility, Jersey Watch, and LeagueRepublic.
The global sports league software market is expected to reach US$ 1,574.29 million by 2031.
The incremental growth expected to be recorded for the global sports league software market during the forecast period is US$ 963.67 million.
Trends and growth analysis reports related to Technology, Media and Telecommunications : READ MORE..
The Insight Partners performs research in 4 major stages: Data Collection & Secondary Research, Primary Research, Data Analysis and Data Triangulation & Final Review.
- Data Collection and Secondary Research:
As a market research and consulting firm operating from a decade, we have published and advised several client across the globe. First step for any study will start with an assessment of currently available data and insights from existing reports. Further, historical and current market information is collected from Investor Presentations, Annual Reports, SEC Filings, etc., and other information related to company’s performance and market positioning are gathered from Paid Databases (Factiva, Hoovers, and Reuters) and various other publications available in public domain.
Several associations trade associates, technical forums, institutes, societies and organization are accessed to gain technical as well as market related insights through their publications such as research papers, blogs and press releases related to the studies are referred to get cues about the market. Further, white papers, journals, magazines, and other news articles published in last 3 years are scrutinized and analyzed to understand the current market trends.
- Primary Research:
The primarily interview analysis comprise of data obtained from industry participants interview and answers to survey questions gathered by in-house primary team.
For primary research, interviews are conducted with industry experts/CEOs/Marketing Managers/VPs/Subject Matter Experts from both demand and supply side to get a 360-degree view of the market. The primary team conducts several interviews based on the complexity of the markets to understand the various market trends and dynamics which makes research more credible and precise.
A typical research interview fulfils the following functions:
- Provides first-hand information on the market size, market trends, growth trends, competitive landscape, and outlook
- Validates and strengthens in-house secondary research findings
- Develops the analysis team’s expertise and market understanding
Primary research involves email interactions and telephone interviews for each market, category, segment, and sub-segment across geographies. The participants who typically take part in such a process include, but are not limited to:
- Industry participants: VPs, business development managers, market intelligence managers and national sales managers
- Outside experts: Valuation experts, research analysts and key opinion leaders specializing in the electronics and semiconductor industry.
Below is the breakup of our primary respondents by company, designation, and region:

Once we receive the confirmation from primary research sources or primary respondents, we finalize the base year market estimation and forecast the data as per the macroeconomic and microeconomic factors assessed during data collection.
- Data Analysis:
Once data is validated through both secondary as well as primary respondents, we finalize the market estimations by hypothesis formulation and factor analysis at regional and country level.
- Macro-Economic Factor Analysis:
We analyse macroeconomic indicators such the gross domestic product (GDP), increase in the demand for goods and services across industries, technological advancement, regional economic growth, governmental policies, the influence of COVID-19, PEST analysis, and other aspects. This analysis aids in setting benchmarks for various nations/regions and approximating market splits. Additionally, the general trend of the aforementioned components aid in determining the market's development possibilities.
- Country Level Data:
Various factors that are especially aligned to the country are taken into account to determine the market size for a certain area and country, including the presence of vendors, such as headquarters and offices, the country's GDP, demand patterns, and industry growth. To comprehend the market dynamics for the nation, a number of growth variables, inhibitors, application areas, and current market trends are researched. The aforementioned elements aid in determining the country's overall market's growth potential.
- Company Profile:
The “Table of Contents” is formulated by listing and analyzing more than 25 - 30 companies operating in the market ecosystem across geographies. However, we profile only 10 companies as a standard practice in our syndicate reports. These 10 companies comprise leading, emerging, and regional players. Nonetheless, our analysis is not restricted to the 10 listed companies, we also analyze other companies present in the market to develop a holistic view and understand the prevailing trends. The “Company Profiles” section in the report covers key facts, business description, products & services, financial information, SWOT analysis, and key developments. The financial information presented is extracted from the annual reports and official documents of the publicly listed companies. Upon collecting the information for the sections of respective companies, we verify them via various primary sources and then compile the data in respective company profiles. The company level information helps us in deriving the base number as well as in forecasting the market size.
- Developing Base Number:
Aggregation of sales statistics (2020-2022) and macro-economic factor, and other secondary and primary research insights are utilized to arrive at base number and related market shares for 2022. The data gaps are identified in this step and relevant market data is analyzed, collected from paid primary interviews or databases. On finalizing the base year market size, forecasts are developed on the basis of macro-economic, industry and market growth factors and company level analysis.
- Data Triangulation and Final Review:
The market findings and base year market size calculations are validated from supply as well as demand side. Demand side validations are based on macro-economic factor analysis and benchmarks for respective regions and countries. In case of supply side validations, revenues of major companies are estimated (in case not available) based on industry benchmark, approximate number of employees, product portfolio, and primary interviews revenues are gathered. Further revenue from target product/service segment is assessed to avoid overshooting of market statistics. In case of heavy deviations between supply and demand side values, all thes steps are repeated to achieve synchronization.
We follow an iterative model, wherein we share our research findings with Subject Matter Experts (SME’s) and Key Opinion Leaders (KOLs) until consensus view of the market is not formulated – this model negates any drastic deviation in the opinions of experts. Only validated and universally acceptable research findings are quoted in our reports.
We have important check points that we use to validate our research findings – which we call – data triangulation, where we validate the information, we generate from secondary sources with primary interviews and then we re-validate with our internal data bases and Subject matter experts. This comprehensive model enables us to deliver high quality, reliable data in shortest possible time.
 Holen Sie sich ein kostenloses Muster für diesen Bericht