Marktübersicht für Unterseekabel, Wachstum, Trends, Analyse, Forschungsbericht (2022-2030)
Historische Daten : 2020-2022 | Basisjahr : 2022 | Prognosezeitraum : 2022-2030Marktgröße und Prognosen für Unterseekabel (2020 – 2030), globaler und regionaler Anteil, Trends und Berichtsabdeckung zur Analyse von Wachstumschancen: Nach Typ (Single-Core und Multi-Core), Spannung (mittel und hoch), Angebot (Installationsdienste und Wartungs- und Upgrade-Dienste) und Anwendung (Kommunikation und Stromversorgung)
- Status : Veröffentlichte Daten
- Berichtscode : TIPRE00033411
- Kategorie : Elektronik und Halbleiter
- Anzahl der Seiten : 150
- Verfügbare Berichtsformate :


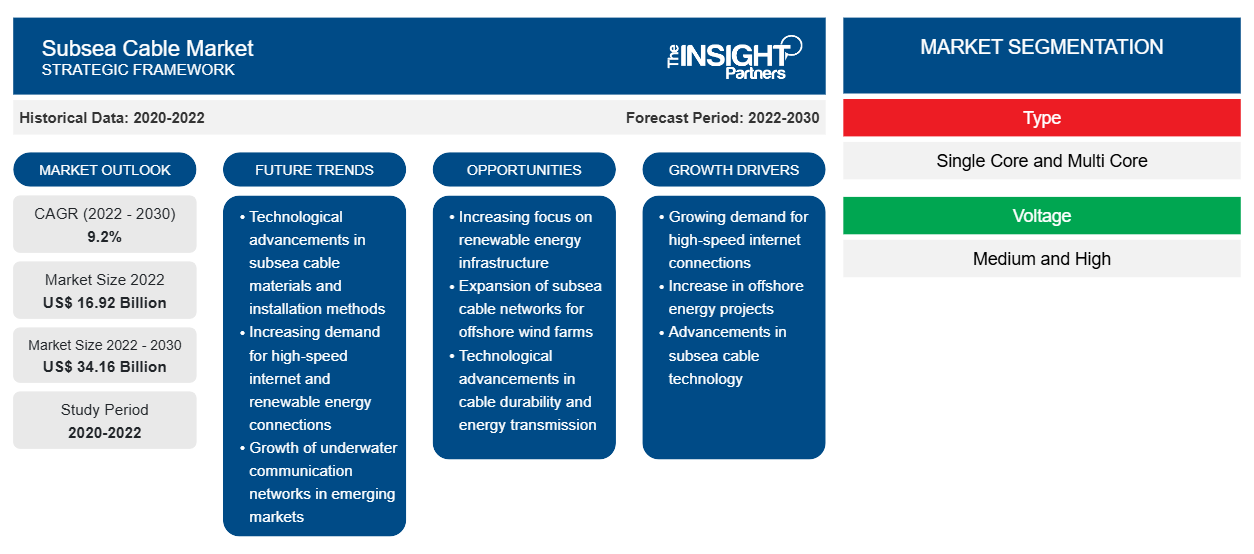
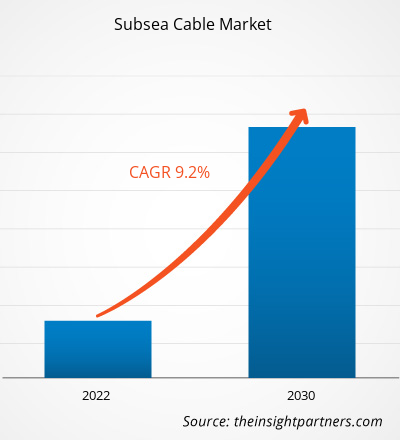
[Forschungsbericht] Der Markt für Unterseekabel wurde im Jahr 2022 auf 16,92 Milliarden US-Dollar geschätzt und soll bis 2030 34,16 Milliarden US-Dollar erreichen; von 2022 bis 2030 wird eine durchschnittliche jährliche Wachstumsrate (CAGR) von 9,2 % erwartet.
Analystenperspektive:
Die wachsende Nachfrage der Verbraucher nach Internet und Smartphones, steigende Investitionen in neue Kabelsysteme und die zunehmende Nutzung von Cloud-Technologie sind einige Faktoren, die das Wachstum des Marktes für Unterseekabel vorantreiben . Unterseekabel werden verwendet, um große Datenmengen schnell zu übertragen und verschiedene Länder auf der ganzen Welt miteinander zu verbinden. Zunehmende Cybersicherheitsangriffe und die hohen Kosten, die mit der Installation von Unterseekabeln verbunden sind, behindern jedoch das Marktwachstum. Darüber hinaus fördert der wachsende Bedarf an Daten- und Kommunikationsflüssen das Marktwachstum weltweit. Darüber hinaus wird erwartet, dass die steigende Zahl neuer Projekte im Zusammenhang mit der Installation von Unterseekabeln im Prognosezeitraum mehrere neue Wachstumschancen für den Markt schaffen wird.
Marktübersicht:
Unterseekabel, auch als Seekabel bekannt, sind lange Glasfaserkabel, die auf dem Meeresboden verlegt werden und zwei oder mehr Landepunkte verbinden. Diese Kabel sind Tausende von Kilometern lang und werden verwendet, um Telekommunikationssignale von einem Punkt zum anderen zu übertragen. Unterseekabel sind wesentliche Komponenten der globalen Telekommunikationsinfrastruktur, z. B. verbinden sie Kontinente, sind Internetkabel und ermöglichen die weltweite Kommunikation. Diese Kabel werden hauptsächlich für den Ferndaten- und Kommunikationstransport verwendet, da sie eine schnelle globale Datenübertragung ermöglichen.
Passen Sie diesen Bericht Ihren Anforderungen an
Sie erhalten kostenlos individuelle Anpassungen an jedem Bericht, einschließlich Teilen dieses Berichts oder einer Analyse auf Länderebene, eines Excel-Datenpakets sowie tolle Angebote und Rabatte für Start-ups und Universitäten.
Markt für Unterseekabel: Strategische Einblicke
-
Holen Sie sich die wichtigsten Markttrends aus diesem Bericht.Dieses KOSTENLOSE Beispiel umfasst eine Datenanalyse von Markttrends bis hin zu Schätzungen und Prognosen.
Markttreiber:
Wachsender Internetverkehr treibt den Markt für Unterseekabel an
Die zunehmende Nutzung des Internets auf der ganzen Welt treibt den globalen Markt an. Laut dem Atlantic Council hängen mehr als 97 % des weltweiten Internetverkehrs von Unterseekabeln ab, und dieser Trend nimmt rapide zu. Die Welt ist über das Internet vernetzt, und fast jeder verlässt sich bei der Bewältigung seiner täglichen Aktivitäten stark darauf, was den Bedarf der Verbraucher an Internetdiensten erhöht. Laut der Internationalen Fernmeldeunion (ITU) wird es bis Ende 2023 weltweit 5,4 Milliarden Internetnutzer geben, was 67 % der Weltbevölkerung entspricht, die das Internet nutzt. Die Nachfrage der Verbraucher nach schnellen Bandbreiten wächst rasant. Darüber hinaus nimmt die Verbreitung von Smartphones weltweit aufgrund der steigenden Zahl der Internetnutzer zu. Laut der GSM Association wird es beispielsweise bis 2025 weltweit 5 Milliarden mobile Internetnutzer geben, bis 2027 8 Milliarden Smartphone-Verbindungen und bis 2030 9,5 Milliarden mobile Verbindungen. Die zunehmende Verbreitung von Smartphones steigert also den Internetverkehr, was das Wachstum des globalen Unterseekabelmarktes vorantreibt.
Berichtssegmentierung und -umfang:
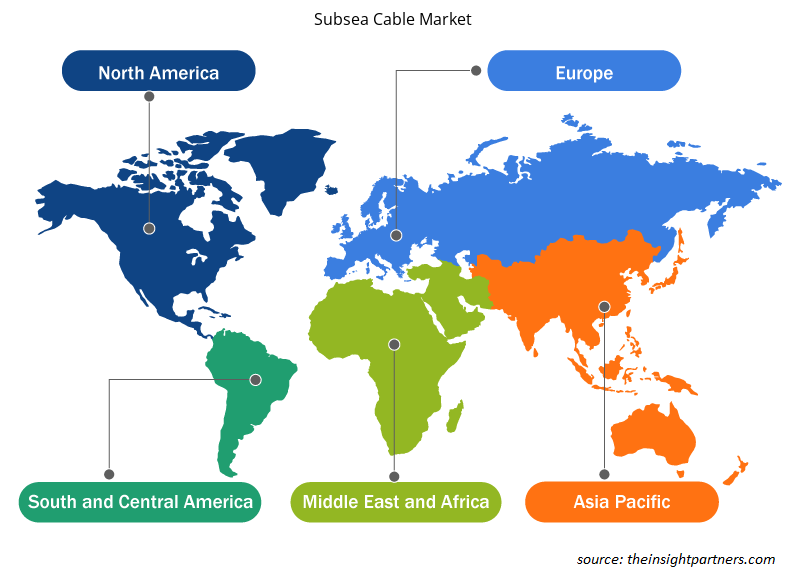
Der Markt für Unterseekabel ist nach Typ, Spannung, Angebot und Anwendung segmentiert. Basierend auf dem Typ ist der Markt in einadrige und mehradrige Kabel segmentiert. In Bezug auf die Spannung ist der Markt in mittel und hoch kategorisiert. Basierend auf dem Angebot ist der Markt für Unterseekabel unterteilt inInstallationsdienste sowie Wartungs- und Upgrade-Dienste. Auf der Grundlage der Anwendung ist der Markt in Kommunikation und Strom unterteilt. Nach Regionen ist der Markt für Unterseekabel in Nordamerika, Europa, Asien-Pazifik (APAC), den Nahen Osten und Afrika (MEA) und Südamerika (SAM) segmentiert.
Segmentanalyse:
Basierend auf dem Angebot ist der Markt zweigeteilt inInstallationsdienste sowie Wartungs- und Upgrade-Dienste. Aufgrund der hohen Kosten für die Kabelinstallation wird erwartet, dass sich das Segment Wartungs- und Upgrade-Dienste im Prognosezeitraum stark entwickeln wird. Die Wartung und Aufrüstung von Unterseekabeln nimmt in der Regel weniger Zeit in Anspruch (bis zu acht Monate) und ist billiger als Neuinstallationen. Darüber hinaus sind installierte Kabel ein wertvolles Gut für ein Land, und die Implementierung neuer Technologien ermöglicht es dem Benutzer, das ursprüngliche Kabel sowohl in Bezug auf Design als auch Kapazität zu verwenden.
Regionale Analyse:
Der asiatisch-pazifische Raum hatte 2022 den größten Marktanteil für Unterseekabel. Der asiatisch-pazifische Markt ist in Australien, China, Japan, Indien, Südkorea und den Rest des asiatisch-pazifischen Raums unterteilt. Die Region trägt aufgrund der hohen Akzeptanz und Investitionen in Unterseekabel in der Region einen bemerkenswerten Anteil zum Weltmarkt bei. Die wachsende Bevölkerung in Ländern wie China und Indien erhöht die Zahl der Internetnutzer in der Region, was den Markt antreibt. Etwa die Hälfte des weltweiten Internetverkehrs wird von Verbrauchern generiert, hauptsächlich aus dem asiatisch-pazifischen Raum, was die Nachfrage nach Unterseekabeln ankurbelt. Der steigende Bedarf an schnelleren Internetdiensten im transpazifischen Raum aufgrund der begrenzten Unterseekommunikationskabel in der Region ermutigt die Regierungen, neue Kabelsysteme in der Region zu entwickeln. So unterzeichnete Japan im Juli 2023 ein Memorandum of Cooperation (MoC) mit der Europäischen Union zur Entwicklung von Unterseekabeln in der Arktis. Diese Kabel verbessern die Konnektivität, indem sie den Internetverkehr auf der ganzen Welt beschleunigen, und sollen bis 2026 betriebsbereit sein.
Darüber hinaus entwickelt sich der asiatisch-pazifische Raum zunehmend zu einem Zentrum für Direktinvestitionen in die Unterseekabelinfrastruktur. So erhielt beispielsweise das 3.200 km lange 4/6/8-Glasfaserpaar-Kabelsystem Chennai-Singapur von den Regierungen beider Länder eine Investition von 100 Milliarden US-Dollar, um das Kabel 2021 betriebsbereit zu machen. Darüber hinaus arbeiten viele Technologiegiganten wie Google, Microsoft und Facebook mit Unterseekabelunternehmen zusammen, um neue Projekte zu entwickeln. So ging Google im Januar 2022 als Investor eine Partnerschaft mit AARNet, Singtel, Indosat Ooredoo, SubPartners und Telstra für ein neues Unterseekabelprojekt ein, das Japan über Guam mit Australien verbinden soll.
Regionale Einblicke in den Markt für Unterseekabel
Die regionalen Trends und Faktoren, die den Markt für Unterseekabel im Prognosezeitraum beeinflussen, wurden von den Analysten von Insight Partners ausführlich erläutert. In diesem Abschnitt werden auch Marktsegmente und Geografien für Unterseekabel in Nordamerika, Europa, im asiatisch-pazifischen Raum, im Nahen Osten und Afrika sowie in Süd- und Mittelamerika erörtert.
- Erhalten Sie regionale Daten zum Markt für Unterseekabel
Umfang des Marktberichts zum Unterseekabel
| Berichtsattribut | Details |
|---|---|
| Marktgröße im Jahr 2022 | 16,92 Milliarden US-Dollar |
| Marktgröße bis 2030 | 34,16 Milliarden US-Dollar |
| Globale CAGR (2022 - 2030) | 9,2 % |
| Historische Daten | 2020-2022 |
| Prognosezeitraum | 2022–2030 |
| Abgedeckte Segmente |
Nach Typ
|
| Abgedeckte Regionen und Länder |
Nordamerika
|
| Marktführer und wichtige Unternehmensprofile |
|
Marktteilnehmerdichte: Der Einfluss auf die Geschäftsdynamik
Der Markt für Unterseekabel wächst rasant, angetrieben durch die steigende Nachfrage der Endnutzer aufgrund von Faktoren wie sich entwickelnden Verbraucherpräferenzen, technologischen Fortschritten und einem größeren Bewusstsein für die Vorteile des Produkts. Mit steigender Nachfrage erweitern Unternehmen ihr Angebot, entwickeln Innovationen, um die Bedürfnisse der Verbraucher zu erfüllen, und nutzen neue Trends, was das Marktwachstum weiter ankurbelt.
Die Marktteilnehmerdichte bezieht sich auf die Verteilung der Firmen oder Unternehmen, die in einem bestimmten Markt oder einer bestimmten Branche tätig sind. Sie gibt an, wie viele Wettbewerber (Marktteilnehmer) in einem bestimmten Marktraum im Verhältnis zu seiner Größe oder seinem gesamten Marktwert präsent sind.
Die wichtigsten auf dem Markt für Unterseekabel tätigen Unternehmen sind:
- Nokia
- SubCom, LLC
- NEC Corporation
- Prysmian SpA
- NKT A/S
Haftungsausschluss : Die oben aufgeführten Unternehmen sind nicht in einer bestimmten Reihenfolge aufgeführt.
- Überblick über die wichtigsten Akteure auf dem Unterseekabelmarkt
Schlüsselspieleranalyse:
Zu den wichtigsten Akteuren auf dem Markt für Unterseekabel, die in dem Bericht porträtiert werden, gehören Nokia; SubCom, LLC; NEC Corporation; Prysmian SpA; NKT A/S; Furukawa Electric Co., Ltd.; Hengtong Group Co., Ltd.; Ciena Corporation; ZTT Cable; und JDR Cable Systems Ltd.
Aktuelle Entwicklungen:
Die Marktteilnehmer verfolgen weitgehend anorganische und organische Strategien. Nachfolgend sind einige aktuelle wichtige Marktentwicklungen aufgeführt:
- Im November 2022 erhielt Reliance Industries Limited die Genehmigung, das weltweit längste Unterseekabel zwischen Singapur und Europa zu verlegen. Die beiden Unterseekabel India-Europe-Xpress (IEX) und India-Asia-Xpress (IAX) sollen zwischen 2023 und 2024 in Betrieb gehen.
- Im Dezember 2022 unterzeichnete Empresa de Telecomunicaciones de Cuba SA eine Vereinbarung mit Orange zur Integration des Arimao-Projekts in das ARCOS-1-Kabelsystem in Cojimar, Kuba. Die Unternehmen planen außerdem, das Projekt bis Ende 2023 betriebsbereit zu machen.
- Im Oktober 2021 gab die NEC Corporation bekannt, dass ihre Tochtergesellschaft OCC Corporation mit Sumitomo Electric Industries Ltd. zusammengearbeitet hat, um ein vier Millionen Tonnen schweres Glasfaser-Unterseekabel für Facebook zu entwickeln. Dieses Kabelsystem erhöht die Anzahl unabhängiger Datenkanäle, indem es die Untersee-Space-Division-Multiplexing-Technologie (SDM) der nächsten Generation ermöglicht.

Naveen ist ein erfahrener Marktforschungs- und Beratungsexperte mit über 9 Jahren Erfahrung in kundenspezifischen, syndizierten und Beratungsprojekten. In seiner aktuellen Funktion als Associate Vice President hat er erfolgreich Stakeholder entlang der gesamten Projektwertschöpfungskette gemanagt und ist Autor von über 100 Forschungsberichten und über 30 Beratungsaufträgen. Seine Arbeit erstreckt sich auf Industrie- und Regierungsprojekte und trägt maßgeblich zum Kundenerfolg und zur datengesteuerten Entscheidungsfindung bei.
Naveen hat einen Ingenieursabschluss in Elektronik und Kommunikation von der VTU, Karnataka, und einen MBA in Marketing und Operations von der Manipal University. Er ist seit 9 Jahren aktives IEEE-Mitglied und nimmt an Konferenzen und technischen Symposien teil und engagiert sich ehrenamtlich auf Sektions- und regionaler Ebene. Vor seiner aktuellen Position arbeitete er als Associate Strategic Consultant bei IndustryARC und als Industrial Server Consultant bei Hewlett Packard (HP Global).
- Historische Analyse (2 Jahre), Basisjahr, Prognose (7 Jahre) mit CAGR
- PEST- und SWOT-Analyse
- Marktgröße Wert/Volumen – Global, Regional, Land
- Branchen- und Wettbewerbslandschaft
- Excel-Datensatz
Erfahrungsberichte
Der SCADA-Systemmarktbericht von Insight Partners ist umfassend und bietet wertvolle Einblicke in aktuelle Trends und Zukunftsprognosen. Das Team war durchweg hochprofessionell, reaktionsschnell und hilfsbereit. Wir sind sehr zufrieden und können die Dienstleistungen wärmstens empfehlen.
RAN KEDEM Partner, Reali Technologies LTDsIch habe einen Bericht über einen sehr spezifischen Softwaremarkt angefordert, und das Team hat ihn innerhalb weniger Tage erstellt. Die Informationen waren sehr relevant und gut präsentiert. Anschließend habe ich einige Änderungen und Ergänzungen zum Bericht angefordert. Das Team reagierte erneut sehr schnell, und ich erhielt den Abschlussbericht in weniger als einer Woche.
JEAN-HERVE JENN Vorsitzende, Future AnalyticaWir haben mit The Insight Partners für eine wichtige Marktstudie und Prognose zusammengearbeitet. Sie gaben uns klare Einblicke in Chancen und Risiken, die uns bei der Gestaltung unserer Pläne halfen. Ihre Recherchen waren benutzerfreundlich und basierten auf soliden Daten. Sie halfen uns, kluge und sichere Entscheidungen zu treffen. Wir können sie wärmstens empfehlen.
PIYUSH NAGPAL Sr. Vizepräsident, Fernlicht GlobalDie Insight Partners lieferten aufschlussreiche, gut strukturierte Marktforschung mit fundierter Fachkompetenz. Ihr Team war durchweg professionell und reaktionsschnell. Die benutzerfreundliche Website ermöglichte den Zugriff auf Branchenberichte. Wir empfehlen sie wärmstens für zuverlässige und hochwertige Forschungsdienstleistungen.
YUKIHIKO ADACHI Geschäftsführer, Deep Blue, LLC.Dies ist das erste Mal, dass ich einen Marktbericht von The Insight Partners erworben habe. Obwohl ich zunächst unsicher war, besuchte ich die Website und fühlte mich dann sicherer, das Risiko einzugehen und einen Marktbericht zu kaufen. Ich bin mit der Qualität des Berichts und dem Kundenservice rundum zufrieden. Ich hatte einige Fragen und Anmerkungen zum ersten Bericht, aber nach einigen E-Mail-Gesprächen mit dem Analysten bin ich überzeugt, dass ich einen Bericht habe, den ich als Input für unseren strategischen Planungsprozess verwenden kann. Vielen Dank, dass Sie sich die Zeit genommen und dies zu einer positiven Erfahrung gemacht haben. Ich werde Ihren Service auf jeden Fall weiterempfehlen und Sie werden meine erste Anlaufstelle sein, wenn wir weitere Marktdaten benötigen.
JOHN SUZUKI Präsident und Chief Executive Officer, Vorstandsmitglied, BK TechnologiesIch möchte mich für Ihre Unterstützung und die Professionalität bedanken, die Sie bei der Bearbeitung meiner Informationsanfrage zum IVD-Markt für Infektionskrankheiten in Nigeria gezeigt haben. Ich schätze Ihre Geduld, Ihre Beratung und die Tatsache, dass Sie bereit waren, einen Rabatt anzubieten, der uns schließlich den Abschluss eines Geschäfts ermöglichte. Ich freue mich darauf, The Insight Partners in Zukunft wieder zu beauftragen, dank des Eindrucks, den Sie bei dieser ersten Begegnung bei mir hinterlassen haben.
DR. CHIJIOKE ONYIA GESCHÄFTSFÜHRERIN, PineCrest Healthcare Ltd.Grund zum Kauf
- Fundierte Entscheidungsfindung
- Marktdynamik verstehen
- Wettbewerbsanalyse
- Kundeneinblicke
- Marktprognosen
- Risikominimierung
- Strategische Planung
- Investitionsbegründung
- Identifizierung neuer Märkte
- Verbesserung von Marketingstrategien
- Steigerung der Betriebseffizienz
- Anpassung an regulatorische Trends


Exklusive Berichtsrabatte freischalten
Jetzt anfragen


 Kostenlose Probe anfordern für - Markt für Unterseekabel