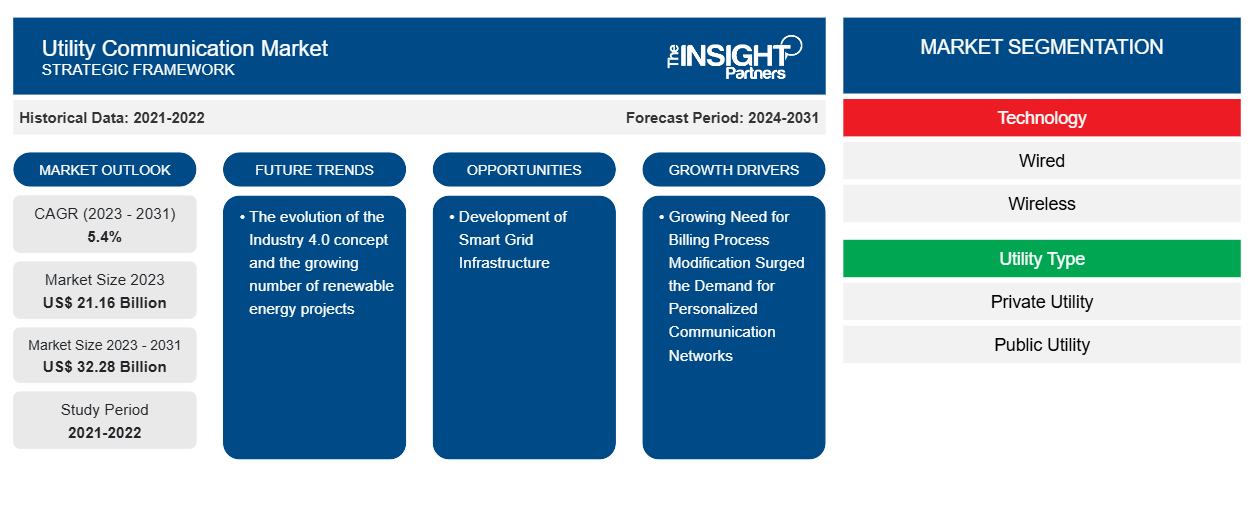
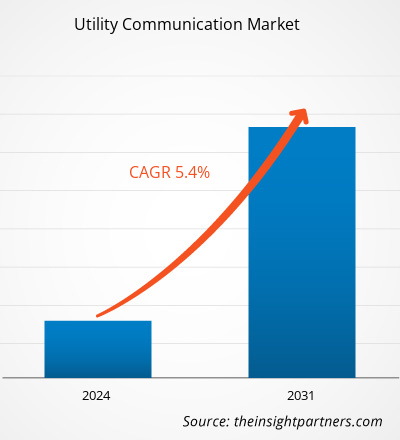
Der Markt für Versorgungskommunikation soll von 21,16 Milliarden US-Dollar im Jahr 2023 auf 32,28 Milliarden US-Dollar im Jahr 2031 anwachsen. Der Markt soll zwischen 2023 und 2031 eine durchschnittliche jährliche Wachstumsrate (CAGR) von 5,4 % verzeichnen. Die Entwicklung des Konzepts Industrie 4.0 und die wachsende Zahl von Projekten im Bereich erneuerbare Energien werden voraussichtlich weiterhin wichtige Trends auf dem Markt für Versorgungskommunikation bleiben.
Marktanalyse für Versorgungskommunikation
Der Markt für Versorgungskommunikation wächst rasant, da der Bedarf an Änderungen bei Abrechnungsprozessen steigt, die Nachfrage nach personalisierten Kommunikationsnetzen steigt und die Nachfrage nach verteilten Energieressourcen (DER) zunimmt. Der Markt wächst stetig, angetrieben von günstigen Regierungsinitiativen und Investitionen zur Förderung der Entwicklung der Energieinfrastruktur. Darüber hinaus bieten die Entwicklung der Smart-Grid-Infrastruktur und die zunehmende Einführung technologisch fortschrittlicher Systeme, die mit dem Internet der Dinge (IoT) und künstlicher Intelligenz (KI) integriert sind, lukrative Möglichkeiten für Marktwachstum.
Überblick über den Markt für Versorgungskommunikation
Bei der Versorgungskommunikation handelt es sich um Systeme, die eine zuverlässigere und sicherere Übertragung von Daten, Videos und Sprache über WANs und LANs gewährleisten. Dieses Kommunikationssystem bietet Benutzern die Vorteile einer einfachen Installation an gefährlichen Orten. Das Versorgungskommunikationssystem funktioniert unter Verwendung zahlreicher Netzwerke, darunter Videoüberwachung, Smart Grid, Überwachungssteuerungs- und Datenerfassungssystem (SADA) und Ethernet-basierte Konnektivität. Darüber hinaus beflügelt die wachsende Nachfrage der Versorgungsunternehmen nach kabelgebundenen und kabellosen Kommunikationssystemen zur Überwachung des Stromverbrauchs und der Stromverteilung den Markt im Prognosezeitraum.
Passen Sie diesen Bericht Ihren Anforderungen an
Sie erhalten kostenlose Anpassungen an jedem Bericht, einschließlich Teilen dieses Berichts oder einer Analyse auf Länderebene, eines Excel-Datenpakets sowie tolle Angebote und Rabatte für Start-ups und Universitäten.
Markt für Versorgungskommunikation:
- Holen Sie sich die wichtigsten Markttrends aus diesem Bericht.Dieses KOSTENLOSE Beispiel umfasst eine Datenanalyse von Markttrends bis hin zu Schätzungen und Prognosen.
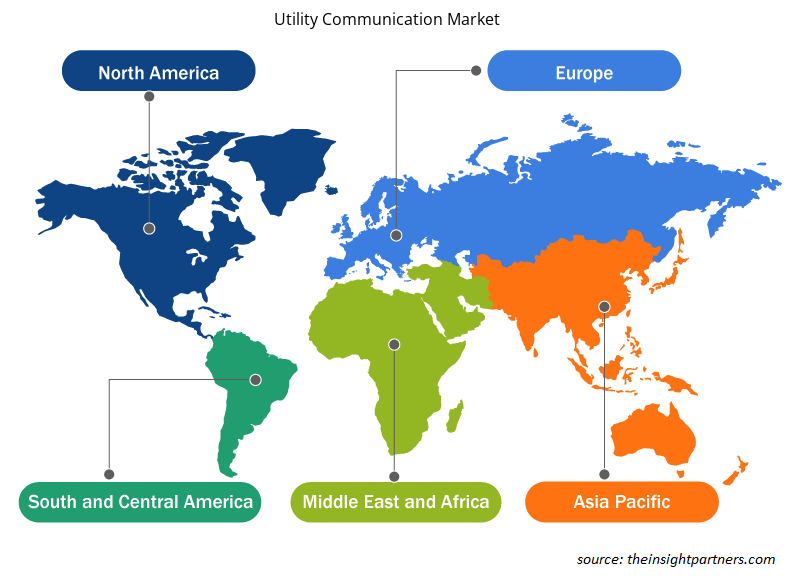
Regionale Einblicke in den Markt für Versorgungskommunikation
Die regionalen Trends und Faktoren, die den Markt für Versorgungskommunikation im Prognosezeitraum beeinflussen, wurden von den Analysten von Insight Partners ausführlich erläutert. In diesem Abschnitt werden auch die Marktsegmente und die Geografie des Marktes für Versorgungskommunikation in Nordamerika, Europa, im asiatisch-pazifischen Raum, im Nahen Osten und Afrika sowie in Süd- und Mittelamerika erörtert.
- Erhalten Sie regionale Daten zum Markt für Versorgungskommunikation
Umfang des Marktberichts zur Versorgungskommunikation
| Berichtsattribut | Details |
|---|---|
| Marktgröße im Jahr 2023 | 21,16 Milliarden US-Dollar |
| Marktgröße bis 2031 | 32,28 Milliarden US-Dollar |
| Globale CAGR (2023 - 2031) | 5,4 % |
| Historische Daten | 2021-2022 |
| Prognosezeitraum | 2024–2031 |
| Abgedeckte Segmente | Nach Technologie
|
| Abgedeckte Regionen und Länder | Nordamerika
|
| Marktführer und wichtige Unternehmensprofile |
|
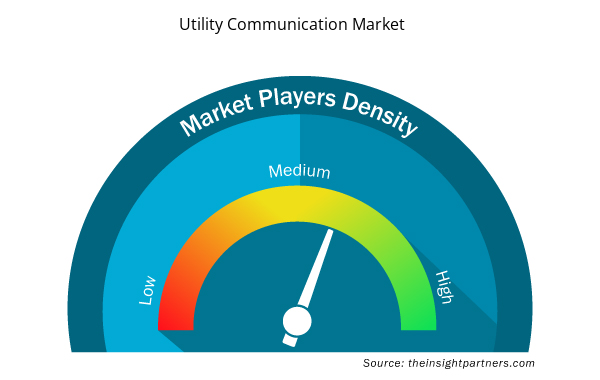
Marktteilnehmerdichte: Der Einfluss auf die Geschäftsdynamik
Der Markt für Versorgungskommunikation wächst rasant, angetrieben durch die steigende Nachfrage der Endnutzer aufgrund von Faktoren wie sich entwickelnden Verbraucherpräferenzen, technologischen Fortschritten und einem größeren Bewusstsein für die Vorteile des Produkts. Mit steigender Nachfrage erweitern Unternehmen ihr Angebot, entwickeln Innovationen, um die Bedürfnisse der Verbraucher zu erfüllen, und nutzen neue Trends, was das Marktwachstum weiter ankurbelt.
Die Marktteilnehmerdichte bezieht sich auf die Verteilung der Firmen oder Unternehmen, die in einem bestimmten Markt oder einer bestimmten Branche tätig sind. Sie gibt an, wie viele Wettbewerber (Marktteilnehmer) in einem bestimmten Marktraum im Verhältnis zu seiner Größe oder seinem gesamten Marktwert präsent sind.
Die wichtigsten auf dem Markt für Versorgungskommunikation tätigen Unternehmen sind:
- ABB Ltd
- FUJITSU LIMITED
- Allgemeine Elektrizit?tsgesellschaft
- Honeywell International Inc
- OMICRON Electronics GmbH
- Rockwell Automation
Haftungsausschluss : Die oben aufgeführten Unternehmen sind nicht in einer bestimmten Reihenfolge aufgeführt.
- Überblick über die wichtigsten Akteure auf dem Markt für Versorgungskommunikation
- Historische Analyse (2 Jahre), Basisjahr, Prognose (7 Jahre) mit CAGR
- PEST- und SWOT-Analyse
- Marktgröße Wert/Volumen – Global, Regional, Land
- Branche und Wettbewerbsumfeld
- Excel-Datensatz

Report Coverage
Revenue forecast, Company Analysis, Industry landscape, Growth factors, and Trends

Segment Covered
This text is related
to segments covered.

Regional Scope
North America, Europe, Asia Pacific, Middle East & Africa, South & Central America

Country Scope
This text is related
to country scope.
Häufig gestellte Fragen
The incremental growth expected to be recorded for the global utility communication market during the forecast period is US$ 11.12 billion.
The global utility communication market is expected to reach US$ 32.28 billion by 2031.
The key players holding majority shares in the global utility communication market are ABB Ltd, Fujitsu Limited, General Electric Company, Honeywell International Inc, and Omicron Electronics GmbH.
The evolution of the Industry 4.0 concept and the growing number of renewable energy projects to play a significant role in the global utility communication market in the coming years.
The growing need for billing process modification surged the demand for personalized communication networks and the increasing demand for distributed energy resources (DER) are the major factors that propel the global utility communication market.
The global utility communication market was estimated to be US$ 21.16 billion in 2023 and is expected to grow at a CAGR of 5.4% during the forecast period 2023 - 2031.
Trends and growth analysis reports related to Electronics and Semiconductor : READ MORE..
The Insight Partners performs research in 4 major stages: Data Collection & Secondary Research, Primary Research, Data Analysis and Data Triangulation & Final Review.
- Data Collection and Secondary Research:
As a market research and consulting firm operating from a decade, we have published and advised several client across the globe. First step for any study will start with an assessment of currently available data and insights from existing reports. Further, historical and current market information is collected from Investor Presentations, Annual Reports, SEC Filings, etc., and other information related to company’s performance and market positioning are gathered from Paid Databases (Factiva, Hoovers, and Reuters) and various other publications available in public domain.
Several associations trade associates, technical forums, institutes, societies and organization are accessed to gain technical as well as market related insights through their publications such as research papers, blogs and press releases related to the studies are referred to get cues about the market. Further, white papers, journals, magazines, and other news articles published in last 3 years are scrutinized and analyzed to understand the current market trends.
- Primary Research:
The primarily interview analysis comprise of data obtained from industry participants interview and answers to survey questions gathered by in-house primary team.
For primary research, interviews are conducted with industry experts/CEOs/Marketing Managers/VPs/Subject Matter Experts from both demand and supply side to get a 360-degree view of the market. The primary team conducts several interviews based on the complexity of the markets to understand the various market trends and dynamics which makes research more credible and precise.
A typical research interview fulfils the following functions:
- Provides first-hand information on the market size, market trends, growth trends, competitive landscape, and outlook
- Validates and strengthens in-house secondary research findings
- Develops the analysis team’s expertise and market understanding
Primary research involves email interactions and telephone interviews for each market, category, segment, and sub-segment across geographies. The participants who typically take part in such a process include, but are not limited to:
- Industry participants: VPs, business development managers, market intelligence managers and national sales managers
- Outside experts: Valuation experts, research analysts and key opinion leaders specializing in the electronics and semiconductor industry.
Below is the breakup of our primary respondents by company, designation, and region:

Once we receive the confirmation from primary research sources or primary respondents, we finalize the base year market estimation and forecast the data as per the macroeconomic and microeconomic factors assessed during data collection.
- Data Analysis:
Once data is validated through both secondary as well as primary respondents, we finalize the market estimations by hypothesis formulation and factor analysis at regional and country level.
- Macro-Economic Factor Analysis:
We analyse macroeconomic indicators such the gross domestic product (GDP), increase in the demand for goods and services across industries, technological advancement, regional economic growth, governmental policies, the influence of COVID-19, PEST analysis, and other aspects. This analysis aids in setting benchmarks for various nations/regions and approximating market splits. Additionally, the general trend of the aforementioned components aid in determining the market's development possibilities.
- Country Level Data:
Various factors that are especially aligned to the country are taken into account to determine the market size for a certain area and country, including the presence of vendors, such as headquarters and offices, the country's GDP, demand patterns, and industry growth. To comprehend the market dynamics for the nation, a number of growth variables, inhibitors, application areas, and current market trends are researched. The aforementioned elements aid in determining the country's overall market's growth potential.
- Company Profile:
The “Table of Contents” is formulated by listing and analyzing more than 25 - 30 companies operating in the market ecosystem across geographies. However, we profile only 10 companies as a standard practice in our syndicate reports. These 10 companies comprise leading, emerging, and regional players. Nonetheless, our analysis is not restricted to the 10 listed companies, we also analyze other companies present in the market to develop a holistic view and understand the prevailing trends. The “Company Profiles” section in the report covers key facts, business description, products & services, financial information, SWOT analysis, and key developments. The financial information presented is extracted from the annual reports and official documents of the publicly listed companies. Upon collecting the information for the sections of respective companies, we verify them via various primary sources and then compile the data in respective company profiles. The company level information helps us in deriving the base number as well as in forecasting the market size.
- Developing Base Number:
Aggregation of sales statistics (2020-2022) and macro-economic factor, and other secondary and primary research insights are utilized to arrive at base number and related market shares for 2022. The data gaps are identified in this step and relevant market data is analyzed, collected from paid primary interviews or databases. On finalizing the base year market size, forecasts are developed on the basis of macro-economic, industry and market growth factors and company level analysis.
- Data Triangulation and Final Review:
The market findings and base year market size calculations are validated from supply as well as demand side. Demand side validations are based on macro-economic factor analysis and benchmarks for respective regions and countries. In case of supply side validations, revenues of major companies are estimated (in case not available) based on industry benchmark, approximate number of employees, product portfolio, and primary interviews revenues are gathered. Further revenue from target product/service segment is assessed to avoid overshooting of market statistics. In case of heavy deviations between supply and demand side values, all thes steps are repeated to achieve synchronization.
We follow an iterative model, wherein we share our research findings with Subject Matter Experts (SME’s) and Key Opinion Leaders (KOLs) until consensus view of the market is not formulated – this model negates any drastic deviation in the opinions of experts. Only validated and universally acceptable research findings are quoted in our reports.
We have important check points that we use to validate our research findings – which we call – data triangulation, where we validate the information, we generate from secondary sources with primary interviews and then we re-validate with our internal data bases and Subject matter experts. This comprehensive model enables us to deliver high quality, reliable data in shortest possible time.
 Holen Sie sich ein kostenloses Muster für diesen Bericht