Mercado de dispensadores de combustible de África: mapeo competitivo y perspectivas estratégicas para 2030
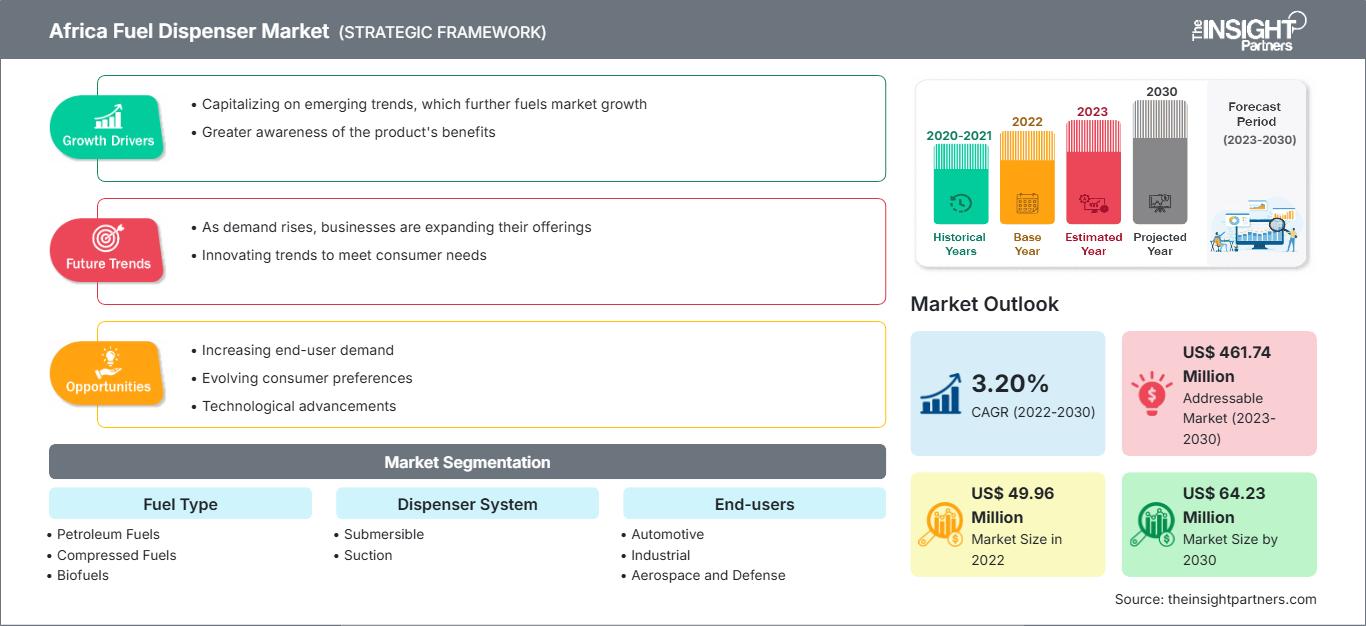
Datos históricos : 2020-2021 | Año base : 2022 | Período de pronóstico : 2023-2030Tamaño y pronóstico del mercado de dispensadores de combustible de África (2020-2030), participación global y regional, cobertura del informe de análisis de tendencias y oportunidades de crecimiento: por tipo de combustible (combustibles de petróleo, combustibles comprimidos, biocombustibles), sistema de dispensador (sumergible, succión), extremo usuarios (automoción, industrial, aeroespacial y de defensa, marítimo, otros) y país
- Estado : Publicada
- Código de informe : TIPRE00038844
- Categoría : Fabricación y construcción
- Número de páginas : 156
- Formatos de informe disponibles :


El mercado de dispensadores de combustible de África se valoró en US$ 49,96 millones en 2022 y se proyecta que alcance los US$ 64,23 millones para 2030; se espera que registre una CAGR del 3,20% durante 2022-2030.
Perspectiva del analista:
El mercado africano de surtidores de combustible estuvo dominado por Nigeria y Egipto, con cuotas de mercado del 34,60% y el 20,19%, respectivamente, en 2022. Nigeria y Egipto se encuentran entre las principales economías de la región. El yacimiento de gas natural de Nigeria alcanzó los 208,62 billones de pies cúbicos en 2022. El gobierno nigeriano está invirtiendo fuertemente en gas natural comprimido para su adopción en los sectores automotriz y de transporte. Egipto ha tomado medidas significativas para la conversión de automóviles al gas natural comprimido (GNC). Por ejemplo, en enero de 2021, el gobierno egipcio anunció su plan para aumentar el número de automóviles propulsados por gas natural comprimido. La producción de gas natural de Egipto se considera autosuficiente.
Descripción general del mercado:
Un surtidor de combustible es un equipo esencial en las gasolineras, ya que ofrece una forma segura y eficiente de suministrar gasolina, diésel u otros combustibles a los automóviles. Mide y dispensa el combustible correctamente, garantizando que los consumidores solo paguen por lo que reciben.
La creciente demanda de combustible en África, impulsada por el sólido crecimiento económico y la creciente urbanización, está a punto de impulsar el mercado africano de surtidores de combustible a nuevas cotas. A medida que las economías se expanden, se produce un aumento simultáneo del consumo energético en diversos sectores. La urbanización amplifica esta demanda, lo que requiere una infraestructura sofisticada de distribución de combustible. El aumento de los centros urbanos y de los centros de actividad económica intensifica la necesidad de redes de transporte eficientes, impulsando así el crecimiento del mercado africano de surtidores de combustible. La mayor dependencia de los automóviles y del transporte público en las zonas urbanas subraya el papel fundamental que desempeñan los sistemas de surtidores de combustible para satisfacer la creciente demanda de combustible. La modernización de la infraestructura de venta minorista de combustible en numerosos países africanos representa un cambio estratégico que impactará significativamente e impulsará el mercado africano de surtidores de combustible en toda la región.
Personalice este informe según sus necesidades
Obtenga PERSONALIZACIÓN GRATUITAMercado de surtidores de combustible en África: Perspectivas estratégicas
-
Obtenga las principales tendencias clave del mercado de este informe.Esta muestra GRATUITA incluirá análisis de datos, desde tendencias del mercado hasta estimaciones y pronósticos.
Conductor del mercado:
La creciente demanda de combustible en África, impulsada por el sólido crecimiento económico y la creciente urbanización, está a punto de impulsar el mercado africano de surtidores de combustible a nuevas cotas. A medida que las economías se expanden, se produce un aumento proporcional del consumo de energía en diversos sectores. La urbanización amplifica esta demanda, lo que requiere una infraestructura de distribución de combustible sofisticada. El aumento de los centros urbanos y de los centros de actividad económica intensifica la necesidad de redes de transporte eficientes, lo que impulsa la demanda de surtidores de combustible. La mayor dependencia de los automóviles y del transporte público en las zonas urbanas pone de relieve el papel fundamental que desempeñan los sistemas de surtidores de combustible para satisfacer la creciente demanda de combustible. La siguiente tabla muestra la demanda constante de combustible de Sudáfrica a lo largo de 2022. Se prevé que esta tendencia ofrezca prometedoras oportunidades de crecimiento para el mercado africano de surtidores de combustible en los próximos años.
Volumen de ventas/consumo de combustible de Sudáfrica de enero a diciembre (2022)
Volumen en millones de litros |
|||||
|
Nombre del producto |
T1- Enero a marzo |
T2 - Abril a junio |
T3 - Julio a septiembre |
T4 - Octubre a diciembre |
Gran total |
|
Diésel (todos los grados) |
3231.73 |
3133.18 |
3243.82 |
3108.58 |
12717.32 |
|
Gasolina (todos los grados) |
2341.86 |
2236.06 |
2215.98 |
2390.95 |
9184.86 |
|
Combustible para aviones |
348.61 |
337.00 |
366.94 |
425.58 |
1478.14 |
|
Parafina |
305.53 |
299.68 |
300.79 |
271.88 |
1177.89 |
|
Aceite de horno |
146.34 |
144.65 |
138.67 |
164.36 |
594.04 |
|
GLP |
90.98 |
86.75 |
68.72 |
76.92 |
323.38 |
|
Gasolina de aviación |
1.49 |
1.23 |
0.90 |
1.06 |
4.69 |
|
Gran total |
6466.58 |
6238.57 |
6335.84 |
6439.36 |
25480.37 |
Simultáneamente, la industrialización que se extiende por el continente intensifica la necesidad de un suministro continuo e ininterrumpido de combustible. Las industrias, componentes esenciales del desarrollo económico, demandan una fuente de energía fiable para los procesos de fabricación y el transporte. Esta mayor actividad industrial incrementa la necesidad de surtidores de combustible ubicados estratégicamente cerca de zonas industriales. El panorama económico de África evoluciona dinámicamente, lo que representa una oportunidad estratégica para los actores del mercado africano de surtidores de combustible. Invertir en tecnologías avanzadas y ampliar la red de distribución de combustible para satisfacer la creciente demanda se alinea con la trayectoria del desarrollo económico de la región. A medida que la conexión entre el crecimiento económico, la urbanización y la industrialización impulsa la demanda de surtidores de combustible, los actores proactivos de la industria pueden capitalizar este creciente crecimiento del mercado africano de surtidores de combustible, impulsando la innovación, el desarrollo de infraestructura y el progreso económico sostenible en toda África.
Análisis segmentario:
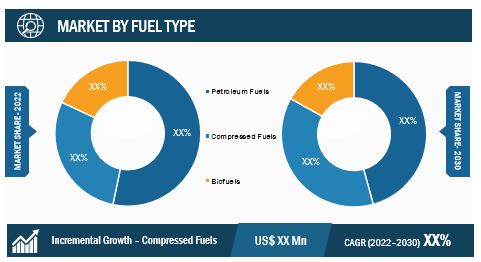
El mercado africano de surtidores de combustible se caracteriza por una amplia gama de tipos de combustible, cada uno de los cuales satisface demandas específicas y preferencias regionales. Estos tipos de combustible incluyen combustibles derivados del petróleo, combustibles comprimidos y biocombustibles. Esta segmentación refleja el dinámico panorama energético del continente y la transición continua hacia opciones de combustible más limpias y sostenibles. Los surtidores de diésel siguen desempeñando un papel crucial en el apoyo a los sectores del transporte, la industria y la agricultura. La demanda constante de diésel subraya su importancia para la propulsión de diversos vehículos y maquinaria. Los surtidores de gasolina siguen siendo esenciales para vehículos particulares y comerciales. A pesar del creciente interés en los combustibles alternativos, la gasolina mantiene una cuota de mercado significativa, especialmente en las zonas urbanas. La adopción del GNC como alternativa más limpia está cobrando impulso. Países africanos, como Egipto, lideran el desarrollo de infraestructuras de GNC, con un número creciente de vehículos propulsados por GNC y una red de estaciones de servicio en expansión. Los combustibles mezclados con etanol son cada vez más populares, y los surtidores de biocombustibles satisfacen la demanda de alternativas más limpias. Iniciativas como el uso de yuca como materia prima por parte de Sunbird Bioenergy en Zambia indican un creciente interés en los biocombustibles sostenibles, lo que está impulsando el crecimiento de la participación de Zambia en el mercado de dispensadores de combustible de África.
- Esta muestra GRATUITA incluirá análisis de datos, desde tendencias del mercado hasta estimaciones y pronósticos.
Análisis regional:
El mercado africano de surtidores de combustible estuvo dominado por Nigeria y Egipto, con cuotas de mercado del 34,60% y el 20,19%, respectivamente, en 2022. Las economías de Nigeria y Egipto se encuentran entre las principales de la región. Además, la industria del transporte marítimo en Nigeria se está desarrollando rápidamente. El comercio marítimo de Nigeria tiene una conexión directa con la industria del petróleo y el gas del país. Nigeria, el mayor productor de petróleo de África, exporta productos petrolíferos, como petróleo crudo, petróleo refinado y gas natural licuado (GNL), a través de canales marítimos. Nigeria es el mayor país armador de África, con 291 buques que totalizan 7,94 millones de toneladas de peso muerto. Los buques de propiedad nigeriana ocuparon el puesto 30 en valor de buques, representando el 0,56% del valor de la flota mundial. Como resultado, hay un aumento en la cuota de mercado de surtidores de combustible de África en el sector marítimo de Nigeria.
Además de Nigeria y Egipto, Argelia y Kenia son algunos de los países africanos destacados donde la demanda está creciendo. Argelia es el mayor productor de petróleo crudo y gas natural de África. Argelia contaba con un estimado de 159 billones de pies cúbicos de reservas probadas de gas natural a principios de 2023. Argelia produjo más gas natural en 2021 que en cualquier año anterior. Kenia es una de las economías de más rápido desarrollo de África. En el tercer trimestre de 2023, el PIB de Kenia aumentó un 5,9 % interanual, en comparación con el 4,3 % del mismo trimestre de 2022. A medida que crece la demanda de combustible en el país, el consumo de combustible también aumenta continuamente. Este aumento del consumo de combustible impulsa el crecimiento del mercado de surtidores de combustible en África.

- Esta muestra GRATUITA incluirá análisis de datos, desde tendencias del mercado hasta estimaciones y pronósticos.
Análisis de los jugadores clave:
Tiger Pump; Ehad Fuel Equipment; FTI Group Ltd.; SAMD; Smartflow; Galileo Technologies SA; Eaglestar Energy Technology Co., Ltd.; Dover Fuelling Stations; Prowalco; y Gilbarco Veeder-Root son los participantes destacados del mercado de dispensadores de combustible de África.
Desarrollos recientes:
Las estrategias inorgánicas y orgánicas, como las fusiones y adquisiciones, son ampliamente adoptadas por las empresas del mercado africano de surtidores de combustible. La iniciativa de mercado es una estrategia adoptada por los actores del mercado africano de surtidores de combustible para expandir su presencia global y satisfacer la creciente demanda de los clientes. Los actores presentes se centran principalmente en la mejora de productos y servicios mediante la integración de funciones y tecnologías avanzadas en sus ofertas. A continuación, se enumeran algunos desarrollos recientes de los actores clave:
Año |
Noticias |
|
Abril de 2022 |
Helmerich & Payne (H&P) invirtió US$ 33 millones en Galileo Technologies, reforzando la plataforma tecnológica única de la compañía destinada a descarbonizar la cadena de suministro de energía. |
Alcance del informe sobre los surtidores de combustible en África
| Atributo del informe | Detalles |
|---|---|
| Tamaño del mercado en 2022 | US$ 49,96 millones |
| Tamaño del mercado en 2030 | US$ 64,23 millones |
| Tasa de crecimiento anual compuesta (TCAC) (2022-2030) | 3,20% |
| Datos históricos | 2020-2021 |
| Período de pronóstico | 2023-2030 |
| Segmentos cubiertos |
Por tipo de combustible
|
| Regiones y países cubiertos |
África
|
| Líderes del mercado y perfiles de empresas clave |
|

Nivedita es una investigadora con más de 9 años de experiencia en Investigación de Mercados y Consultoría de Negocios. Actualmente se desempeña como Gerente de Proyectos en el área de TIC en The Insight Partners, y aporta una amplia experiencia en la gestión y ejecución de proyectos de investigación sindicados, personalizados, por suscripción y de consultoría en diversos sectores tecnológicos.
Con una trayectoria comprobada en la entrega de análisis basados en datos e información práctica, Nivedita ha sido una colaboradora clave en varios proyectos cruciales. Su trabajo abarca la ejecución integral de proyectos, desde la comprensión de los objetivos del cliente y el análisis de las tendencias del mercado hasta la formulación de recomendaciones estratégicas. Ha colaborado extensamente con empresas líderes en TIC, ayudándolas a identificar oportunidades de mercado y a adaptarse a los cambios del sector.
Nivedita posee un MBA en Administración de Empresas por IMS, Dehradun. Antes de unirse a The Insight Partners, adquirió una valiosa experiencia en MarketsandMarkets y Future Market Insights en Pune, donde ocupó diversos puestos de investigación y desarrolló una sólida base en análisis del sector y la interacción con el cliente.
- Análisis histórico (2 años), año base, pronóstico (7 años) con CAGR
- Análisis PEST y FODA
- Tamaño del mercado, valor/volumen: global, regional y nacional
- Industria y panorama competitivo
- Conjunto de datos de Excel
Testimonios
El informe de mercado de sistemas SCADA de Insight Partners es completo y ofrece información valiosa sobre las tendencias actuales y las previsiones futuras. El equipo fue altamente profesional, receptivo y me brindó un gran apoyo en todo momento. Estamos muy satisfechos y recomendamos ampliamente sus servicios.
RAN KEDEM Socio, Reali Technologies LTDsSolicité un informe sobre un mercado de software muy específico y el equipo lo elaboró en pocos días. La información era muy relevante y estaba bien presentada. Posteriormente, solicité algunos cambios y adiciones al informe. El equipo fue muy receptivo y recibí el informe final en menos de una semana.
JEAN-HERVE JENN Presidente, Future AnalyticaTrabajamos con The Insight Partners para un importante estudio y pronóstico de mercado. Nos brindaron una visión clara de las oportunidades y los riesgos, lo que nos ayudó a definir nuestros planes. Su investigación fue fácil de usar y se basó en datos sólidos. Nos ayudó a tomar decisiones inteligentes y seguras. Los recomendamos ampliamente.
PIYUSH NAGPAL Vicepresidente Sénior, , High Beam GlobalThe Insight Partners realizó una investigación de mercado profunda y bien estructurada con una sólida experiencia en el sector. Su equipo fue profesional y receptivo en todo momento. El sitio web, fácil de usar, facilitó el acceso a los informes del sector. Los recomendamos ampliamente por sus servicios de investigación confiables y de alta calidad.
YUKIHIKO ADACHI Director Ejecutivo, , Deep Blue, LLCEsta es la primera vez que compro un informe de mercado de The Insight Partners. Aunque al principio tenía dudas, visité su sitio web y me sentí más cómodo al arriesgarme y comprarlo. Estoy completamente satisfecho con la calidad del informe y el servicio al cliente. Tenía varias preguntas y comentarios sobre el informe inicial, pero después de un par de conversaciones por correo electrónico con su analista, creo que tengo un informe que puedo usar como base para nuestro proceso de planificación estratégica. Muchas gracias por tomarse el tiempo y hacer de esta una experiencia positiva. Sin duda, recomendaré sus servicios y serán mi primera opción cuando necesitemos más datos de mercado.
JOHN SUZUKI Presidente y Director Ejecutivo, Director de la Junta Directiva, BK TechnologiesAgradezco su apoyo y la profesionalidad que demostraron al atender mi solicitud de información sobre el mercado de diagnóstico in vitro (IVD) para enfermedades infecciosas en Nigeria. Agradezco su paciencia, su orientación y su disposición a ofrecerme un descuento, lo que finalmente nos permitió cerrar un trato. Espero poder colaborar con The Insight Partners en el futuro, gracias a la impresión que me causó este primer encuentro.
DRA. CHIJIOKE ONYIA, DIRECTORA GENERAL, PineCrest Healthcare Ltd.Razón para comprar
- Toma de decisiones informada
- Comprensión de la dinámica del mercado
- Análisis competitivo
- Información sobre clientes
- Pronósticos del mercado
- Mitigación de riesgos
- Planificación estratégica
- Justificación de la inversión
- Identificación de mercados emergentes
- Mejora de las estrategias de marketing
- Impulso de la eficiencia operativa
- Alineación con las tendencias regulatorias


Desbloquea descuentos exclusivos en informes
Consultar ahora


 Obtenga una muestra gratuita para - Mercado de surtidores de combustible en África