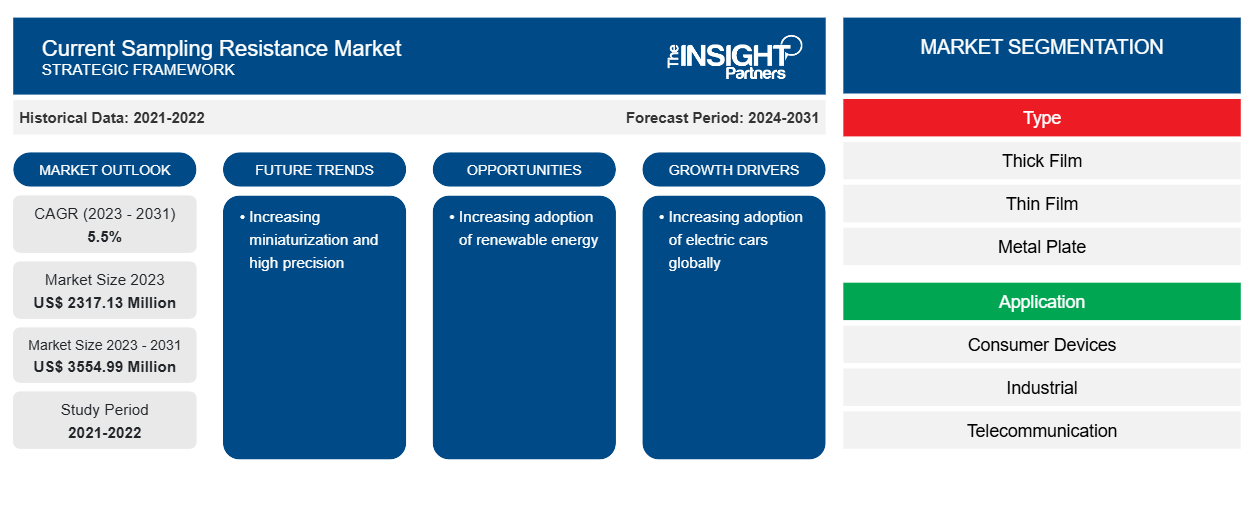
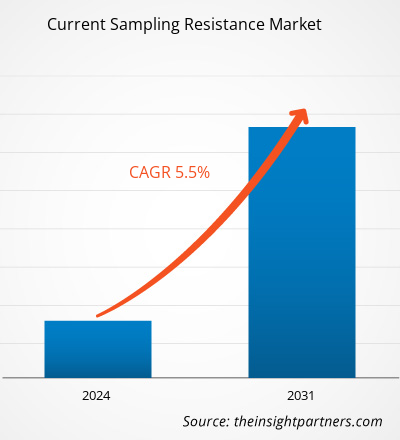
Se proyecta que el tamaño actual del mercado de resistencia al muestreo alcance los 3554,99 millones de dólares estadounidenses para 2031, frente a los 2317,13 millones de dólares estadounidenses en 2023. Se espera que el mercado registre una CAGR del 5,5 % durante 2023-2031. Es probable que la creciente miniaturización y la alta precisión sigan siendo una tendencia clave en el mercado.CAGR of 5.5% during 2023–2031. Increasing miniaturization and high precision are likely to remain a key trend in the market.
Análisis actual del mercado de resistencia al muestreo
Se espera que el uso de resistencias de montaje de alta densidad en varias aplicaciones aumente la velocidad a medida que la práctica de un mayor rendimiento en un área más pequeña se ha vuelto cada vez más esencial. Las resistencias de tamaños de 01005 pulgadas (0,0160,08 pulgadas) se están utilizando en teléfonos inteligentes y dispositivos portátiles. El montaje sin filetes, que proporciona un montaje de paso fino , y el montaje en almohadilla, en el que se crean orificios en la almohadilla del componente para eliminar patrones en la capa superficial, han mejorado la densidad de montaje en varias aplicaciones. Por lo tanto, las empresas están creando resistencias montadas de alta densidad para satisfacer la necesidad.Filletless mounting, which provides fine-pitch
Descripción general del mercado actual de resistencia al muestreo
La resistencia de muestreo de corriente de un material es la obstrucción que causa el flujo de corriente o carga a través del material. Cuanto mayor sea la resistencia, menor será la cantidad de corriente que pasa a través de él. Es la propiedad de un material que nos informa sobre el flujo de la corriente a través del material. Las sustancias que conducen fácilmente la corriente eléctrica se denominan conductores y tienen una resistencia eléctrica muy baja; por el contrario, las sustancias que no conducen fácilmente la corriente eléctrica se denominan aislantes y tienen una resistencia muy alta.
Personalice este informe según sus necesidades
Obtendrá personalización en cualquier informe, sin cargo, incluidas partes de este informe o análisis a nivel de país, paquete de datos de Excel, así como también grandes ofertas y descuentos para empresas emergentes y universidades.
- Obtenga las principales tendencias clave del mercado de este informe.Esta muestra GRATUITA incluirá análisis de datos, desde tendencias del mercado hasta estimaciones y pronósticos.
Factores impulsores y oportunidades del mercado de resistencia al muestreo actual
Creciente adopción de coches eléctricos a nivel mundial
Con la creciente adopción de coches eléctricos, el mercado está creciendo a medida que varios actores lanzan coches eléctricos. Por ejemplo, la resistencia eléctrica es la obstrucción que ofrece el material en el flujo de la corriente o carga a través del material. Además, el ensamblaje de vehículos eléctricos de EE. UU. asciende a ~2,3 millones de vehículos eléctricos, en comparación con los 18 millones fuera de EE. UU. Según el mismo informe, los vehículos eléctricos representarán ~10% de la producción mundial de vehículos eléctricos ligeros en 2025. Por lo tanto, la creciente adopción de coches eléctricos a nivel mundial está impulsando el mercado actual de resistencia de muestreo.
Aumento de la adopción de energías renovables
Se prevé que el aumento de las inversiones en redes inteligentes y energías renovables genere varias oportunidades para el mercado de los cuadros eléctricos. En el funcionamiento de redes inteligentes, se prefiere el funcionamiento automatizado de los cuadros eléctricos al funcionamiento convencional. Una subestación automatizada, en la que todas las operaciones están automatizadas, es más eficiente y requiere menos mano de obra. Además, los gobiernos de varias economías están invirtiendo en la tecnología de redes inteligentes. Por ejemplo, en 2022, Japón anunció un programa de financiación de 155.000 millones de dólares para estimular la inversión en redes inteligentes. Ese mismo año, en la India, el gobierno estableció un plan de 38.000 millones de dólares para ayudar a las empresas de distribución de energía y mejorar la infraestructura de distribución. Por tanto, la creciente adopción de energías renovables está creando más oportunidades para el mercado.switchgear market. In smart grid operation, automated switchgear operation is preferred over conventional operation. An automated substation, wherein all operations are automated, is more efficient and requires less manpower. Further, governments of various economies are investing in the smart grid technology. For instance, in 2022, Japan announced a financing program of US$155 billion to spur investment in smart grids. That same year, in India, the government established a US$38-billion scheme to help power distribution companies and improve distribution infrastructure. Thus, the increasing adoption of
Análisis de segmentación del informe de mercado de resistencia al muestreo actual
Los segmentos clave que contribuyeron a la derivación del análisis actual del mercado de resistencia al muestreo son el tipo y la aplicación.
- Según el tipo, el mercado actual de resistencias de muestreo se divide en película gruesa, película delgada y placa de metal. El segmento personalizado tuvo una mayor participación de mercado en 2023.
- Por tipo de instalación, el mercado se segmenta en montaje en superficie, montaje colgante y montaje empotrado/en pared lateral. El segmento de montaje en superficie tuvo una mayor participación de mercado en 2023.
- Por tipo, el mercado está segmentado en iluminación LED, iluminación incandescente, iluminación fluorescente y otros.
- Por aplicación, el mercado está segmentado en dispositivos de consumo, industriales, de telecomunicaciones, automotrices y otras aplicaciones.
Análisis de la cuota de mercado de resistencia al muestreo actual por geografía
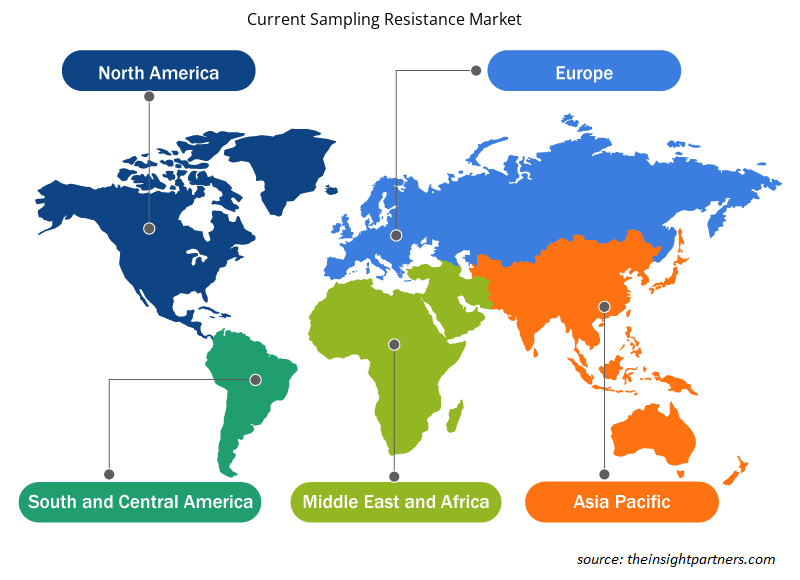
El alcance geográfico del informe actual del mercado de resistencia al muestreo se divide principalmente en cinco regiones: América del Norte, Asia Pacífico, Europa, Medio Oriente y África, y América del Sur y Central.
APAC domina el mercado actual de resistencias de muestreo. El mercado actual de resistencias de muestreo en esta región está creciendo debido a varios factores, como el aumento de las iniciativas gubernamentales para mejorar el estado de los automóviles eléctricos y la presencia de actores bien establecidos. Varios fabricantes ofrecen resistencias de chip de placa metálica de baja resistencia con inductancia parásita extremadamente baja y detección de corriente de alta precisión. Además, la reducción de resistencias se está acercando a su límite y es probable que la modularización se expanda a todo tipo de equipos en el futuro. dominates the current sampling resistance market. The current sampling resistance market in this region is growing due to various factors, such as increasing government initiatives to improve the condition of electric cars and the presence of well-established players. Metal plate chip low resistance resistors with extremely low parasitic inductance and high accuracy current sensing are available from various manufacturers. Furthermore, resistor reduction is nearing its limit, and modularization is likely to expand across all kinds of equipment in the future.
Perspectivas regionales del mercado de resistencia al muestreo actual
Los analistas de Insight Partners explicaron en detalle las tendencias y los factores regionales que influyen en el mercado de resistencia al muestreo actual durante el período de pronóstico. Esta sección también analiza los segmentos y la geografía del mercado de resistencia al muestreo actual en América del Norte, Europa, Asia Pacífico, Oriente Medio y África, y América del Sur y Central.

- Obtenga los datos específicos regionales para el mercado actual de resistencia al muestreo
Alcance del informe de mercado de resistencia al muestreo actual
| Atributo del informe | Detalles |
|---|---|
| Tamaño del mercado en 2023 | US$ 2317,13 millones |
| Tamaño del mercado en 2031 | US$ 3554,99 millones |
| CAGR global (2023 - 2031) | 5,5% |
| Datos históricos | 2021-2022 |
| Período de pronóstico | 2024-2031 |
| Segmentos cubiertos | Por tipo
|
| Regiones y países cubiertos | América del norte
|
| Líderes del mercado y perfiles de empresas clave |
|
Densidad de actores del mercado de resistencia al muestreo actual: comprensión de su impacto en la dinámica empresarial
El mercado actual de resistencia al muestreo está creciendo rápidamente, impulsado por la creciente demanda de los usuarios finales debido a factores como la evolución de las preferencias de los consumidores, los avances tecnológicos y una mayor conciencia de los beneficios del producto. A medida que aumenta la demanda, las empresas amplían sus ofertas, innovan para satisfacer las necesidades de los consumidores y aprovechan las tendencias emergentes, lo que impulsa aún más el crecimiento del mercado.
La densidad de actores del mercado se refiere a la distribución de las empresas o firmas que operan dentro de un mercado o industria en particular. Indica cuántos competidores (actores del mercado) están presentes en un espacio de mercado determinado en relación con su tamaño o valor total de mercado.
Las principales empresas que operan en el mercado de resistencia al muestreo actual son:
- Compañía Cyntec, Ltd.
- Electrónica KOA Speer, Inc.
- Corporación Panasonic
- Compañía Rohm, Ltd.
- Samsung Electro-Mecánica Co., Ltd.
- Compañía Susumu, Ltd.
Descargo de responsabilidad : Las empresas enumeradas anteriormente no están clasificadas en ningún orden particular.

- Obtenga una descripción general de los principales actores clave del mercado de resistencia al muestreo actual
Noticias actuales del mercado de resistencia al muestreo y desarrollos recientes
El mercado actual de resistencia al muestreo se evalúa mediante la recopilación de datos cualitativos y cuantitativos posteriores a la investigación primaria y secundaria, que incluye publicaciones corporativas importantes, datos de asociaciones y bases de datos. A continuación, se enumeran algunos de los desarrollos en el mercado actual de resistencia al muestreo:
- TT Electronics, un fabricante global de componentes electrónicos para aplicaciones de rendimiento crítico, presentó sus resistencias de chip de lámina metálica (MFC). La serie MFC utiliza tecnología de lámina metálica sobre cerámica, que aprovecha las propiedades de propagación del calor de un sustrato cerámico con la tolerancia a las sobretensiones de un elemento de resistencia de aleación de metal a granel. (Fuente: TT Electronics, comunicado de prensa, noviembre de 2020)
- ROHM anunció la disponibilidad de resistencias shunt de la serie GMR50, que proporcionan una potencia nominal líder en la industria de 4 W (a una temperatura de electrodo TK = 90 °C) en un encapsulado compacto de 5,0 mm y 2,5 mm (tipo 2010). Son adecuadas para la detección de corriente en motores y circuitos de suministro de energía empleados en sistemas automotrices y equipos industriales. (Fuente: ROHM, comunicado de prensa, febrero de 2020)
Informe actual sobre el mercado de resistencia al muestreo: cobertura y resultados
El informe “Tamaño actual del mercado de resistencia al muestreo y pronóstico (2021-2031)” proporciona un análisis detallado del mercado que cubre las siguientes áreas:
- Tamaño actual del mercado de resistencia al muestreo y pronóstico a nivel global, regional y nacional para todos los segmentos clave del mercado cubiertos bajo el alcance
- Tendencias actuales del mercado de resistencia al muestreo, así como dinámicas del mercado, como impulsores, restricciones y oportunidades clave
- Análisis detallado de las cinco fuerzas de Porter y PEST y FODA
- Análisis actual del mercado de resistencia al muestreo que cubre las tendencias clave del mercado, el marco global y regional, los principales actores, las regulaciones y los desarrollos recientes del mercado.
- Análisis del panorama de la industria y de la competencia que abarca la concentración del mercado, el análisis de mapas de calor, los actores destacados y los desarrollos recientes del mercado actual de resistencia al muestreo
- Perfiles detallados de empresas
- Análisis histórico (2 años), año base, pronóstico (7 años) con CAGR
- Análisis PEST y FODA
- Tamaño del mercado Valor/volumen: global, regional, nacional
- Industria y panorama competitivo
- Conjunto de datos de Excel


Report Coverage
Revenue forecast, Company Analysis, Industry landscape, Growth factors, and Trends

Segment Covered
This text is related
to segments covered.

Regional Scope
North America, Europe, Asia Pacific, Middle East & Africa, South & Central America

Country Scope
This text is related
to country scope.
Preguntas frecuentes
The expected CAGR of the global current sampling resistance market is 5.5%.
The global current sampling resistance market is expected to reach US$ 3554.99 million by 2031.
Increasing miniaturization and high precision are anticipated to play a significant role in the global current sampling resistance market in the coming years.
The key players holding majority shares in the global current sampling resistance market are Cyntec Co., Ltd, KOA Speer Electronics, Inc., Panasonic Corporation, ROHM CO., LTD, Samsung Electro-Mechanics Co, Ltd., Susumu Co., Ltd., TT Electronics, Viking Tech Corporation, Vishay Intertechnology, Inc., and Walter Electronic Co.Ltd.
The increasing adoption of electric cars globally and the increasing adoption of renewable energy are the major factors that propel the global current sampling resistance market.
APAC dominates the current sampling resistance market.
Trends and growth analysis reports related to Electronics and Semiconductor : READ MORE..
The Insight Partners performs research in 4 major stages: Data Collection & Secondary Research, Primary Research, Data Analysis and Data Triangulation & Final Review.
- Data Collection and Secondary Research:
As a market research and consulting firm operating from a decade, we have published and advised several client across the globe. First step for any study will start with an assessment of currently available data and insights from existing reports. Further, historical and current market information is collected from Investor Presentations, Annual Reports, SEC Filings, etc., and other information related to company’s performance and market positioning are gathered from Paid Databases (Factiva, Hoovers, and Reuters) and various other publications available in public domain.
Several associations trade associates, technical forums, institutes, societies and organization are accessed to gain technical as well as market related insights through their publications such as research papers, blogs and press releases related to the studies are referred to get cues about the market. Further, white papers, journals, magazines, and other news articles published in last 3 years are scrutinized and analyzed to understand the current market trends.
- Primary Research:
The primarily interview analysis comprise of data obtained from industry participants interview and answers to survey questions gathered by in-house primary team.
For primary research, interviews are conducted with industry experts/CEOs/Marketing Managers/VPs/Subject Matter Experts from both demand and supply side to get a 360-degree view of the market. The primary team conducts several interviews based on the complexity of the markets to understand the various market trends and dynamics which makes research more credible and precise.
A typical research interview fulfils the following functions:
- Provides first-hand information on the market size, market trends, growth trends, competitive landscape, and outlook
- Validates and strengthens in-house secondary research findings
- Develops the analysis team’s expertise and market understanding
Primary research involves email interactions and telephone interviews for each market, category, segment, and sub-segment across geographies. The participants who typically take part in such a process include, but are not limited to:
- Industry participants: VPs, business development managers, market intelligence managers and national sales managers
- Outside experts: Valuation experts, research analysts and key opinion leaders specializing in the electronics and semiconductor industry.
Below is the breakup of our primary respondents by company, designation, and region:

Once we receive the confirmation from primary research sources or primary respondents, we finalize the base year market estimation and forecast the data as per the macroeconomic and microeconomic factors assessed during data collection.
- Data Analysis:
Once data is validated through both secondary as well as primary respondents, we finalize the market estimations by hypothesis formulation and factor analysis at regional and country level.
- Macro-Economic Factor Analysis:
We analyse macroeconomic indicators such the gross domestic product (GDP), increase in the demand for goods and services across industries, technological advancement, regional economic growth, governmental policies, the influence of COVID-19, PEST analysis, and other aspects. This analysis aids in setting benchmarks for various nations/regions and approximating market splits. Additionally, the general trend of the aforementioned components aid in determining the market's development possibilities.
- Country Level Data:
Various factors that are especially aligned to the country are taken into account to determine the market size for a certain area and country, including the presence of vendors, such as headquarters and offices, the country's GDP, demand patterns, and industry growth. To comprehend the market dynamics for the nation, a number of growth variables, inhibitors, application areas, and current market trends are researched. The aforementioned elements aid in determining the country's overall market's growth potential.
- Company Profile:
The “Table of Contents” is formulated by listing and analyzing more than 25 - 30 companies operating in the market ecosystem across geographies. However, we profile only 10 companies as a standard practice in our syndicate reports. These 10 companies comprise leading, emerging, and regional players. Nonetheless, our analysis is not restricted to the 10 listed companies, we also analyze other companies present in the market to develop a holistic view and understand the prevailing trends. The “Company Profiles” section in the report covers key facts, business description, products & services, financial information, SWOT analysis, and key developments. The financial information presented is extracted from the annual reports and official documents of the publicly listed companies. Upon collecting the information for the sections of respective companies, we verify them via various primary sources and then compile the data in respective company profiles. The company level information helps us in deriving the base number as well as in forecasting the market size.
- Developing Base Number:
Aggregation of sales statistics (2020-2022) and macro-economic factor, and other secondary and primary research insights are utilized to arrive at base number and related market shares for 2022. The data gaps are identified in this step and relevant market data is analyzed, collected from paid primary interviews or databases. On finalizing the base year market size, forecasts are developed on the basis of macro-economic, industry and market growth factors and company level analysis.
- Data Triangulation and Final Review:
The market findings and base year market size calculations are validated from supply as well as demand side. Demand side validations are based on macro-economic factor analysis and benchmarks for respective regions and countries. In case of supply side validations, revenues of major companies are estimated (in case not available) based on industry benchmark, approximate number of employees, product portfolio, and primary interviews revenues are gathered. Further revenue from target product/service segment is assessed to avoid overshooting of market statistics. In case of heavy deviations between supply and demand side values, all thes steps are repeated to achieve synchronization.
We follow an iterative model, wherein we share our research findings with Subject Matter Experts (SME’s) and Key Opinion Leaders (KOLs) until consensus view of the market is not formulated – this model negates any drastic deviation in the opinions of experts. Only validated and universally acceptable research findings are quoted in our reports.
We have important check points that we use to validate our research findings – which we call – data triangulation, where we validate the information, we generate from secondary sources with primary interviews and then we re-validate with our internal data bases and Subject matter experts. This comprehensive model enables us to deliver high quality, reliable data in shortest possible time.


 Obtenga una muestra gratuita de este informe