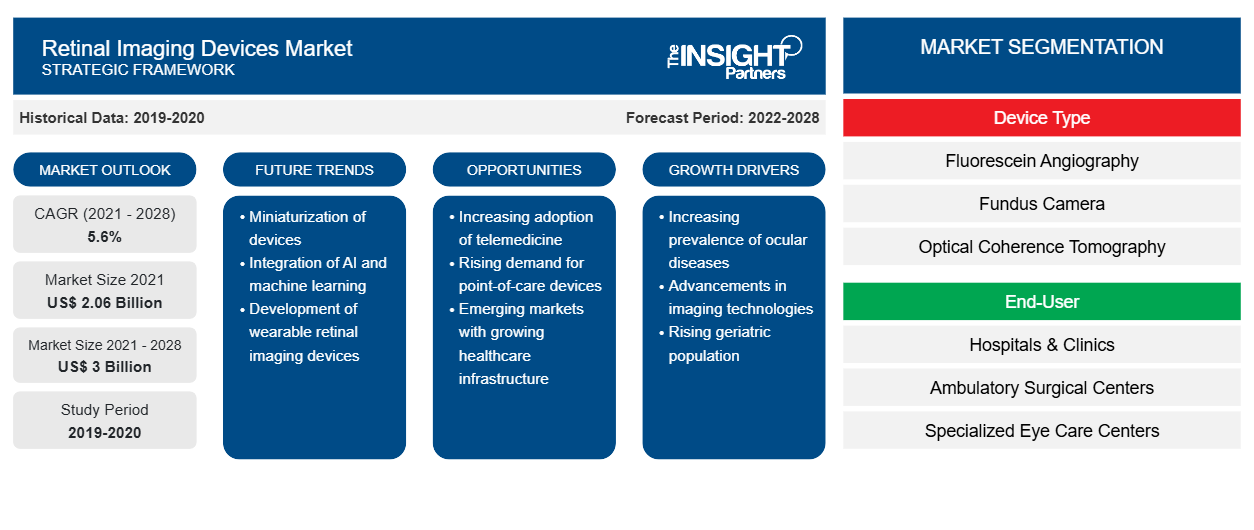
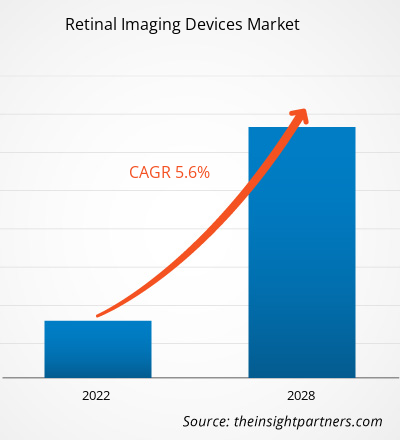
Se proyecta que el mercado de dispositivos de imágenes de retina alcance los 3.000 millones de dólares en 2028, desde los 2.060 millones de dólares en 2021; se estima que crecerá a una CAGR del 5,6 % durante 2021-2028.
La obtención de imágenes de retina es una técnica que se utiliza para analizar y diagnosticar el estado de la retina de un paciente. Los dispositivos de obtención de imágenes de retina (RID) utilizan sistemas de imágenes de alta resolución para capturar imágenes del interior de un ojo. La imagen capturada ayuda a los médicos de la red privada virtual (VSP) a evaluar la salud de la retina, lo que ayuda a detectar y tratar afecciones oculares y de salud como la diabetes, el glaucoma y la degeneración macular, entre otras.
Personalice este informe según sus necesidades
Obtendrá personalización en cualquier informe, sin cargo, incluidas partes de este informe o análisis a nivel de país, paquete de datos de Excel, así como también grandes ofertas y descuentos para empresas emergentes y universidades.
- Obtenga las principales tendencias clave del mercado de este informe.Esta muestra GRATUITA incluirá análisis de datos, desde tendencias del mercado hasta estimaciones y pronósticos.
El crecimiento del mercado de dispositivos de diagnóstico por imagen de la retina se atribuye al mejor acceso de los oftalmólogos a la retina, a las crecientes iniciativas globales para la ceguera y a los avances tecnológicos. Sin embargo, el alto costo de los dispositivos OCT obstaculiza el crecimiento del mercado.
Perspectivas de mercado
Aumento de la prevalencia de enfermedades oculares
Los dispositivos de imágenes de retina se utilizan ampliamente para diagnosticar y tratar diversas enfermedades relacionadas con los ojos, como la retinopatía diabética , la degeneración macular relacionada con la edad, el glaucoma, el melanoma ocular y los problemas de visión leves. Además, en todo el mundo, la preocupación por la ceguera o el deterioro de la visión está creciendo significativamente. Según los datos publicados por la Organización Mundial de la Salud (OMS) en octubre de 2021, casi 2.200 millones de personas viven con una discapacidad visual o ceguera. De los cuales, aproximadamente mil millones de casos de discapacidad visual se pueden prevenir con un diagnóstico y tratamiento adecuados. Estos mil millones de personas tienen diferentes problemas oculares relacionados con la discapacidad visual moderada o grave o la ceguera. Las tecnologías de diagnóstico relacionadas con la imagen han comenzado a ofrecer un crecimiento sin precedentes en las enfermedades oculares basadas en conjuntos de datos morfológicos. Se espera que este factor ayude al mercado de dispositivos de imágenes de retina durante el período de pronóstico.
Información basada en el tipo de dispositivo
Según el tipo de dispositivo, el mercado mundial de dispositivos de imágenes de retina se ha segmentado en angiografía con fluoresceína, cámara de fondo de ojo y tomografía de coherencia óptica. El segmento de la cámara de fondo de ojo tuvo la mayor participación del mercado en 2021. La fotografía del fondo de ojo se ha transformado de flashes electrónicos a cámaras basadas en teléfonos inteligentes a un kit de examen ocular portátil (PEEK) más reciente. PEEK es una aplicación basada en teléfonos inteligentes para un examen ocular completo. La ventaja de estas cámaras es que un no oftalmólogo puede tomar fotografías y, con algo de capacitación, también calificarlas. Sin embargo, se anticipa que el segmento de tomografía de coherencia óptica registre la CAGR más alta del 8,1% en el mercado durante el período de pronóstico. La tomografía de coherencia óptica permite la evaluación de diferentes niveles de isquemia macular que no se diagnostican en imágenes primarias. La técnica se utiliza como estándar para las modalidades de imágenes para los ojos.
Información basada en el usuario final
Según el usuario final, el mercado global de dispositivos de imágenes de retina está segmentado en hospitales y clínicas, clínicas especializadas, centros de atención ambulatoria y otros. El segmento de hospitales y clínicas tuvo la mayor participación del mercado en 2021 y se espera que los centros de atención oftalmológica especializados registren la CAGR más alta del mercado del 6,6 % durante el período de pronóstico.
Perspectivas regionales del mercado de dispositivos de imágenes de retina
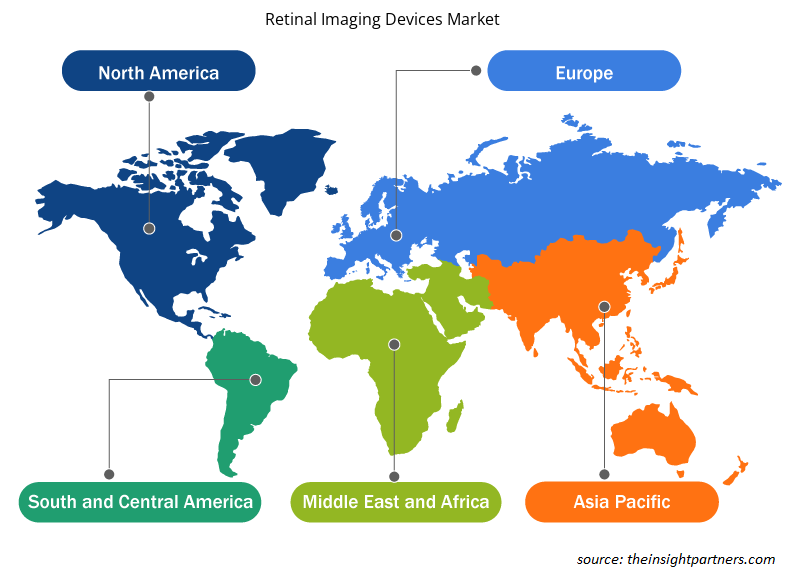
Los analistas de Insight Partners explicaron en detalle las tendencias y los factores regionales que influyen en el mercado de dispositivos de diagnóstico por imágenes de retina durante el período de pronóstico. Esta sección también analiza los segmentos y la geografía del mercado de dispositivos de diagnóstico por imágenes de retina en América del Norte, Europa, Asia Pacífico, Oriente Medio y África, y América del Sur y Central.

- Obtenga datos regionales específicos para el mercado de dispositivos de imágenes de retina
Alcance del informe de mercado de dispositivos de imágenes de retina
| Atributo del informe | Detalles |
|---|---|
| Tamaño del mercado en 2021 | US$ 2.06 mil millones |
| Tamaño del mercado en 2028 | 3 mil millones de dólares estadounidenses |
| CAGR global (2021-2028) | 5,6% |
| Datos históricos | 2019-2020 |
| Período de pronóstico | 2022-2028 |
| Segmentos cubiertos | Por tipo de dispositivo
|
| Regiones y países cubiertos | América del norte
|
| Líderes del mercado y perfiles de empresas clave |
|
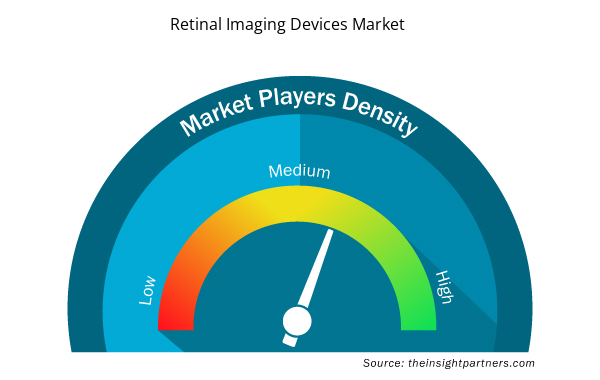
Densidad de actores del mercado de dispositivos de imágenes de retina: comprensión de su impacto en la dinámica empresarial
El mercado de dispositivos de diagnóstico por imágenes de retina está creciendo rápidamente, impulsado por la creciente demanda de los usuarios finales debido a factores como la evolución de las preferencias de los consumidores, los avances tecnológicos y una mayor conciencia de los beneficios del producto. A medida que aumenta la demanda, las empresas amplían sus ofertas, innovan para satisfacer las necesidades de los consumidores y aprovechan las tendencias emergentes, lo que impulsa aún más el crecimiento del mercado.
La densidad de actores del mercado se refiere a la distribución de las empresas o firmas que operan dentro de un mercado o industria en particular. Indica cuántos competidores (actores del mercado) están presentes en un espacio de mercado determinado en relación con su tamaño o valor total de mercado.
Las principales empresas que operan en el mercado de dispositivos de imágenes de retina son:
- Carl Zeiss Meditec
- Grupo Revenio Oyj
- Corporación Nikon
- Optomizado
- Corporación Topcon
Descargo de responsabilidad : Las empresas enumeradas anteriormente no están clasificadas en ningún orden particular.

- Obtenga una descripción general de los principales actores clave del mercado de dispositivos de imágenes de retina
Perspectivas regionales
Según las regiones, la región de América del Norte representó la mayor participación en 2021 y se espera que siga una tendencia similar durante el período de pronóstico. Se espera que la región de Asia Pacífico sea testigo de la tasa de crecimiento más alta durante el período de pronóstico. Se espera que la aplicación de inteligencia artificial (IA) y el sistema de aprendizaje profundo (DLS) para mejorar la cobertura de detección en Singapur ayude al crecimiento regional durante los próximos siete años.
Los lanzamientos y las aprobaciones de productos son estrategias que las empresas suelen adoptar para ampliar su presencia global y sus carteras de productos. Además, los actores del mercado de dispositivos de imágenes de retina se centran en la estrategia de asociación para ampliar su clientela, lo que, a su vez, les permite mantener su marca en todo el mundo.
Según el tipo de dispositivo, el mercado de dispositivos de imágenes de retina se clasifica en angiografía con fluoresceína, cámara de fondo de ojo y tomografía de coherencia óptica. Según el usuario final, el mercado se segmenta en hospitales y clínicas, centros de cirugía ambulatoria, centros de atención oftalmológica especializados y otros usuarios finales. Por geografía, el mercado de dispositivos de imágenes de retina está segmentado en América del Norte (EE. UU., Canadá y México), Europa (Reino Unido, Alemania, Francia, Italia, España y el resto de Europa), Asia Pacífico (China, Japón, India, Australia, Corea del Sur y el resto de Asia Pacífico), Medio Oriente y África (EAU, Arabia Saudita, Sudáfrica y el resto de Medio Oriente y África) y América del Sur y Central (Brasil, Argentina y el resto de América del Sur y Central). Algunos de los perfiles de empresas enumerados en nuestro alcance de investigación son Carl Zeiss Meditec, Revenio Group Oyj, Nikon Corporation, Optomed, Topcon Corporation, Imagine Eyes, Epipole Ltd, Forus Health Pvt Ltd, Eyenuk Inc y Phoenix Technology Group LLC, entre otros.
- Análisis histórico (2 años), año base, pronóstico (7 años) con CAGR
- Análisis PEST y FODA
- Tamaño del mercado Valor/volumen: global, regional, nacional
- Industria y panorama competitivo
- Conjunto de datos de Excel


- Advanced Planning and Scheduling Software Market
- Sexual Wellness Market
- Smart Water Metering Market
- Mice Model Market
- Water Pipeline Leak Detection System Market
- Sports Technology Market
- Extracellular Matrix Market
- Visualization and 3D Rendering Software Market
- Gas Engine Market
- Electronic Data Interchange Market

Report Coverage
Revenue forecast, Company Analysis, Industry landscape, Growth factors, and Trends

Segment Covered
This text is related
to segments covered.

Regional Scope
North America, Europe, Asia Pacific, Middle East & Africa, South & Central America

Country Scope
This text is related
to country scope.
Preguntas frecuentes
The global retinal imaging devices market is expected to reach US$ 3,009.55 million by 2028 from US$ 2,060.01 million in 2021; it is estimated to grow at a CAGR of 5.6% during 2021–2028.
The retinal imaging devices market majorly consists of players such as Carl Zeiss Meditec, Revenio Group Oyj, Nikon Corporation, Optomed, Topcon Corporation, Imagine Eyes, Epipole Ltd, Forus Health Pvt Ltd, Eyenuk Inc, and Phoenix Technology Group LLC among others.
The fundus camera type held the largest share of the market in 2021. However, the optical coherence tomography type is anticipated to register the highest CAGR of 8.1% in the market during the forecast period. The optical coherence tomography allows the evaluation of different levels of macular ischemia that are not diagnosed in primary imaging. The technique is used as a standard for imaging modalities for eyes.
The Asia Pacific registered as the fastest-growing region in the global retinal imaging devices market. The market in this region is expected to grow significantly in countries such as China, Japan, and India. The market is driven by the rising prevalence of eye diseases and related factors. In China, eye diseases such as uncorrected sight problems, limited access to ophthalmologists in rural parts are driving the market growth. Whereas in Japan, the cost of eye health is rising significantly, and in India, the prevalence of diabetic retinopathy is growing exponentially. Also, factors such as the rising geriatric population in South Korea and global initiatives such as Vision 2020 in Australia are likely to support the growth of the market during the forecast period
The growth of the market is attributed to the rising prevalence of eye diseases, growing global initiatives for blindness and technological advancement in ophthalmology drives the market growth. However, the high cost of OCT devices hampers the market growth.
Trends and growth analysis reports related to Life Sciences : READ MORE..
The List of Companies - Retinal Imaging Device Market
- Carl Zeiss Meditec
- Revenio Group Oyj
- Nikon Corporation
- Optomed
- Topcon Corporation
- Imagine Eyes
- Epipole Ltd
- Forus Health Pvt Ltd
- Eyenuk Inc
- Phoenix Technology Group LLC
The Insight Partners performs research in 4 major stages: Data Collection & Secondary Research, Primary Research, Data Analysis and Data Triangulation & Final Review.
- Data Collection and Secondary Research:
As a market research and consulting firm operating from a decade, we have published and advised several client across the globe. First step for any study will start with an assessment of currently available data and insights from existing reports. Further, historical and current market information is collected from Investor Presentations, Annual Reports, SEC Filings, etc., and other information related to company’s performance and market positioning are gathered from Paid Databases (Factiva, Hoovers, and Reuters) and various other publications available in public domain.
Several associations trade associates, technical forums, institutes, societies and organization are accessed to gain technical as well as market related insights through their publications such as research papers, blogs and press releases related to the studies are referred to get cues about the market. Further, white papers, journals, magazines, and other news articles published in last 3 years are scrutinized and analyzed to understand the current market trends.
- Primary Research:
The primarily interview analysis comprise of data obtained from industry participants interview and answers to survey questions gathered by in-house primary team.
For primary research, interviews are conducted with industry experts/CEOs/Marketing Managers/VPs/Subject Matter Experts from both demand and supply side to get a 360-degree view of the market. The primary team conducts several interviews based on the complexity of the markets to understand the various market trends and dynamics which makes research more credible and precise.
A typical research interview fulfils the following functions:
- Provides first-hand information on the market size, market trends, growth trends, competitive landscape, and outlook
- Validates and strengthens in-house secondary research findings
- Develops the analysis team’s expertise and market understanding
Primary research involves email interactions and telephone interviews for each market, category, segment, and sub-segment across geographies. The participants who typically take part in such a process include, but are not limited to:
- Industry participants: VPs, business development managers, market intelligence managers and national sales managers
- Outside experts: Valuation experts, research analysts and key opinion leaders specializing in the electronics and semiconductor industry.
Below is the breakup of our primary respondents by company, designation, and region:

Once we receive the confirmation from primary research sources or primary respondents, we finalize the base year market estimation and forecast the data as per the macroeconomic and microeconomic factors assessed during data collection.
- Data Analysis:
Once data is validated through both secondary as well as primary respondents, we finalize the market estimations by hypothesis formulation and factor analysis at regional and country level.
- Macro-Economic Factor Analysis:
We analyse macroeconomic indicators such the gross domestic product (GDP), increase in the demand for goods and services across industries, technological advancement, regional economic growth, governmental policies, the influence of COVID-19, PEST analysis, and other aspects. This analysis aids in setting benchmarks for various nations/regions and approximating market splits. Additionally, the general trend of the aforementioned components aid in determining the market's development possibilities.
- Country Level Data:
Various factors that are especially aligned to the country are taken into account to determine the market size for a certain area and country, including the presence of vendors, such as headquarters and offices, the country's GDP, demand patterns, and industry growth. To comprehend the market dynamics for the nation, a number of growth variables, inhibitors, application areas, and current market trends are researched. The aforementioned elements aid in determining the country's overall market's growth potential.
- Company Profile:
The “Table of Contents” is formulated by listing and analyzing more than 25 - 30 companies operating in the market ecosystem across geographies. However, we profile only 10 companies as a standard practice in our syndicate reports. These 10 companies comprise leading, emerging, and regional players. Nonetheless, our analysis is not restricted to the 10 listed companies, we also analyze other companies present in the market to develop a holistic view and understand the prevailing trends. The “Company Profiles” section in the report covers key facts, business description, products & services, financial information, SWOT analysis, and key developments. The financial information presented is extracted from the annual reports and official documents of the publicly listed companies. Upon collecting the information for the sections of respective companies, we verify them via various primary sources and then compile the data in respective company profiles. The company level information helps us in deriving the base number as well as in forecasting the market size.
- Developing Base Number:
Aggregation of sales statistics (2020-2022) and macro-economic factor, and other secondary and primary research insights are utilized to arrive at base number and related market shares for 2022. The data gaps are identified in this step and relevant market data is analyzed, collected from paid primary interviews or databases. On finalizing the base year market size, forecasts are developed on the basis of macro-economic, industry and market growth factors and company level analysis.
- Data Triangulation and Final Review:
The market findings and base year market size calculations are validated from supply as well as demand side. Demand side validations are based on macro-economic factor analysis and benchmarks for respective regions and countries. In case of supply side validations, revenues of major companies are estimated (in case not available) based on industry benchmark, approximate number of employees, product portfolio, and primary interviews revenues are gathered. Further revenue from target product/service segment is assessed to avoid overshooting of market statistics. In case of heavy deviations between supply and demand side values, all thes steps are repeated to achieve synchronization.
We follow an iterative model, wherein we share our research findings with Subject Matter Experts (SME’s) and Key Opinion Leaders (KOLs) until consensus view of the market is not formulated – this model negates any drastic deviation in the opinions of experts. Only validated and universally acceptable research findings are quoted in our reports.
We have important check points that we use to validate our research findings – which we call – data triangulation, where we validate the information, we generate from secondary sources with primary interviews and then we re-validate with our internal data bases and Subject matter experts. This comprehensive model enables us to deliver high quality, reliable data in shortest possible time.


 Obtenga una muestra gratuita de este informe