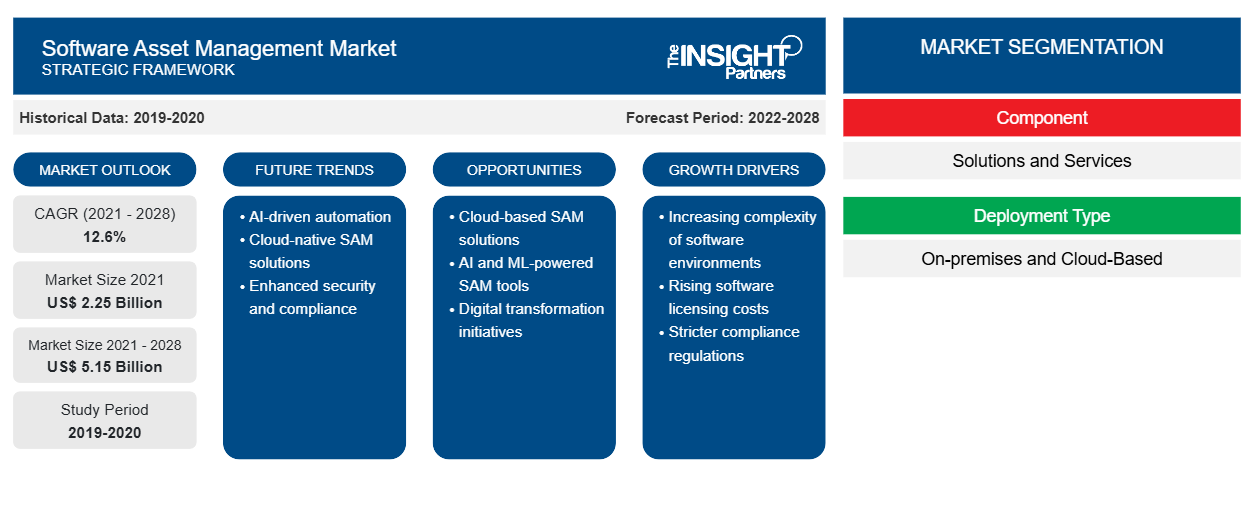
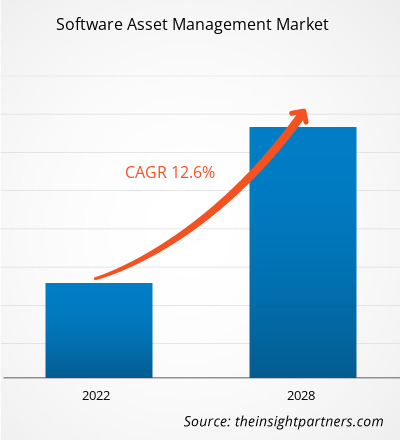
[Informe de investigación] Se espera que el mercado de gestión de activos de software crezca de US$ 2.250,37 millones en 2021 a US$ 5.150,51 millones en 2028; se estima que crecerá a una CAGR del 12,6% entre 2021 y 2028.
La administración de sistemas, reglas y procedimientos que permiten la adquisición, implementación, uso, mantenimiento y eliminación de aplicaciones de software dentro de una organización se conoce como gestión de activos de software (SAM). El mercado de gestión de activos de software es un componente de la gestión de activos de TI que tiene como objetivo garantizar que la empresa cumpla con los acuerdos de licencia y no gaste de más en software. La identificación de los activos de software, la validez de los acuerdos de licencia de usuario final (EULA) y el uso apropiado de software libre son objetivos cruciales de cualquier iniciativa de SAM. La documentación de SAM puede proteger a la empresa de demandas por piratería, minimizar el uso indebido no intencionado de las licencias y proporcionar control sobre el software oculto en la red.
La gestión de activos de software en una gran organización puede ser tan complicada que requiere el desarrollo y mantenimiento de una base de datos que contenga información sobre las compras de software, las suscripciones, las licencias y los parches. Un equipo como este suele estar a cargo de renovar las licencias de software, negociar nuevos acuerdos de licencia y detectar y eliminar software que rara vez se utiliza o que nunca se utiliza. El mercado de gestión de activos de software auditará la cantidad de licencias de software adquiridas y la conciliará con la cantidad de licencias instaladas para automatizar la forma en que se obtiene la información de numerosas fuentes de inventario de dispositivos móviles, computadoras de escritorio, centros de datos y la nube. Las herramientas SAM también pueden realizar un seguimiento de la cantidad de licencias restantes. Para reducir los gastos, este conocimiento se puede utilizar para eliminar o reasignar el software que no se utiliza.
Personalice este informe según sus necesidades
Obtendrá personalización en cualquier informe, sin cargo, incluidas partes de este informe o análisis a nivel de país, paquete de datos de Excel, así como también grandes ofertas y descuentos para empresas emergentes y universidades.
- Obtenga las principales tendencias clave del mercado de este informe.Esta muestra GRATUITA incluirá análisis de datos, desde tendencias del mercado hasta estimaciones y pronósticos.
Perspectivas regionales del mercado de gestión de activos de software
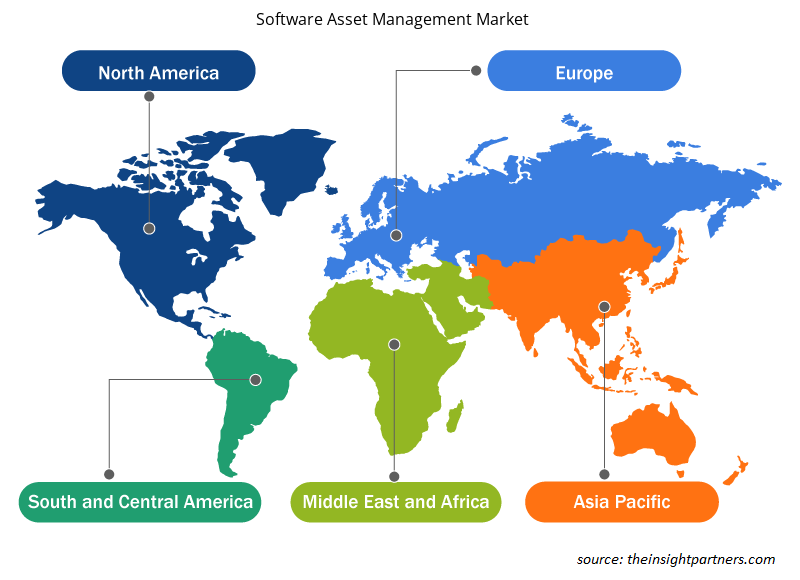
Los analistas de Insight Partners explicaron en detalle las tendencias y los factores regionales que influyen en el mercado de gestión de activos de software durante el período de pronóstico. Esta sección también analiza los segmentos y la geografía del mercado de gestión de activos de software en América del Norte, Europa, Asia Pacífico, Oriente Medio y África, y América del Sur y Central.

- Obtenga datos regionales específicos para el mercado de gestión de activos de software
Alcance del informe de mercado de gestión de activos de software
| Atributo del informe | Detalles |
|---|---|
| Tamaño del mercado en 2021 | 2.250 millones de dólares estadounidenses |
| Tamaño del mercado en 2028 | 5.150 millones de dólares estadounidenses |
| CAGR global (2021-2028)CAGR (2021 - 2028) | 12,6% |
| Datos históricos | 2019-2020 |
| Período de pronóstico | 2022-2028 |
| Segmentos cubiertos | Por componente
|
| Regiones y países cubiertos | América del norte
|
| Líderes del mercado y perfiles de empresas clave |
|
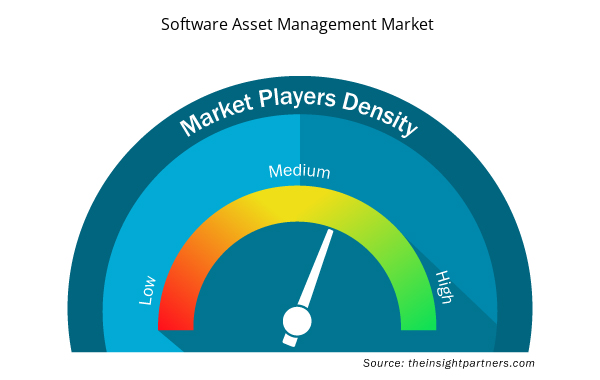
Densidad de actores del mercado de gestión de activos de software: comprensión de su impacto en la dinámica empresarial
El mercado de gestión de activos de software está creciendo rápidamente, impulsado por la creciente demanda de los usuarios finales debido a factores como la evolución de las preferencias de los consumidores, los avances tecnológicos y una mayor conciencia de los beneficios del producto. A medida que aumenta la demanda, las empresas amplían sus ofertas, innovan para satisfacer las necesidades de los consumidores y aprovechan las tendencias emergentes, lo que impulsa aún más el crecimiento del mercado.
La densidad de actores del mercado se refiere a la distribución de las empresas o firmas que operan dentro de un mercado o industria en particular. Indica cuántos competidores (actores del mercado) están presentes en un espacio de mercado determinado en relación con su tamaño o valor total de mercado.
Las principales empresas que operan en el mercado de gestión de activos de software son:
- Corporación Microsoft
- IVANTI
- SOFTWARE DE NIEVE
- Compañía: BMC Software, Inc.
- CERTERO
Descargo de responsabilidad : Las empresas enumeradas anteriormente no están clasificadas en ningún orden particular.

- Obtenga una descripción general de los principales actores clave del mercado de gestión de activos de software
Mercado de gestión de activos de software: perfiles de empresas
- Corporación Microsoft
- IVANTI
- SOFTWARE DE NIEVE
- Compañía: BMC Software, Inc.
- CERTERO
- FLEXIÓN
- Corporación IBM
- MICRO ENFOQUE
- SERVICIO AHORA
- Compañía: Broadcom, Inc.
- Análisis histórico (2 años), año base, pronóstico (7 años) con CAGR
- Análisis PEST y FODA
- Tamaño del mercado Valor/volumen: global, regional, nacional
- Industria y panorama competitivo
- Conjunto de datos de Excel


Report Coverage
Revenue forecast, Company Analysis, Industry landscape, Growth factors, and Trends

Segment Covered
This text is related
to segments covered.

Regional Scope
North America, Europe, Asia Pacific, Middle East & Africa, South & Central America

Country Scope
This text is related
to country scope.
Preguntas frecuentes
The software asset management market based on component type is segmented into solutions, and services. In 2020, the solution segment held the largest software asset management market share.
SAM helps an organization to decrease software costs, increase compliance, and improve processes for employee software requests. The capability of an entity to replace, update, or enhance the overall skills of the enterprise can become critically impaired. Furthermore, support and managing costs for these critical assets necessarily grow to be a significant inconvenience. The need to follow the organization’s policies, control licensing, and assured security for the internal network, is needed for the enterprise to be successful. Software license management tools are driving the market.
In addition to managing software assets, software asset management (SAM) for cloud settings focuses on cost management, software portfolio management, and regulatory challenges. In cloud settings, where services are provided, configured, reconfigured, and released in a matter of minutes, software asset management (SAM) as a process must adapt to the quick speed of change. The various cloud approaches – Infrastructure as a Service (IaaS), Platform as a Service (PaaS), and Software as a Service (SaaS) – have varying effects on software asset management (SAM), and organizations will need to carefully and proactively consider the impact their cloud strategy has on their software asset management (SAM) programs, in general, and specifically on their software licensing. For instance, Cloud Economics is a periodic comprehensive service that gives clients transparency and control over their Cloud deployment while also assisting them with budgeting, contract renewals, infrastructure changes, mergers and acquisitions, standards, rules, and processes.
On the basis of industry vertical, the global software asset management market is segmented as BFSI, IT and Telecom, manufacturing, retail, and consumer goods, government, healthcare and life sciences, education, media and entertainment, others. Manufacturing segment held the largest software asset management market share in 2020.
IoT-enabled software asset monitoring and analytics solutions leverage web, analytics, and wireless to combine all the traditional solutions, processes, assets, and workflows into a single solution to offer a centralized consolidated tracking and monitoring and analytics system. These systems provide anytime, anywhere access and any device connectivity with enormous scalability and effective IT-OT (information technology systems - operational technology systems) integrations. Companies may utilize IoT-based solutions to keep track of all of their assets, recover and maintain them, identify issue areas, stock inventories, build up a replenishment system, properly evaluate risk and compliance, and analyze asset usage and condition. Business entities will now have the time and resources to evaluate the quality, quantity, and placement of assets to enhance work processes, eliminate waste, and avoid unexpected equipment failure to keep a cost-effective system running, which in turn is likely to gain momentum for the software asset management (SAM) market over the forecasted period.
Based on deployment type, the software asset management is categorized into on-premise, and cloud-based. Cloud segment dominate the market. The increasing utilization of cloud-based services and big data tools is acting as a major growth-inducing factor. Software asset management solutions deployed in the cloud provide web-based management and enterprise-wide protection solutions with increased scalability, network security, and speed.
Trends and growth analysis reports related to Technology, Media and Telecommunications : READ MORE..
The Insight Partners performs research in 4 major stages: Data Collection & Secondary Research, Primary Research, Data Analysis and Data Triangulation & Final Review.
- Data Collection and Secondary Research:
As a market research and consulting firm operating from a decade, we have published and advised several client across the globe. First step for any study will start with an assessment of currently available data and insights from existing reports. Further, historical and current market information is collected from Investor Presentations, Annual Reports, SEC Filings, etc., and other information related to company’s performance and market positioning are gathered from Paid Databases (Factiva, Hoovers, and Reuters) and various other publications available in public domain.
Several associations trade associates, technical forums, institutes, societies and organization are accessed to gain technical as well as market related insights through their publications such as research papers, blogs and press releases related to the studies are referred to get cues about the market. Further, white papers, journals, magazines, and other news articles published in last 3 years are scrutinized and analyzed to understand the current market trends.
- Primary Research:
The primarily interview analysis comprise of data obtained from industry participants interview and answers to survey questions gathered by in-house primary team.
For primary research, interviews are conducted with industry experts/CEOs/Marketing Managers/VPs/Subject Matter Experts from both demand and supply side to get a 360-degree view of the market. The primary team conducts several interviews based on the complexity of the markets to understand the various market trends and dynamics which makes research more credible and precise.
A typical research interview fulfils the following functions:
- Provides first-hand information on the market size, market trends, growth trends, competitive landscape, and outlook
- Validates and strengthens in-house secondary research findings
- Develops the analysis team’s expertise and market understanding
Primary research involves email interactions and telephone interviews for each market, category, segment, and sub-segment across geographies. The participants who typically take part in such a process include, but are not limited to:
- Industry participants: VPs, business development managers, market intelligence managers and national sales managers
- Outside experts: Valuation experts, research analysts and key opinion leaders specializing in the electronics and semiconductor industry.
Below is the breakup of our primary respondents by company, designation, and region:

Once we receive the confirmation from primary research sources or primary respondents, we finalize the base year market estimation and forecast the data as per the macroeconomic and microeconomic factors assessed during data collection.
- Data Analysis:
Once data is validated through both secondary as well as primary respondents, we finalize the market estimations by hypothesis formulation and factor analysis at regional and country level.
- Macro-Economic Factor Analysis:
We analyse macroeconomic indicators such the gross domestic product (GDP), increase in the demand for goods and services across industries, technological advancement, regional economic growth, governmental policies, the influence of COVID-19, PEST analysis, and other aspects. This analysis aids in setting benchmarks for various nations/regions and approximating market splits. Additionally, the general trend of the aforementioned components aid in determining the market's development possibilities.
- Country Level Data:
Various factors that are especially aligned to the country are taken into account to determine the market size for a certain area and country, including the presence of vendors, such as headquarters and offices, the country's GDP, demand patterns, and industry growth. To comprehend the market dynamics for the nation, a number of growth variables, inhibitors, application areas, and current market trends are researched. The aforementioned elements aid in determining the country's overall market's growth potential.
- Company Profile:
The “Table of Contents” is formulated by listing and analyzing more than 25 - 30 companies operating in the market ecosystem across geographies. However, we profile only 10 companies as a standard practice in our syndicate reports. These 10 companies comprise leading, emerging, and regional players. Nonetheless, our analysis is not restricted to the 10 listed companies, we also analyze other companies present in the market to develop a holistic view and understand the prevailing trends. The “Company Profiles” section in the report covers key facts, business description, products & services, financial information, SWOT analysis, and key developments. The financial information presented is extracted from the annual reports and official documents of the publicly listed companies. Upon collecting the information for the sections of respective companies, we verify them via various primary sources and then compile the data in respective company profiles. The company level information helps us in deriving the base number as well as in forecasting the market size.
- Developing Base Number:
Aggregation of sales statistics (2020-2022) and macro-economic factor, and other secondary and primary research insights are utilized to arrive at base number and related market shares for 2022. The data gaps are identified in this step and relevant market data is analyzed, collected from paid primary interviews or databases. On finalizing the base year market size, forecasts are developed on the basis of macro-economic, industry and market growth factors and company level analysis.
- Data Triangulation and Final Review:
The market findings and base year market size calculations are validated from supply as well as demand side. Demand side validations are based on macro-economic factor analysis and benchmarks for respective regions and countries. In case of supply side validations, revenues of major companies are estimated (in case not available) based on industry benchmark, approximate number of employees, product portfolio, and primary interviews revenues are gathered. Further revenue from target product/service segment is assessed to avoid overshooting of market statistics. In case of heavy deviations between supply and demand side values, all thes steps are repeated to achieve synchronization.
We follow an iterative model, wherein we share our research findings with Subject Matter Experts (SME’s) and Key Opinion Leaders (KOLs) until consensus view of the market is not formulated – this model negates any drastic deviation in the opinions of experts. Only validated and universally acceptable research findings are quoted in our reports.
We have important check points that we use to validate our research findings – which we call – data triangulation, where we validate the information, we generate from secondary sources with primary interviews and then we re-validate with our internal data bases and Subject matter experts. This comprehensive model enables us to deliver high quality, reliable data in shortest possible time.


 Obtenga una muestra gratuita de este informe