Stratégies du marché des cartes de carburant d’aviation, principaux acteurs, opportunités de croissance, analyse et prévisions d’ici 2030
Données historiques : 2020-2021 | Année de référence : 2022 | Période de prévision : 2022-2030Analyse de la taille et des prévisions du marché des cartes carburant pour l'aviation (2020-2030), des parts mondiales et régionales, des tendances et des opportunités de croissance. Couverture du rapport : par type (marchand, marque) ; application (commerciale, privée) ; et géographie.
- Statut : Publié
- Code du rapport : TIPRE00031432
- Catégorie : Banque, services financiers et assurances
- Nombre de pages : 142
- Formats de rapport disponibles :


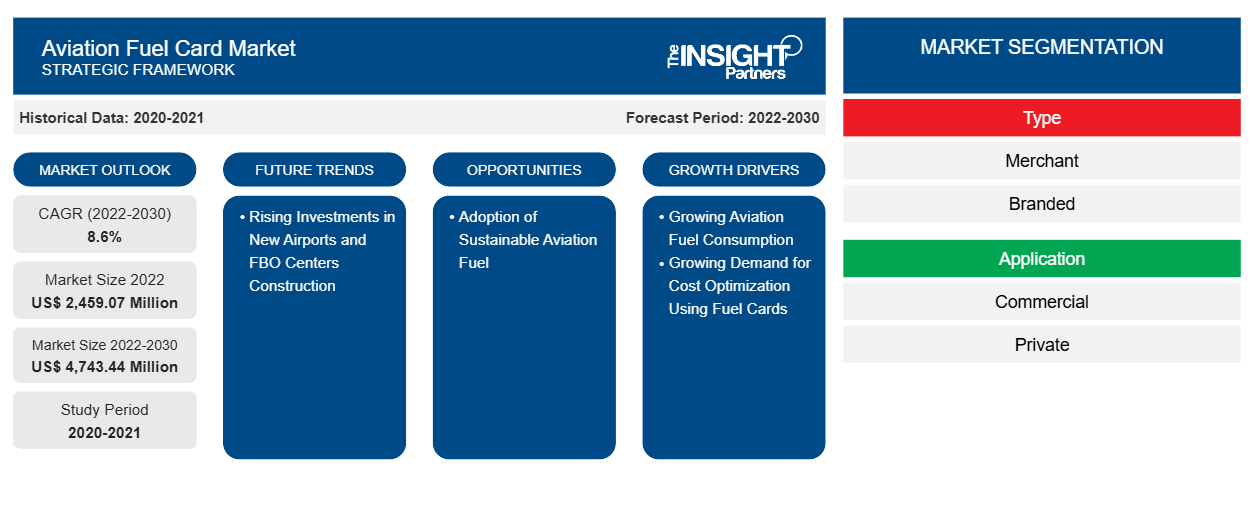
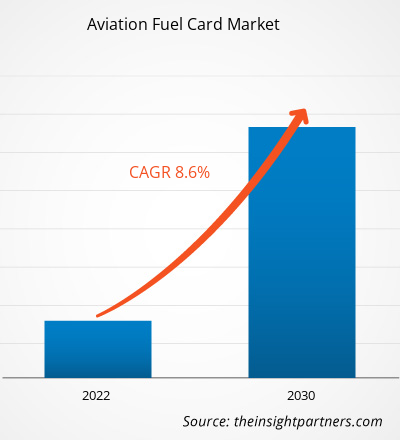
La taille du marché des cartes de carburant pour l'aviation devrait atteindre 4 743,44 millions USD d'ici 2030, contre 2 459,07 millions USD en 2022. Le marché devrait enregistrer un TCAC de 8,6 % en 2022-2030.
Traditionnellement, l'industrie aéronautique a effectué des paiements pour le carburant de diverses manières, en fonction des conditions économiques et des accords en vigueur de l'industrie du carburant et de la compagnie aérienne. Les compagnies aériennes et d'autres industries aéronautiques achètent fréquemment du carburant sur le marché au comptant, soit directement auprès des compagnies pétrolières, soit par l'intermédiaire de courtiers en carburant. Dans de telles situations, la société d'aviation paiera très probablement le carburant avec un mélange d'argent comptant et de crédit. Dans l'ensemble, le mode de paiement utilisé par l'industrie aéronautique pour acquérir du carburant sera déterminé par une variété de critères, tels que la taille de l'entreprise, son emplacement, sa stratégie d'achat, les conditions du marché et les possibilités disponibles. Les cartes d'entreprise à limite élevée avec un logiciel de gestion des coûts intégré peuvent faciliter considérablement le suivi des paiements de carburant. Les cartes à limite élevée offrent aux entreprises beaucoup plus de flexibilité de paiement, ce qui signifie qu'elles peuvent continuer à fonctionner sans faire face à des retards bancaires et à des frais de prêt. De plus, contrairement aux cartes d'essence, qui sont rarement liées à un logiciel de gestion des coûts , les cartes de crédit d'entreprise à limite élevée des sociétés de gestion des dépenses offrent une expérience entièrement intégrée. Les cartes de crédit d'entreprise ont simplifié la centralisation des factures de carburant et rationalisé le processus global de gestion des dépenses. Plutôt que de recourir à différents modes de paiement ou de remboursement, une seule carte de crédit peut être utilisée pour tous les achats liés au carburant, ce qui facilite le suivi et la gestion des dépenses. La consolidation des dépenses de carburant avec une carte de crédit professionnelle peut contribuer à développer des liens plus solides avec les fournisseurs de carburant. Les compagnies aériennes qui utilisent fréquemment une seule carte pour les transactions de carburant peuvent avoir un plus grand pouvoir de négociation avec les fournisseurs de carburant en termes de remises sur volume ou de conditions favorables. Ainsi, les avantages offerts par d’autres méthodes alternatives freinent la croissance du marché des cartes de carburant pour l’aviation .
Analyse du marché des cartes de carburant pour l'aviation
De nombreux producteurs de carburant et exploitants de compagnies aériennes prennent des initiatives pour développer et adopter un carburant d'aviation durable. En 2023, lors du salon aéronautique de Dubaï, les responsables de Boeing et de Zero Petroleum ont signé un accord visant à accélérer le développement du carburant d'aviation durable synthétique (SAF). En 2023, Neste a aidé l'aéroport de Trollhättan-Vänersborg et la compagnie aérienne Västflyg à devenir la première compagnie aérienne au monde à utiliser du carburant d'aviation durable sur tous ses vols. En 2023, Emirates a accepté de fournir environ 300 000 gallons de carburant d'aviation durable mélangé (SAF) à la plateforme internationale de la compagnie aérienne à Dubaï (DXB) grâce à un partenariat avec Shell Aviation. De telles initiatives devraient accroître l'adoption du carburant d'aviation durable. Les fournisseurs de cartes de carburant d'aviation peuvent développer leurs activités en proposant des offres et des remises attractives sur l'achat de carburant d'aviation durable. Cela conduira à terme à une adoption et une utilisation accrues des cartes de carburant d'aviation. De plus, grâce à un partenariat avec des opérateurs fixes, les fournisseurs de services de cartes de carburant peuvent étendre le réseau pour fournir du carburant d'aviation durable. Ainsi, l’augmentation des transactions de carburant d’aviation durable devrait offrir de nombreuses opportunités de croissance pour le marché des cartes de carburant d’aviation au cours de la période de prévision.
Aperçu du marché des cartes de carburant pour l'aviation
Le rôle des fournisseurs de cartes carburant dans l'écosystème du marché des cartes carburant d'aviation est crucial pour assurer le bon fonctionnement et la fiabilité des cartes carburant. Les fournisseurs de cartes carburant d'aviation jouent un rôle important dans la fourniture de services de cartes carburant aux utilisateurs finaux tels que les compagnies aériennes commerciales et privées. Les fournisseurs de cartes carburant assurent un rôle sûr et efficace dans les processus de paiement du carburant d'aviation. Les principaux fournisseurs de carburant qui fournissent des services de cartes carburant sont appelés fournisseurs de carburant de marque, notamment BP plc, Shell Global, ExxonMobil, Titan Aviation Fuels, Jio-BP, AEGFUELS et TotalEnergies Aviation. Ces entités sont chargées de fournir elles-mêmes du carburant d'aviation et des cartes carburant d'aviation et garantissent ainsi une chaîne d'approvisionnement fiable en cartes carburant d'aviation. Les tiers et les entreprises privées qui fournissent des services de cartes carburant sont appelés fournisseurs de carburant marchands, notamment World Fuel Services, CSI global-fleet, Aviation Pros et Avfuel Corporation. Les fournisseurs de cartes carburant marchands sont des entités engagées dans un partenariat ou une collaboration avec les principaux fournisseurs de carburant d'aviation et garantissent un processus de paiement transparent et sécurisé. Ce partenariat ou cette collaboration implique l'intégration de systèmes pour faciliter des transactions efficaces et maintenir un approvisionnement en carburant fiable.
Personnalisez ce rapport en fonction de vos besoins
Vous bénéficierez d'une personnalisation gratuite de n'importe quel rapport, y compris de certaines parties de ce rapport, d'une analyse au niveau des pays, d'un pack de données Excel, ainsi que d'offres et de remises exceptionnelles pour les start-ups et les universités.
Marché des cartes de carburant pour l'aviation : informations stratégiques
-
Obtenez les principales tendances clés du marché de ce rapport.This FREE sample will include data analysis, ranging from market trends to estimates and forecasts.
Aviation Fuel Card Market Drivers and Opportunities
Increasing Aviation Fuel Consumption
Due to the high demand for air travel, overall fuel consumption has increased. In 2022, US airlines carried 194 million more passengers than in 2021, an increase of 30% year on year. From January to December of 2022, US airlines handled 853 million passengers, up from 658 million in 2021 and 388 million in 2020. In 2021, the European Union (EU) experienced a significant rebound in air travel as the total number of passengers reached 373 million. This figure reflects a remarkable increase of 34.9% compared to the previous year, 2020. The surge in air passenger numbers was observed in Croatia, which experienced a remarkable increase of 84% in comparison to the 2021. Furthermore, Cyprus and Greece recorded substantial growth rates of 104.8% and 85.9%, respectively. This surge in the number of passengers, particularly in countries such as Croatia, Cyprus, and Greece, highlights the growing demand for air travel and the subsequent need for fuel.
Rising Investments in New Airport and Fixed Base Operator Center Construction
Various developed and developing countries across the globe are focusing on increasing their total number of airports. In 2023, the government of Vietnam intends to build more than 30 airports by 2030 in order to enhance tourism and trade. The country has established 22 airports; however, the government is focused on constructing new airports in order to accommodate the growing number of aircraft. The Vietnamese government approved the building of the Long Thanh International Airport in 2021, with completion scheduled for 2025. The Long Thanh International Airport will be Vietnam's largest airport, with a capacity of up to 100 million people per year. The government aims to expand to more than 30 airports by 2030, which demonstrates the country's commitment to developing its aviation industry. In 2023, Saudi Arabia announced the expansion of its domestic aviation industry, which will require an investment of US$ 100 billion. In 2023, India announced investments of US$ 12 billion in airports over the next two years, including orders for hundreds of new planes to fulfill surging travel demand, which is putting a burden on current infrastructure.
Aviation Fuel Card Market Report Segmentation Analysis
Key segments that contributed to the derivation of the Aviation Fuel Card Market analysis are type, application, and geography.
- Based on type, the Aviation Fuel Card Market has been segmented into merchant and branded. The merchant segment held a larger market share in 2022.
- By application, the Aviation Fuel Card Market has been segmented into commercial and private. The commercial segment held the largest share of the market in 2022.
Aviation Fuel Card Market Share Analysis by Geography
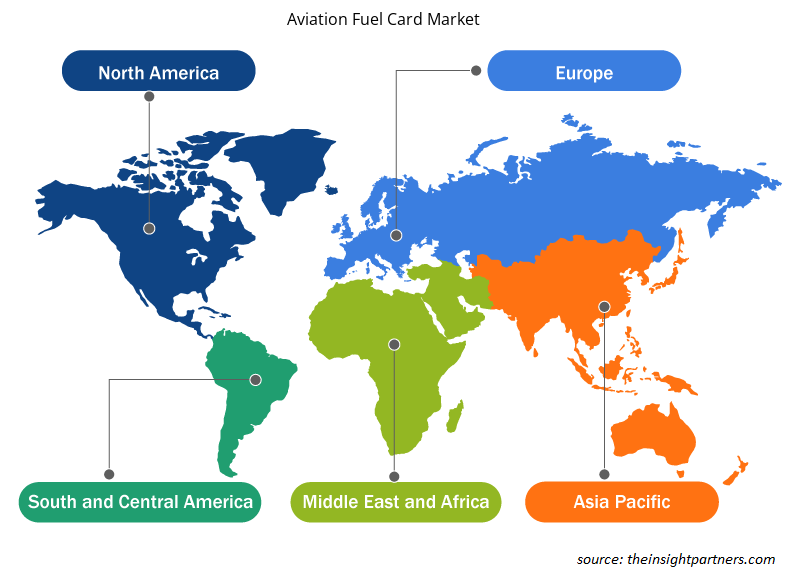
The geographic scope of the Aviation Fuel Card Market report is mainly divided into five regions: North America, Europe, Asia Pacific, Middle East & Africa, and South America.
North America has dominated the Aviation Fuel Card Market in 2022, and it is expected to retain its dominance during the forecast period as well. The North America aviation fuel card industry is mainly driven by the growing awareness of the fuel card concept. Moreover, the growing aviation industry in countries such as the US and Canada is further driving the aviation fuel card market. The aviation industry is one of the notable industries in the US. As per the data published by the Airlines for America in 2023, commercial aviation accounted for 5% of US GDP and US$ 1.25 trillion in 2022. In addition, a large network of airports and fixed base operators in the US has supported the increased use of aviation fuel cards. In 2022, the US operated more than 5,100 public airports and 14,850 private airports. The air transportation industry contributes significantly to the Canadian economy. As per the International Air Transport Association (IATA), the industry contributed US$ 37 billion to Canadian GDP in 2018. Rising aviation fuel consumption and increasing aviation prices are driving the aviation fuel card market in Mexico. In June 2022, state-owned Pemex's wholesale jet fuel prices increased dramatically. The US held the largest share in the North America aviation fuel card market in 2022.
Aviation Fuel Card Market Regional Insights
The regional trends and factors influencing the Aviation Fuel Card Market throughout the forecast period have been thoroughly explained by the analysts at Insight Partners. This section also discusses Aviation Fuel Card Market segments and geography across North America, Europe, Asia Pacific, Middle East and Africa, and South and Central America.
- Get the Regional Specific Data for Aviation Fuel Card Market
Aviation Fuel Card Market Report Scope
| Report Attribute | Details |
|---|---|
| Market size in 2022 | US$ 2,459.07 Million |
| Market Size by 2030 | US$ 4,743.44 Million |
| Global CAGR (2022-2030) | 8.6% |
| Historical Data | 2020-2021 |
| Forecast period | 2022-2030 |
| Segments Covered |
By Type
|
| Regions and Countries Covered |
North America
|
| Market leaders and key company profiles |
|
Aviation Fuel Card Market Players Density: Understanding Its Impact on Business Dynamics
Le marché des cartes de carburant pour l'aviation connaît une croissance rapide, tirée par la demande croissante des utilisateurs finaux en raison de facteurs tels que l'évolution des préférences des consommateurs, les avancées technologiques et une plus grande sensibilisation aux avantages du produit. À mesure que la demande augmente, les entreprises élargissent leurs offres, innovent pour répondre aux besoins des consommateurs et capitalisent sur les tendances émergentes, ce qui alimente davantage la croissance du marché.
La densité des acteurs du marché fait référence à la répartition des entreprises ou des sociétés opérant sur un marché ou un secteur particulier. Elle indique le nombre de concurrents (acteurs du marché) présents sur un marché donné par rapport à sa taille ou à sa valeur marchande totale.
Les principales entreprises opérant sur le marché des cartes de carburant pour l'aviation sont :
- Shell Plc
- BP plc
- Groupe énergétique associé LLC
- Groupe Viva Energy Ltd
- Carburants d'aviation TITAN Inc.
Avis de non-responsabilité : les sociétés répertoriées ci-dessus ne sont pas classées dans un ordre particulier.
- Obtenez un aperçu des principaux acteurs du marché des cartes de carburant pour l'aviation
Actualités et développements récents du marché des cartes de carburant pour l'aviation
Le marché des cartes de carburant pour l'aviation est évalué en collectant des données qualitatives et quantitatives après des recherches primaires et secondaires, qui comprennent des publications d'entreprise importantes, des données d'association et des bases de données. Voici une liste des développements sur le marché des cartes de carburant pour l'aviation et des stratégies :
- En septembre 2023, Air bp, fournisseur international de produits et services de carburant pour l'aviation, a lancé l'offre de carburant Jet-A1 au terminal d'aviation générale (GA) de l'aéroport de Berlin-Brandebourg (BER) dans le cadre d'une collaboration d'agence récemment conclue avec ExecuJet. (Source : Air BP, communiqué de presse/site Web de l'entreprise/bulletin d'information)
- En octobre 2022, TreviPay, le réseau mondial de paiements et de facturation B2B, a lancé TreviPay Aviation Network, propulsé par KHI, pour offrir une solution de carte en boucle fermée comarquée adaptée aux besoins des FBO (opérateurs de base fixe) et des organisations de services d'assistance en vol qui desservent les industries de l'aviation générale et de défense, et leurs clients. (Source : TreviPay, communiqué de presse/site Web de l'entreprise/bulletin d'information)
Rapport sur le marché des cartes de carburant pour l'aviation : couverture et livrables
Le rapport « Taille et prévisions du marché des cartes de carburant pour l’aviation (2020-2030) » fournit une analyse détaillée du marché couvrant les domaines ci-dessous :
- Taille du marché et prévisions aux niveaux mondial, régional et national pour tous les segments de marché clés couverts par le périmètre
- Dynamique du marché, comme les facteurs moteurs, les contraintes et les opportunités clés
- Principales tendances futures
- Analyse détaillée des cinq forces de Porter
- Analyse du marché mondial et régional couvrant les principales tendances du marché, les principaux acteurs, les réglementations et les développements récents du marché
- Analyse du paysage industriel et de la concurrence couvrant la concentration du marché, l'analyse de la carte thermique, les principaux acteurs et les développements récents
- Profils d'entreprise détaillés avec analyse SWOT

Ankita est une professionnelle dynamique des études de marché et du conseil, forte de plus de 8 ans d'expérience dans les secteurs des technologies, des médias, des TIC, de l'électronique et des semi-conducteurs. Elle a dirigé et réalisé avec succès plus de 100 missions de conseil et d'études pour des clients internationaux tels que Microsoft, Oracle, NEC Corporation, SAP, KPMG et Expeditors International. Ses compétences clés incluent l'analyse de marché, l'analyse de données, la prévision, la formulation de stratégies, la veille concurrentielle et la rédaction de rapports.
Ankita maîtrise parfaitement la gestion de cycles de projet complets, de la conception de propositions avant-vente et des discussions avec les clients jusqu'à la fourniture d'informations exploitables après-vente. Elle maîtrise la gestion d'équipes transverses, la structuration de modules d'études complexes et l'alignement des solutions sur les objectifs commerciaux spécifiques de chaque client. Ses excellentes compétences en communication, leadership et présentation lui ont permis de fournir systématiquement des résultats à forte valeur ajoutée dans des environnements de marché dynamiques et en constante évolution.
- Analyse historique (2 ans), année de base, prévision (7 ans) avec TCAC
- Analyse PEST et SWOT
- Taille du marché Valeur / Volume - Mondial, Régional, Pays
- Industrie et paysage concurrentiel
- Ensemble de données Excel
Rapports récents
Témoignages
Le rapport sur le marché des systèmes SCADA d'Insight Partners est complet et fournit des informations précieuses sur les tendances actuelles et les prévisions. L'équipe a fait preuve d'un grand professionnalisme, d'une grande réactivité et d'un grand soutien tout au long du projet. Nous sommes très satisfaits et recommandons vivement leurs services.
RAN KEDEM Partenaire, Reali Technologies LTDJ'ai demandé un rapport sur un marché logiciel très spécifique et l'équipe l'a produit en quelques jours. Les informations étaient très pertinentes et bien présentées. J'ai ensuite demandé des modifications et des ajouts au rapport. L'équipe a de nouveau été très réactive et j'ai reçu le rapport final en moins d'une semaine.
JEAN-HERVÉ JENN Président, Future AnalyticaNous avons collaboré avec The Insight Partners pour une importante étude de marché et des prévisions. Ils nous ont fourni une vision claire des opportunités et des risques, ce qui nous a aidés à élaborer nos plans. Leurs recherches étaient faciles à utiliser et basées sur des données solides. Elles nous ont permis de prendre des décisions éclairées et en toute confiance. Nous les recommandons vivement.
PIYUSH NAGPAL Vice-président principal, Feux de route mondiauxInsight Partners a réalisé une étude de marché pertinente et bien structurée, avec une solide expertise du domaine. Son équipe a fait preuve de professionnalisme et de réactivité tout au long du projet. Son site web convivial a facilité l'accès aux rapports sectoriels. Nous recommandons vivement ses services d'études fiables et de haute qualité.
YUKIHIKO ADACHI PDG, Bleu profond, LLC.C'est la première fois que j'achète une étude de marché auprès de The Insight Partners. J'étais un peu hésitant au début, mais j'ai consulté leur site web et me suis senti plus à l'aise pour prendre le risque d'acheter une étude de marché. Je suis entièrement satisfait de la qualité du rapport et du service client. J'avais plusieurs questions et commentaires concernant le rapport initial, mais après quelques échanges par e-mail avec leur analyste, je pense avoir obtenu un rapport qui pourra alimenter notre processus de planification stratégique. Merci beaucoup pour votre temps et pour avoir rendu cette expérience positive. Je recommanderai sans hésiter vos services et vous serez mon premier contact lorsque nous aurons besoin de données de marché supplémentaires.
JOHN SUZUKI Président-directeur général, administrateur du conseil d'administration, BK TechnologiesJe tiens à vous remercier pour votre soutien et le professionnalisme dont vous avez fait preuve lors du traitement de ma demande d'informations concernant le marché des dispositifs de diagnostic in vitro (DIV) pour les maladies infectieuses au Nigéria. J'apprécie votre patience, vos conseils et votre volonté d'offrir une réduction, ce qui nous a finalement permis de conclure un accord. Je me réjouis de collaborer à nouveau avec The Insight Partners, grâce à l'impression que vous m'avez laissée suite à cette première rencontre.
DR CHIJIOKE DIRECTEUR GÉNÉRAL D'ONYIA, PineCrest Healthcare Ltd.Raison d'acheter
- Prise de décision éclairée
- Compréhension de la dynamique du marché
- Analyse concurrentielle
- Connaissances clients
- Prévisions de marché
- Atténuation des risques
- Planification stratégique
- Justification des investissements
- Identification des marchés émergents
- Amélioration des stratégies marketing
- Amélioration de l'efficacité opérationnelle
- Alignement sur les tendances réglementaires


 Obtenez un échantillon gratuit pour - Marché des cartes de carburant pour l'aviation