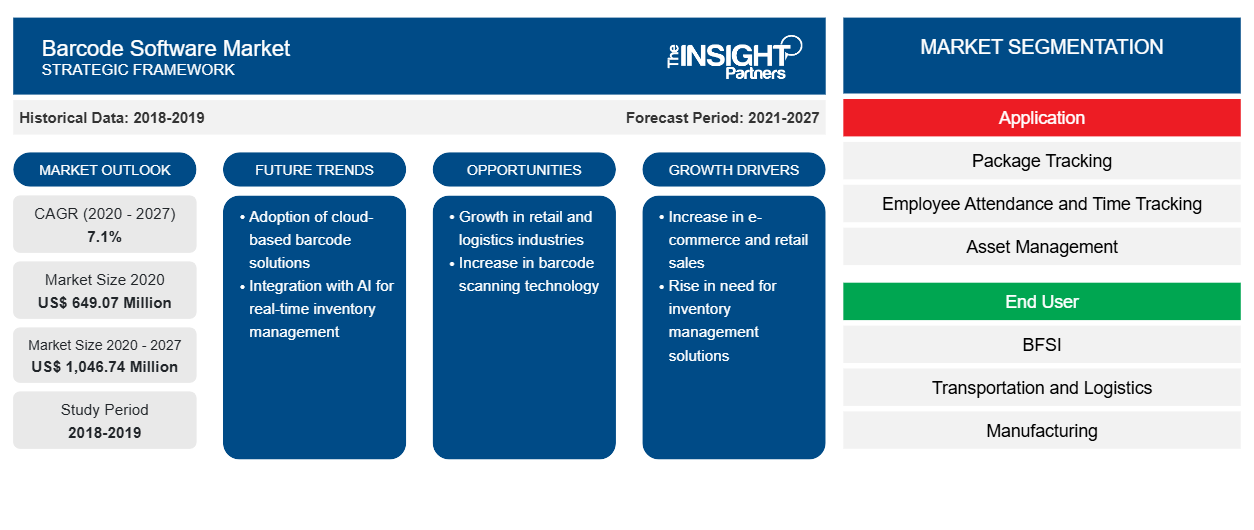
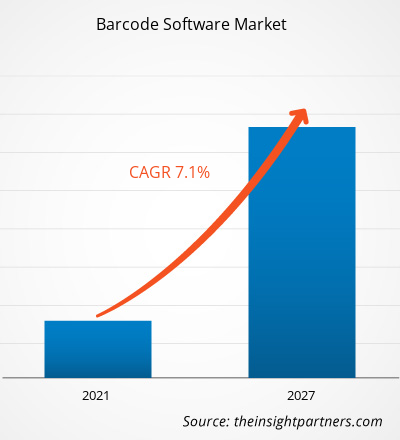
Nel 2020, il mercato del software per codici a barre era valutato 649,07 milioni di dollari USA e si stima che crescerà a un CAGR del 7,1% dal 2020 al 2027.
La necessità di un software per codici a barre per la gestione della supply chain è attribuibile alla crescita del mercato. La tecnologia dei codici a barre migliora e potenzia ogni aspetto della gestione della supply chain. Rende l'intero processo di integrazione aziendale efficace e fluido. La tecnologia aiuta a tracciare lo stato della spedizione del prodotto in tempi trascurabili, riducendo così gli errori nel processo complessivo. Inoltre, è conveniente e facile da usare. Grazie a questi vantaggi, la popolarità dell'uso della tecnologia dei codici a barre sta aumentando tra le aziende, in particolare per la gestione della supply chain. Il tracciamento tramite software per codici a barre aiuta a risparmiare tempo e denaro e garantisce l'uso di dati accurati per il processo decisionale. La gestione manuale dell'inventario richiede diverse ore per essere completata; d'altra parte, l'etichettatura dei codici a barre consente il tracciamento e l'analisi della spedizione in tempo reale, rendendo le operazioni complessive della supply chain fluide e veloci. L'ospedale universitario di Digione ha implementato i codici a barre GS1 per garantire una maggiore sicurezza ed efficienza della supply chain. Inoltre, questi codici a barre hanno aiutato l'ospedale a operare in modo più fluido ed efficiente, oltre a ridurre completamente gli errori. Allo stesso modo, Zebra Technologies Corporation in uno dei suoi report ha citato il caso di un'azienda di panificazione che ha ridotto i costi di inventario e distribuzione di 3 milioni di USD nel primo anno dopo aver implementato un sistema di tracciamento dell'inventario. Il monitoraggio e l'acquisizione di maggiori informazioni sui loro prodotti hanno consentito all'azienda di panificazione di ottenere informazioni accurate e tempestive sull'inventario. Pertanto, i vantaggi della tecnologia dei codici a barre l'hanno resa uno dei modi più popolari per risparmiare tempo e ridurre gli errori, il che sta aumentando la domanda tra le aziende, creando così opportunità per i fornitori di soluzioni di puntare al segmento della supply chain per l'espansione e la generazione di fatturato.
Personalizza questo report in base alle tue esigenze
Riceverai la personalizzazione gratuita di qualsiasi report, comprese parti di questo report, o analisi a livello nazionale, pacchetto dati Excel, oltre a usufruire di grandi offerte e sconti per start-up e università
- Scopri le principali tendenze di mercato in questo rapporto.Questo campione GRATUITO includerà analisi di dati che spaziano dalle tendenze di mercato alle stime e alle previsioni.
Impatto della pandemia di COVID-19 sul mercato del software per codici a barre
L'epidemia di coronavirus ha colpito economie e industrie in vari paesi a causa di blocchi, divieti di viaggio e chiusure aziendali. Poiché la maggior parte dei paesi sta esercitando blocchi, la domanda di software per codici a barre sta diminuendo a un ritmo notevole. Ciò è dovuto al fatto che i principali paesi acquirenti di software per codici a barre hanno limitato i loro investimenti su questi componenti e stanno utilizzando una discreta percentuale del loro budget per combattere il COVID-19. La chiusura temporanea degli stabilimenti di produzione sta anche mostrando un trend negativo nel mercato del software per codici a barre. La continuità della diffusione del COVID-19 sarebbe gravemente pericolosa per gli operatori del mercato del software per codici a barre .
Approfondimenti di mercato: mercato del software per codici a barre
Necessità di processi di raccolta dati accurati in tempo reale
Le soluzioni software per codici a barre migliorano la velocità e l'accuratezza della raccolta dati, consentendo e potenziando così le aziende di tutte le dimensioni per accelerare le loro operazioni aziendali. Questi prodotti software riducono gli errori umani e migliorano il processo di gestione dell'inventario. Con la crescente concorrenza tra le aziende nei settori sanitario, manifatturiero, della vendita al dettaglio e dei trasporti, tra gli altri, la necessità di tecnologie di raccolta dati accurate in tempo reale è aumentata in modo significativo, il che sta creando domanda di soluzioni software per codici a barre avanzate e facili da implementare. TEKLYNX offre soluzioni di progettazione etichette che aiutano a creare etichette semplici con testo, immagini e codici a barre, nonché etichette più complesse conformi a diverse normative. Alcune delle funzionalità principali del software per codici a barre di TEKLYNX includono capacità di progettazione e integrazione, connessioni complete al database e modelli di etichette leader del settore. Allo stesso modo, Denso ADC, General Data Company, Honeywell International e Zebra Technologies Corporation offrono soluzioni software per codici a barre efficaci ed efficienti per varie esigenze e requisiti del settore. I produttori utilizzano il software per codici a barre per tenere traccia delle quantità del loro inventario, oltre a ridurre i rischi operativi ed eliminare inutili ritardi nel funzionamento aziendale. Molte piccole, medie e grandi aziende manifatturiere sono alla ricerca di soluzioni software per codici a barre più efficienti e convenienti, che stanno trainando il mercato generale.
Approfondimenti basati sulle applicazioni
In base all'applicazione, il mercato del software per codici a barre è segmentato in tracciamento pacchi, rilevazione presenze e tempo dipendenti, gestione asset e altri. Il segmento di gestione asset ha detenuto la quota di mercato maggiore nel 2019.
Gli operatori che operano nel mercato del software per codici a barre si concentrano principalmente sullo sviluppo di prodotti avanzati ed efficienti.
- Nel 2020, General Data ha annunciato l'acquisizione di AmeriGraph Packaging Group (Atlanta, GA). Questa acquisizione amplia le capacità di conversione delle etichette di General Data per includere etichette di prima qualità e imballaggi shrink sleeve per beni di consumo e prodotti alimentari, e aggiunge anche un centro di distribuzione nel sud-est per servire meglio i clienti esistenti.
- Nel 2020, Datalogic, leader mondiale nei mercati dell'acquisizione automatica dei dati e dell'automazione dei processi, è lieta di annunciare Matrix™320, il lettore di codici a immagini fisso industriale più potente e compatto, in grado di offrire massime prestazioni, flessibilità, sicurezza per l'operatore e bassi costi totali di proprietà.
Approfondimenti regionali sul mercato del software per codici a barre
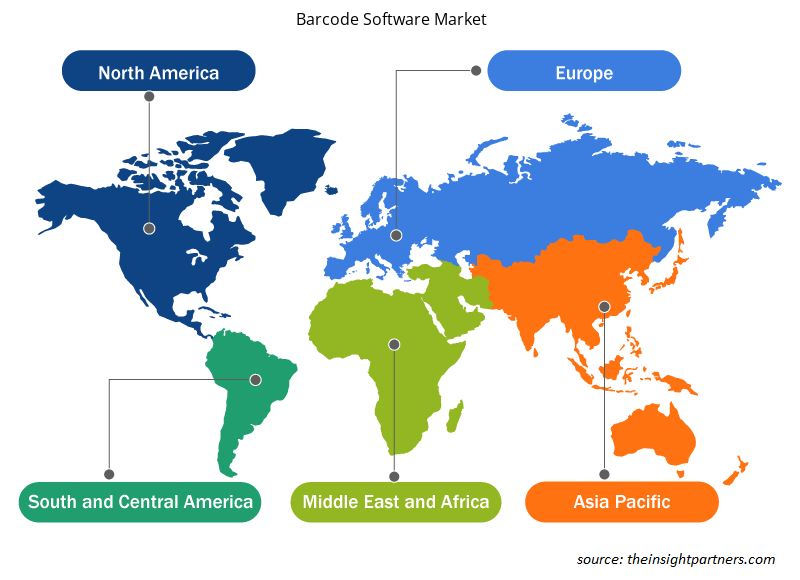
Le tendenze regionali e i fattori che influenzano il mercato del software per codici a barre durante il periodo di previsione sono stati ampiamente spiegati dagli analisti di Insight Partners. Questa sezione discute anche i segmenti e la geografia del mercato del software per codici a barre in Nord America, Europa, Asia Pacifico, Medio Oriente e Africa e America meridionale e centrale.

- Ottieni i dati specifici regionali per il mercato del software per codici a barre
Ambito del rapporto di mercato del software per codici a barre
| Attributo del report | Dettagli |
|---|---|
| Dimensioni del mercato nel 2020 | 649,07 milioni di dollari USA |
| Dimensioni del mercato entro il 2027 | 1.046,74 milioni di dollari USA |
| CAGR globale (2020 - 2027) | 7,1% |
| Dati storici | 2018-2019 |
| Periodo di previsione | 2021-2027 |
| Segmenti coperti | Per applicazione
|
| Regioni e Paesi coperti | America del Nord
|
| Leader di mercato e profili aziendali chiave |
|
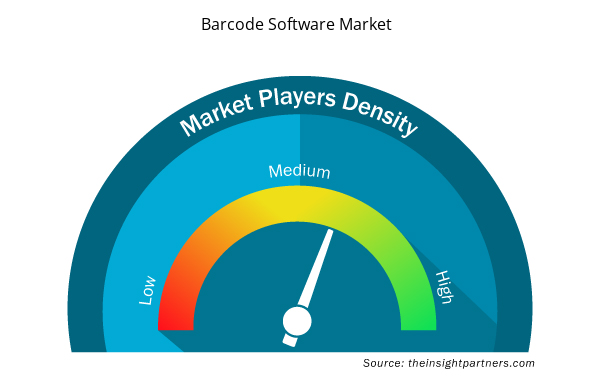
Densità dei player del mercato del software per codici a barre: comprendere il suo impatto sulle dinamiche aziendali
Il mercato del software per codici a barre sta crescendo rapidamente, spinto dalla crescente domanda degli utenti finali dovuta a fattori quali l'evoluzione delle preferenze dei consumatori, i progressi tecnologici e una maggiore consapevolezza dei vantaggi del prodotto. Con l'aumento della domanda, le aziende stanno ampliando le loro offerte, innovando per soddisfare le esigenze dei consumatori e capitalizzando sulle tendenze emergenti, il che alimenta ulteriormente la crescita del mercato.
La densità degli operatori di mercato si riferisce alla distribuzione di aziende o società che operano in un particolare mercato o settore. Indica quanti concorrenti (operatori di mercato) sono presenti in un dato spazio di mercato in relazione alle sue dimensioni o al valore di mercato totale.
Le principali aziende che operano nel mercato del software per codici a barre sono:
- Società a responsabilità limitata Bluebird Inc.
- Datalogic SPA
- Honeywell International, Inc.
- Società NCR
- Società di tecnologie Zebra
Disclaimer : le aziende elencate sopra non sono classificate secondo un ordine particolare.

- Ottieni una panoramica dei principali attori del mercato dei software per codici a barre
Il mercato del software per codici a barre è stato segmentato come segue:
Mercato globale del software per codici a barre - Per applicazione
- Monitoraggio del pacco
- Presenza dei dipendenti e monitoraggio del tempo
- Gestione delle risorse
- Altri
Mercato globale del software per codici a barre - per utente finale
- BFSI
- Trasporti e logistica
- Produzione
- Assistenza sanitaria
- Vedere al dettaglio
- Altri
Mercato del software per codici a barre – per area geografica
America del Nord
- NOI
- Canada
- Messico
Europa
- Francia
- Germania
- Italia
- Russia
- Regno Unito
- Resto d'Europa
Asia Pacifico (APAC)
- Giappone
- Cina
- Australia
- India
- Corea del Sud
- Resto dell'APAC
Medio Oriente e Africa (MEA)
- Arabia Saudita
- Emirati Arabi Uniti
- Sudafrica
- Resto del MEA
America del Sud (SAM)
- Brasile
- Argentina
- Resto del SAM
Mercato del software per codici a barre – Profili aziendali
- Uccello azzurro Inc.
- Sistema dinamico Inc.
- TECNOLOGIE CVISION, INC.
- Datalogic SpA
- Convertitore analogico-digitale DENSO
- Società di dati generali, Inc.
- Honeywell International Inc
- Società NCR
- Società di tecnologie Zebra
- INDUSTRIA ZEBEX INC.
- Analisi storica (2 anni), anno base, previsione (7 anni) con CAGR
- Analisi PEST e SWOT
- Valore/volume delle dimensioni del mercato - Globale, regionale, nazionale
- Industria e panorama competitivo
- Set di dati Excel


- Molecular Diagnostics Market
- Medical Devices Market
- Integrated Platform Management System Market
- HVAC Sensors Market
- Pharmacovigilance and Drug Safety Software Market
- Quantitative Structure-Activity Relationship (QSAR) Market
- Investor ESG Software Market
- Microcatheters Market
- Educational Furniture Market
- EMC Testing Market

Report Coverage
Revenue forecast, Company Analysis, Industry landscape, Growth factors, and Trends

Segment Covered
This text is related
to segments covered.

Regional Scope
North America, Europe, Asia Pacific, Middle East & Africa, South & Central America

Country Scope
This text is related
to country scope.
Domande frequenti
Based on application, the asset tracking segment is dominated the market in 2019. Enterprises across the industry vertical, use barcode technology to track and manage company asset in real-time. Data capture software offered by solution providers has transformed camera equipped devices into a powerful barcode scanner; thereby, helping organizations to effectively mobilize their asset management via various tracking apps.
Need for accurate real time data collection method along with increasing demand for such software among logistics & transportation and healthcare sector is driving the global barcode software market.
In terms of revenue share, Asia Pacific held the largest share of global Barcode Software market in 2019 and it is anticipated to continue its dominance over the forecast period of 2020 to 2027. North America is the second largest revenue contributor, followed by Europe in 2019. Strong industry base especially in BFSI, IT & telecom, automotive, healthcare, and retail sectors is the major factors responsible for high adoption of Barcode Software solutions in the Asia Pacific region.
Trends and growth analysis reports related to Technology, Media and Telecommunications : READ MORE..
The List of Companies - Barcode Software Market
- Bluebird Inc.
- Datalogic S.P.A.
- Honeywell International, Inc.
- NCR Corporation
- Zebra Technologies Corporation
- Dynamic Systems Inc.
- CVISION Technologies
- DENSO ADC
- General Data Company
- Zebex Industries Inc.
The Insight Partners performs research in 4 major stages: Data Collection & Secondary Research, Primary Research, Data Analysis and Data Triangulation & Final Review.
- Data Collection and Secondary Research:
As a market research and consulting firm operating from a decade, we have published and advised several client across the globe. First step for any study will start with an assessment of currently available data and insights from existing reports. Further, historical and current market information is collected from Investor Presentations, Annual Reports, SEC Filings, etc., and other information related to company’s performance and market positioning are gathered from Paid Databases (Factiva, Hoovers, and Reuters) and various other publications available in public domain.
Several associations trade associates, technical forums, institutes, societies and organization are accessed to gain technical as well as market related insights through their publications such as research papers, blogs and press releases related to the studies are referred to get cues about the market. Further, white papers, journals, magazines, and other news articles published in last 3 years are scrutinized and analyzed to understand the current market trends.
- Primary Research:
The primarily interview analysis comprise of data obtained from industry participants interview and answers to survey questions gathered by in-house primary team.
For primary research, interviews are conducted with industry experts/CEOs/Marketing Managers/VPs/Subject Matter Experts from both demand and supply side to get a 360-degree view of the market. The primary team conducts several interviews based on the complexity of the markets to understand the various market trends and dynamics which makes research more credible and precise.
A typical research interview fulfils the following functions:
- Provides first-hand information on the market size, market trends, growth trends, competitive landscape, and outlook
- Validates and strengthens in-house secondary research findings
- Develops the analysis team’s expertise and market understanding
Primary research involves email interactions and telephone interviews for each market, category, segment, and sub-segment across geographies. The participants who typically take part in such a process include, but are not limited to:
- Industry participants: VPs, business development managers, market intelligence managers and national sales managers
- Outside experts: Valuation experts, research analysts and key opinion leaders specializing in the electronics and semiconductor industry.
Below is the breakup of our primary respondents by company, designation, and region:

Once we receive the confirmation from primary research sources or primary respondents, we finalize the base year market estimation and forecast the data as per the macroeconomic and microeconomic factors assessed during data collection.
- Data Analysis:
Once data is validated through both secondary as well as primary respondents, we finalize the market estimations by hypothesis formulation and factor analysis at regional and country level.
- Macro-Economic Factor Analysis:
We analyse macroeconomic indicators such the gross domestic product (GDP), increase in the demand for goods and services across industries, technological advancement, regional economic growth, governmental policies, the influence of COVID-19, PEST analysis, and other aspects. This analysis aids in setting benchmarks for various nations/regions and approximating market splits. Additionally, the general trend of the aforementioned components aid in determining the market's development possibilities.
- Country Level Data:
Various factors that are especially aligned to the country are taken into account to determine the market size for a certain area and country, including the presence of vendors, such as headquarters and offices, the country's GDP, demand patterns, and industry growth. To comprehend the market dynamics for the nation, a number of growth variables, inhibitors, application areas, and current market trends are researched. The aforementioned elements aid in determining the country's overall market's growth potential.
- Company Profile:
The “Table of Contents” is formulated by listing and analyzing more than 25 - 30 companies operating in the market ecosystem across geographies. However, we profile only 10 companies as a standard practice in our syndicate reports. These 10 companies comprise leading, emerging, and regional players. Nonetheless, our analysis is not restricted to the 10 listed companies, we also analyze other companies present in the market to develop a holistic view and understand the prevailing trends. The “Company Profiles” section in the report covers key facts, business description, products & services, financial information, SWOT analysis, and key developments. The financial information presented is extracted from the annual reports and official documents of the publicly listed companies. Upon collecting the information for the sections of respective companies, we verify them via various primary sources and then compile the data in respective company profiles. The company level information helps us in deriving the base number as well as in forecasting the market size.
- Developing Base Number:
Aggregation of sales statistics (2020-2022) and macro-economic factor, and other secondary and primary research insights are utilized to arrive at base number and related market shares for 2022. The data gaps are identified in this step and relevant market data is analyzed, collected from paid primary interviews or databases. On finalizing the base year market size, forecasts are developed on the basis of macro-economic, industry and market growth factors and company level analysis.
- Data Triangulation and Final Review:
The market findings and base year market size calculations are validated from supply as well as demand side. Demand side validations are based on macro-economic factor analysis and benchmarks for respective regions and countries. In case of supply side validations, revenues of major companies are estimated (in case not available) based on industry benchmark, approximate number of employees, product portfolio, and primary interviews revenues are gathered. Further revenue from target product/service segment is assessed to avoid overshooting of market statistics. In case of heavy deviations between supply and demand side values, all thes steps are repeated to achieve synchronization.
We follow an iterative model, wherein we share our research findings with Subject Matter Experts (SME’s) and Key Opinion Leaders (KOLs) until consensus view of the market is not formulated – this model negates any drastic deviation in the opinions of experts. Only validated and universally acceptable research findings are quoted in our reports.
We have important check points that we use to validate our research findings – which we call – data triangulation, where we validate the information, we generate from secondary sources with primary interviews and then we re-validate with our internal data bases and Subject matter experts. This comprehensive model enables us to deliver high quality, reliable data in shortest possible time.


 Ottieni un campione gratuito per questo repot