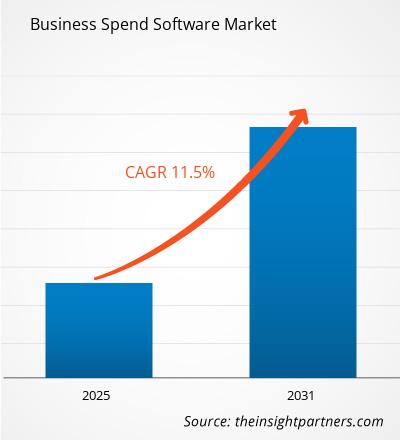
Si prevede che il mercato del software di spesa aziendale registrerà un CAGR dell'11,5% nel periodo 2023-2031. È probabile che le soluzioni di gestione della spesa basate su cloud rimangano una tendenza chiave nel mercato.
Analisi del mercato del software di spesa aziendale
- Il mercato dei software per la spesa aziendale presenta prospettive di crescita dovute alle attuali tendenze di mercato e al loro impatto prevedibile durante il periodo di previsione.
- Il mercato dei software per la gestione delle spese aziendali è in crescita grazie a fattori quali la crescente consapevolezza dei vantaggi dei software per la gestione delle spese aziendali, l'aumento della spesa IT delle aziende e il crescente numero di PMI.
- Analisi delle spese basata sull'intelligenza artificiale per offrire opportunità redditizie al mercato dei software per la gestione delle spese aziendali.
Panoramica del mercato del software di spesa aziendale
- I software per la gestione delle spese aziendali sono strumenti e piattaforme digitali progettati per aiutare le organizzazioni a gestire, monitorare e ottimizzare le proprie spese finanziarie.
- In genere, queste soluzioni coprono una vasta gamma di argomenti relativi alle spese aziendali, come analisi finanziarie, budget, conti da pagare, approvvigionamento e gestione delle spese.
- Business Spend Software aiuta le aziende a far rispettare le normative sulla spesa, a negoziare migliori contratti con i fornitori, a trovare possibilità di risparmio sui costi e a prendere decisioni finanziarie più consapevoli centralizzando i dati sulla spesa, automatizzando i flussi di lavoro di approvazione e offrendo visibilità in tempo reale sulle spese.
- Grazie a questa tecnologia, i team finanziari e i dirigenti avranno maggiore controllo e visibilità sui modelli di spesa dell'intera azienda, il che dovrebbe aumentare l'efficienza, ridurre gli errori, migliorare la conformità e, in ultima analisi, migliorare i profitti dell'organizzazione.
Personalizza la ricerca in base alle tue esigenze
Possiamo ottimizzare e personalizzare l'analisi e l'ambito che non sono soddisfatti dalle nostre offerte standard. Questa flessibilità ti aiuterà a ottenere le informazioni esatte necessarie per la pianificazione aziendale e il processo decisionale.
Mercato del software per la spesa aziendale: approfondimenti strategici

Tasso di crescita annuo composto (2023-2031)11,5%- Dimensione del mercato 2023
US$ XX milioni - Dimensione del mercato 2031
US$ XX milioni
Dinamiche di mercato
- Maggiore consapevolezza sui vantaggi della spesa aziendale in software, aumento della spesa IT delle aziende e aumento del numero di PMI
- Analisi della spesa basata sull'intelligenza artificiale
- Soluzioni di gestione delle spese basate sul cloud
Giocatori chiave
- Altergia.
- SAP SE
- Società di software Coupa Inc.
- Procurare
- IBM
- Frazione.
- Società
- GEP
- Sage Intacct, Inc.
- Gruppo Touchstone Plc
Panoramica regionale

- America del Nord
- Europa
- Asia-Pacifico
- America del Sud e Centro
- Medio Oriente e Africa
Segmentazione del mercato
 Componente
- Software
- Servizi
 Distribuzione
- Cloud e locale
 Dimensioni aziendali
- PMI e Grandi Imprese
Utente finale- BFSI
- Viaggi e turismo
- Ospitalità
- Assistenza sanitaria
- Informatica e telecomunicazioni
- Energia e servizi
- Commercio al dettaglio e commercio elettronico
- Il PDF di esempio illustra la struttura del contenuto e la natura delle informazioni con analisi qualitative e quantitative.
Driver e opportunità del mercato del software per la spesa aziendale
Aumentare la consapevolezza sui vantaggi della spesa aziendale per il software a favore del mercato
- Il software di gestione della spesa è un insieme di strumenti e soluzioni digitali che consentono alle aziende di gestire e controllare le proprie spese.
- Un software di gestione delle spese può aiutare le aziende a raggiungere i propri obiettivi finanziari applicando un programma di gestione delle spese e offrendo visibilità in tempo reale sulle spese, migliorando il controllo e generando risparmi sui costi.
- Le aziende possono trovare opportunità di risparmio sui costi e agire rapidamente monitorando le spese in tempo reale. Le aziende possono garantire la conformità alle policy e alle normative aziendali e accelerare le procedure di acquisto implementando software di gestione delle spese.
- Con la corretta tecnologia di gestione della spesa, le frodi possono essere evitate e ogni acquisto può essere verificato come essenziale e valido. Il software di gestione della spesa sta diventando sempre più importante per le aziende che cercano di ottimizzare la spesa e risparmiare sui costi.
Progressi tecnologici, come l'integrazione con l'intelligenza artificiale, l'Internet delle cose (IoT) e l'apprendimento automatico (ML)
- Nell'attuale era digitale, l'intelligenza artificiale (IA) e l'apprendimento automatico (ML) offrono un approccio intelligente e strategico per affrontare le complessità della gestione delle spese aziendali.
- L'intelligenza artificiale (IA) e l'apprendimento automatico (ML) sono emersi come un punto di svolta nel campo della gestione della spesa. Le aziende possono aumentare l'efficienza e l'economicità delle loro procedure di gestione della spesa automatizzandole e semplificandole con l'aiuto dell'intelligenza artificiale.
- Le spese possono essere automaticamente scansionate e categorizzate tramite algoritmi di intelligenza artificiale, eliminando la necessità di immissione manuale dei dati.
- Ciò non solo fa risparmiare tempo, ma riduce anche il rischio di errori umani. Le dashboard basate sull'intelligenza artificiale offrono informazioni in tempo reale sulle tendenze di spesa. Ciò consente alle aziende di monitorare le spese man mano che si verificano, anziché affidarsi a report periodici.
- Pertanto, gli strumenti di gestione delle spese aziendali basati sull'intelligenza artificiale offrono alle aziende la possibilità di automatizzare e ottimizzare i processi di gestione delle spese, con conseguenti risparmi sui costi, migliori relazioni con i fornitori e un migliore controllo del budget.
Analisi della segmentazione del rapporto di mercato del software di spesa aziendale
I segmenti chiave che hanno contribuito alla derivazione dell'analisi del mercato del software per la spesa aziendale sono i componenti, l'implementazione, le dimensioni dell'azienda e l'utente finale.
- In base ai componenti, il mercato si divide in software e servizi.
- In base all'implementazione, il mercato è segmentato in cloud e on-premise.
- In base alle dimensioni dell'impresa, il mercato si divide in PMI e grandi imprese.
- In base all'utente finale, il mercato è segmentato in BFSI, viaggi e turismo, ospitalità, sanità, IT e telecomunicazioni, energia e servizi di pubblica utilità, vendita al dettaglio ed e-commerce e altri.
Analisi della quota di mercato del software di spesa aziendale per area geografica
- Il rapporto sul mercato dei software per la spesa aziendale comprende un'analisi dettagliata di cinque principali regioni geografiche, che include le dimensioni attuali e storiche del mercato e le previsioni per il periodo 2021-2031, coprendo Nord America, Europa, Asia-Pacifico (APAC), Medio Oriente e Africa (MEA) e Sud e Centro America.
- Ogni regione è ulteriormente suddivisa in sottosegmenti nei rispettivi paesi. Questo rapporto fornisce analisi e previsioni di oltre 18 paesi, coprendo le dinamiche del mercato del software di spesa aziendale, come driver, tendenze e opportunità che stanno influenzando i mercati a livello regionale.
- Il rapporto comprende inoltre l'analisi PEST, che prevede lo studio dei principali fattori che influenzano il mercato dei software per la spesa aziendale in queste regioni.
Ambito del rapporto di mercato del software di spesa aziendale
| Attributo del report | Dettagli |
|---|---|
| Dimensioni del mercato nel 2023 | XX milioni di dollari USA |
| Dimensioni del mercato entro il 2031 | XX milioni di dollari USA |
| CAGR globale (2023-2031) | 11,5% |
| Dati storici | 2021-2023 |
| Periodo di previsione | 2024-2031 |
| Segmenti coperti | Per componente
|
| Regioni e Paesi coperti | America del Nord
|
| Leader di mercato e profili aziendali chiave |
|
- Il PDF di esempio illustra la struttura del contenuto e la natura delle informazioni con analisi qualitative e quantitative.
Notizie e sviluppi recenti sul mercato del software di spesa aziendale
Il mercato del software per la spesa aziendale viene valutato raccogliendo dati qualitativi e quantitativi dopo la ricerca primaria e secondaria, che include importanti pubblicazioni aziendali, dati associativi e database. Di seguito sono elencati alcuni degli sviluppi nel mercato del software per la spesa aziendale:
- ManageEngine, una divisione di Zoho Corporation e un fornitore leader di soluzioni di gestione IT aziendale, ha annunciato il lancio di SaaS Manager Plus, una soluzione di gestione SaaS per le aziende. SaaS Manager Plus si integra perfettamente con le app Zoho e altre applicazioni ampiamente utilizzate, consentendo agli amministratori IT e ai responsabili finanziari di semplificare i loro ecosistemi SaaS e identificare opportunità di risparmio sui costi per una migliore allocazione del budget. ManageEngine SaaS Manager Plus genera anche report dettagliati sulle tendenze di spesa SaaS, metriche di utilizzo e ripartizioni dei costi per facilitare il processo decisionale informato e la pianificazione del budget. (ManageEngine, comunicato stampa, maggio 2024)
- Ivalua ha annunciato il lancio della sua soluzione External Workforce Management, che consente alle organizzazioni di gestire tutti gli aspetti della propria forza lavoro esterna insieme al resto della spesa dei fornitori. Con Ivalua, le organizzazioni possono ottenere una comprensione completa dei costi della forza lavoro esterna, del valore derivato e del livello di rischio coinvolto in un dato momento. (Ivalua, comunicato stampa, giugno 2024)
- Coupa Software, leader nel Business Spend Management (BSM), ha lanciato Coupa App Marketplace, offrendo ai clienti un modo più semplice e intelligente per estendere la potenza della piattaforma BSM leader. Coupa App Marketplace mette in contatto le aziende con soluzioni certificate e predefinite che creano un modo semplice per attingere a una comunità globale affidabile di partner BSM. (Coupa Software, comunicato stampa, agosto 2021)
Copertura e risultati del rapporto sul mercato del software di spesa aziendale
Il rapporto "Business Spend Software Market Size and Forecast (2021–2031)" fornisce un'analisi dettagliata del mercato che copre le seguenti aree:
- Dimensioni e previsioni del mercato del software di spesa aziendale a livello globale, regionale e nazionale per tutti i segmenti di mercato chiave coperti dall'ambito
- Tendenze del mercato del software di spesa aziendale, nonché dinamiche di mercato quali driver, vincoli e opportunità chiave
- Analisi dettagliata delle cinque forze PEST/Porter e SWOT
- Analisi di mercato del software per la spesa aziendale che copre le principali tendenze del mercato, il quadro globale e regionale, i principali attori, le normative e i recenti sviluppi del mercato.
- Analisi del panorama industriale e della concorrenza che comprende la concentrazione del mercato, l'analisi delle mappe di calore, i principali attori e gli sviluppi recenti per il mercato dei software di spesa aziendale.
- Profili aziendali dettagliati
- Historical Analysis (2 Years), Base Year, Forecast (7 Years) with CAGR
- PEST and SWOT Analysis
- Market Size Value / Volume - Global, Regional, Country
- Industry and Competitive Landscape
- Excel Dataset
- Medical Second Opinion Market
- Airline Ancillary Services Market
- Skin Graft Market
- Quantitative Structure-Activity Relationship (QSAR) Market
- Wire Harness Market
- Virtual Event Software Market
- Single-Use Negative Pressure Wound Therapy Devices Market
- Joint Pain Injection Market
- Influenza Vaccines Market
- Machine Condition Monitoring Market

Report Coverage
Revenue forecast, Company Analysis, Industry landscape, Growth factors, and Trends

Segment Covered
This text is related
to segments covered.

Regional Scope
North America, Europe, Asia Pacific, Middle East & Africa, South & Central America

Country Scope
This text is related
to country scope.
Frequently Asked Questions
The global business spend software market is expected to grow at a CAGR of 11.5% during the forecast period 2024 - 2031.
Increasing awareness regarding the benefits of business spend software, increased IT spending of businesses, and rising number of SMEs are the major factors driving the business spend software market.
Cloud-based spend management solutions are anticipated to play a significant role in the global business spend software market in the coming years.
The leading player operating in the business spend software market is Altergy.; SAP SE; Coupa Software Inc.; Procurify; IBM; Fraxion.; SutiSoft, Inc.; GEP; Sage Intacct, Inc.; and Touchstone Group Plc
The report can be delivered in PDF/PPT format; we can also share an Excel dataset based on the request.
Some of the customization options available based on the request are an additional 3–5 company profiles and a country-specific analysis of 3–5 countries of your choice. Customizations are to be requested/discussed before making final order confirmation, as our team would review the same and check the feasibility.
Trends and growth analysis reports related to Technology, Media and Telecommunications : READ MORE..
The List of Companies
1. SAP SE
2. Advanced
3. Coupa Software Inc.
4. Fraxion
5. GEP
6. Oracle
7. Procurify
8. Sievo
9. SutiSoft
10. Tradogram
The Insight Partners performs research in 4 major stages: Data Collection & Secondary Research, Primary Research, Data Analysis and Data Triangulation & Final Review.
- Data Collection and Secondary Research:
As a market research and consulting firm operating from a decade, we have published and advised several client across the globe. First step for any study will start with an assessment of currently available data and insights from existing reports. Further, historical and current market information is collected from Investor Presentations, Annual Reports, SEC Filings, etc., and other information related to company’s performance and market positioning are gathered from Paid Databases (Factiva, Hoovers, and Reuters) and various other publications available in public domain.
Several associations trade associates, technical forums, institutes, societies and organization are accessed to gain technical as well as market related insights through their publications such as research papers, blogs and press releases related to the studies are referred to get cues about the market. Further, white papers, journals, magazines, and other news articles published in last 3 years are scrutinized and analyzed to understand the current market trends.
- Primary Research:
The primarily interview analysis comprise of data obtained from industry participants interview and answers to survey questions gathered by in-house primary team.
For primary research, interviews are conducted with industry experts/CEOs/Marketing Managers/VPs/Subject Matter Experts from both demand and supply side to get a 360-degree view of the market. The primary team conducts several interviews based on the complexity of the markets to understand the various market trends and dynamics which makes research more credible and precise.
A typical research interview fulfils the following functions:
- Provides first-hand information on the market size, market trends, growth trends, competitive landscape, and outlook
- Validates and strengthens in-house secondary research findings
- Develops the analysis team’s expertise and market understanding
Primary research involves email interactions and telephone interviews for each market, category, segment, and sub-segment across geographies. The participants who typically take part in such a process include, but are not limited to:
- Industry participants: VPs, business development managers, market intelligence managers and national sales managers
- Outside experts: Valuation experts, research analysts and key opinion leaders specializing in the electronics and semiconductor industry.
Below is the breakup of our primary respondents by company, designation, and region:

Once we receive the confirmation from primary research sources or primary respondents, we finalize the base year market estimation and forecast the data as per the macroeconomic and microeconomic factors assessed during data collection.
- Data Analysis:
Once data is validated through both secondary as well as primary respondents, we finalize the market estimations by hypothesis formulation and factor analysis at regional and country level.
- Macro-Economic Factor Analysis:
We analyse macroeconomic indicators such the gross domestic product (GDP), increase in the demand for goods and services across industries, technological advancement, regional economic growth, governmental policies, the influence of COVID-19, PEST analysis, and other aspects. This analysis aids in setting benchmarks for various nations/regions and approximating market splits. Additionally, the general trend of the aforementioned components aid in determining the market's development possibilities.
- Country Level Data:
Various factors that are especially aligned to the country are taken into account to determine the market size for a certain area and country, including the presence of vendors, such as headquarters and offices, the country's GDP, demand patterns, and industry growth. To comprehend the market dynamics for the nation, a number of growth variables, inhibitors, application areas, and current market trends are researched. The aforementioned elements aid in determining the country's overall market's growth potential.
- Company Profile:
The “Table of Contents” is formulated by listing and analyzing more than 25 - 30 companies operating in the market ecosystem across geographies. However, we profile only 10 companies as a standard practice in our syndicate reports. These 10 companies comprise leading, emerging, and regional players. Nonetheless, our analysis is not restricted to the 10 listed companies, we also analyze other companies present in the market to develop a holistic view and understand the prevailing trends. The “Company Profiles” section in the report covers key facts, business description, products & services, financial information, SWOT analysis, and key developments. The financial information presented is extracted from the annual reports and official documents of the publicly listed companies. Upon collecting the information for the sections of respective companies, we verify them via various primary sources and then compile the data in respective company profiles. The company level information helps us in deriving the base number as well as in forecasting the market size.
- Developing Base Number:
Aggregation of sales statistics (2020-2022) and macro-economic factor, and other secondary and primary research insights are utilized to arrive at base number and related market shares for 2022. The data gaps are identified in this step and relevant market data is analyzed, collected from paid primary interviews or databases. On finalizing the base year market size, forecasts are developed on the basis of macro-economic, industry and market growth factors and company level analysis.
- Data Triangulation and Final Review:
The market findings and base year market size calculations are validated from supply as well as demand side. Demand side validations are based on macro-economic factor analysis and benchmarks for respective regions and countries. In case of supply side validations, revenues of major companies are estimated (in case not available) based on industry benchmark, approximate number of employees, product portfolio, and primary interviews revenues are gathered. Further revenue from target product/service segment is assessed to avoid overshooting of market statistics. In case of heavy deviations between supply and demand side values, all thes steps are repeated to achieve synchronization.
We follow an iterative model, wherein we share our research findings with Subject Matter Experts (SME’s) and Key Opinion Leaders (KOLs) until consensus view of the market is not formulated – this model negates any drastic deviation in the opinions of experts. Only validated and universally acceptable research findings are quoted in our reports.
We have important check points that we use to validate our research findings – which we call – data triangulation, where we validate the information, we generate from secondary sources with primary interviews and then we re-validate with our internal data bases and Subject matter experts. This comprehensive model enables us to deliver high quality, reliable data in shortest possible time.
 Get Free Sample For