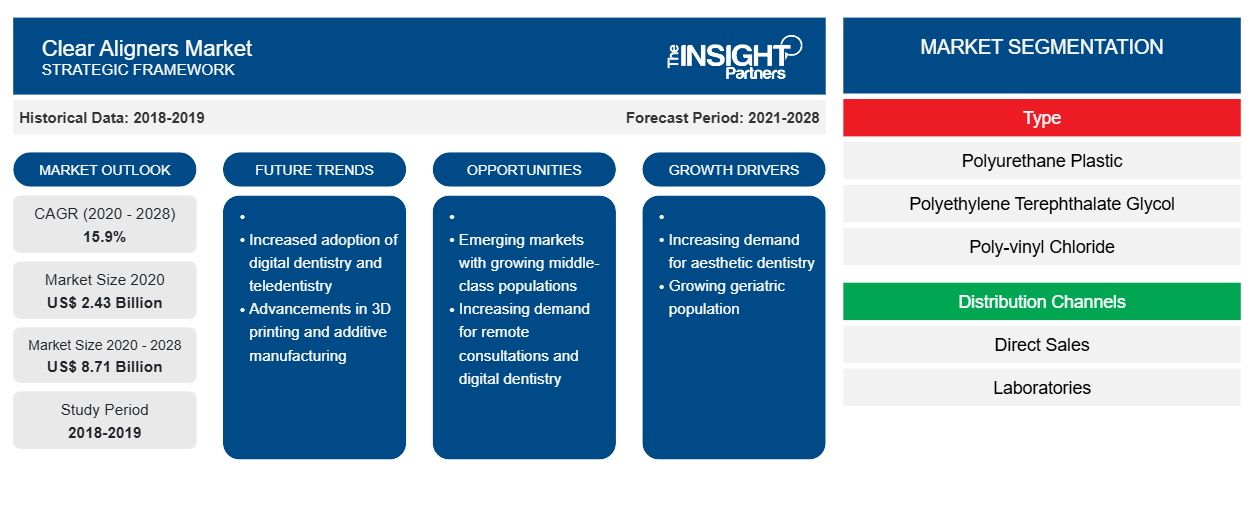
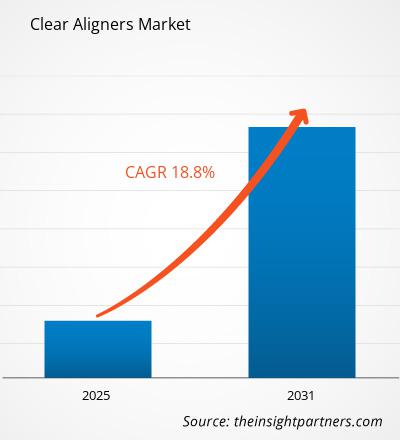
Si prevede che il mercato degli allineatori trasparenti raggiungerà i 21.755,94 milioni di dollari entro il 2031, rispetto ai 6.600 milioni di dollari del 2024. Si prevede che il mercato registrerà un CAGR del 18,8% nel periodo 2025-2031. Lo sviluppo di innesti personalizzati porterà probabilmente nuove tendenze di mercato durante il periodo di previsione.
Analisi del mercato degli allineatori trasparenti
La prevalenza di condizioni dentali e orali come denti storti, morso profondo, morso inverso , morso incrociato , spazi tra i denti, affollamento dentale e disturbi temporomandibolari ( DTM ) sta aumentando l'uso di allineatori trasparenti, stimolando di conseguenza la crescita del mercato. I fattori che causano problemi dentali includono malattie parodontali, lesioni e incidenti. Secondo un articolo pubblicato su Reuters nel 2022, circa 3,5 miliardi di persone in tutto il mondo sono affette da malattie orali, con carie dentali non trattate che colpiscono quasi 2,5 miliardi di individui. Secondo l'American Association of Orthodontists, nel 2022, circa 3,15 milioni di pazienti di età compresa tra 8 e 17 anni erano sottoposti a trattamento ortodontico negli Stati Uniti, rappresentando circa il 7,4% della popolazione in questa fascia d'età. Secondo il BMC Oral Health 2025, il numero di adulti sottoposti a trattamenti ortodontici negli Stati Uniti è aumentato da 1,55 milioni nel 2016 a circa 1,61 milioni nel 2018.
Panoramica del mercato degli allineatori trasparenti
Il mercato degli allineatori trasparenti è in espansione grazie alle crescenti preferenze estetiche, ai progressi tecnologici, alla crescente consapevolezza della salute orale, all'aumento del reddito disponibile e all'integrazione della teleortodonzia e del monitoraggio a distanza. Gli allineatori trasparenti personalizzabili , che si adattano alle preferenze individuali e alle condizioni dentali, possono rappresentare un'importante opportunità per il futuro.
Personalizza questo report in base alle tue esigenze
Riceverai la personalizzazione gratuita di qualsiasi report, incluse parti di questo report, analisi a livello nazionale, pacchetto dati Excel e potrai usufruire di fantastiche offerte e sconti per start-up e università.
Mercato degli allineatori trasparenti: approfondimenti strategici

- Scopri le principali tendenze di mercato di questo rapporto.Questo campione GRATUITO includerà analisi di dati che spaziano dalle tendenze di mercato alle stime e alle previsioni.
Driver e opportunità del mercato degli allineatori trasparenti
Aumento della prevalenza delle malocclusioni nei bambini
Le persone con tratti di malocclusione, tra cui overjet mascellare , irregolarità anteriori e spaziatura anteriore, hanno un aspetto dentale e una performance masticatoria scadenti . Secondo il Dental Tribune International 2025, la malocclusione è tra le condizioni cliniche dentali più diffuse , colpendo circa il 60-75% della popolazione mondiale. Ogni anno, circa 21 milioni di persone a livello globale scelgono il trattamento ortodontista. In termini di prevalenza, la malocclusione si classifica al terzo posto, dopo la carie e la malattia parodontale registrate a livello globale. La malocclusione è più diffusa tra i bambini con disturbo dello spettro autistico ( ASD ). Il morso crociato posteriore, l'overjet cresciuto e l'affollamento mascellare avverso sono stati i tratti di malocclusione più ampiamente diagnosticati nei bambini.
Secondo i dati di Elsevier B.V. , la prevalenza di morso profondo grave era di circa l'8% negli Stati Uniti, con un morso profondo medio compreso tra il 36,5% e il 39,2% nei bambini di età compresa tra 5 e 6 anni. In uno studio pubblicato sul National Center for Biotechnology Information ( NCBI ), è stata eseguita un'analisi dell'occlusione in alcuni gruppi di adolescenti di età compresa tra 12 e 18 anni. Secondo lo studio, oltre il 93% dei soggetti ha confermato una qualche forma di malocclusione. La prevalenza di malocclusione era maggiore negli adolescenti europei. Secondo i dati del National Center for Biotechnology Information ( NCBI ) del 2021, i casi di malocclusioni di classe I (34,9%) e di classe II, divisione 1 (40,0%) erano più elevati. Nella popolazione sono stati segnalati aumento della malocclusione (18%), morsi ridotti (14%), aumento (25,1%) e overjet invertito (10%). Secondo i dati pubblicati dal PeerJ Journal nel 2019, è stata segnalata un'elevata prevalenza della Classe II di Angle, pari al 38,2%, tra gli adolescenti giapponesi di età compresa tra 12 e 15 anni. L'affollamento anteriore era più diffuso tra le ragazze rispetto ai ragazzi. Pertanto, la crescente incidenza di malocclusioni tra gli adolescenti sta incrementando l'uso di allineatori trasparenti, stimolando così la crescita del mercato.
Crescente domanda di procedure odontoiatriche estetiche
La chirurgia estetica dentale è tra le procedure cosmetiche più comuni al mondo. L'American Academy of Cosmetic Dentistry (AACD) è la principale risorsa odontoiatrica per i pazienti che cercano di mantenere la loro salute, la loro funzionalità e il loro aspetto per tutta la vita. Secondo l'American Society for Plastic Surgery (ASPS) del 2022, l'odontoiatria estetica ha registrato un recente boom, con un aumento del 47% delle procedure richieste dalle persone di età compresa tra 51 e 64 anni. Secondo il GlobeNewswire del 2025, ogni anno in tutto il mondo vengono eseguiti quasi 30 milioni di interventi di odontoiatria estetica, che spaziano dallo sbiancamento dentale alle complesse ricostruzioni complete della bocca. Gli interventi di odontoiatria estetica non sono più riservati solo ai ricchi e famosi. Anche la classe media del Nord America si sta sottoponendo a questi interventi a causa del crescente desiderio di migliorare il proprio aspetto estetico. La facile accessibilità alle procedure di odontoiatria chirurgica contribuisce all'adozione di allineatori trasparenti.
Il costo di una procedura di odontoiatria estetica è inferiore in Messico. La differenza tra il prezzo di una procedura di odontoiatria estetica media e quello di una procedura di odontoiatria estetica di alto livello nel paese è di circa 50-150 dollari per corona o faccetta. I dentisti in Messico forniscono corone meno costose, realizzate in laboratorio con materiali di alta qualità. I paesi asiatici stanno lavorando a procedure di odontoiatria estetica con costi inferiori e metodi avanzati. Thailandia, Singapore, India e Malesia sono tra le principali destinazioni per le procedure di odontoiatria estetica. I pazienti provenienti da paesi sviluppati come Stati Uniti e Regno Unito scelgono Singapore per i loro trattamenti. In questi paesi sono presenti centri benessere che offrono trattamenti e procedure odontoiatriche innovative. Ad esempio, Bangkok Dental Spa (situata a Bangkok, in Thailandia) offre servizi odontoiatrici a pazienti stranieri. Pertanto, il rapporto costo-efficacia delle procedure di odontoiatria estetica stimola l'utilizzo di allineatori trasparenti e stimola la crescita del mercato.
Analisi della segmentazione del rapporto di mercato degli allineatori trasparenti
I segmenti chiave che hanno contribuito all'analisi del mercato degli allineatori trasparenti sono tipologia, fascia d'età e utente finale.
- In base alla tipologia, il mercato degli allineatori trasparenti è segmentato in poliuretano plastico, polietilene tereftalato glicole (PETG), cloruro di polivinile (PVC) e altri materiali. Nel 2024, il segmento delle plastiche poliuretaniche deteneva la quota maggiore del mercato degli allineatori trasparenti.
- In termini di fascia d'età, il mercato si divide in adulti e pediatria. Nel 2024, il segmento degli adulti deteneva la quota maggiore del mercato degli allineatori trasparenti.
- In base all'utente finale, il mercato è segmentato in ospedali e farmacie al dettaglio, canali online e altri. Nel 2024, il segmento ospedali e farmacie al dettaglio deteneva la quota maggiore del mercato degli allineatori trasparenti.
Analisi della quota di mercato degli allineatori trasparenti per area geografica
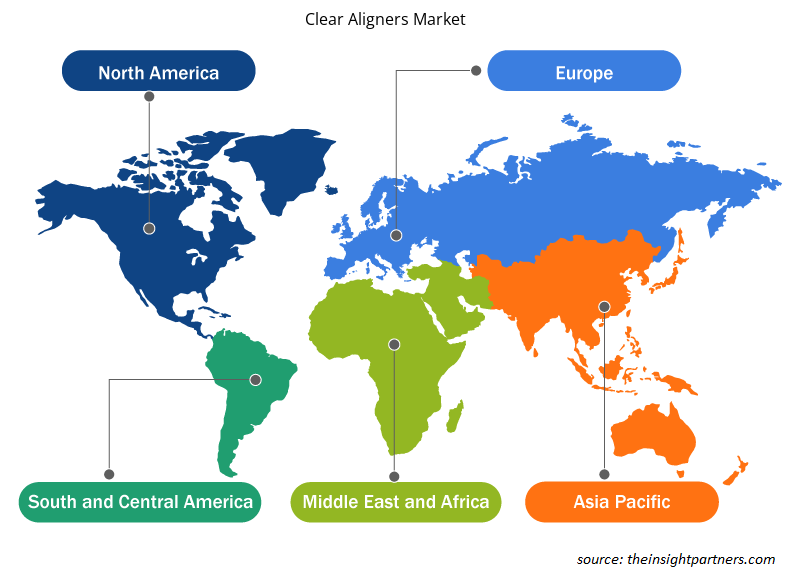
L'ambito geografico del rapporto sul mercato degli allineatori trasparenti si concentra principalmente su cinque regioni: Nord America, Asia-Pacifico, Europa, Sud e Centro America e Medio Oriente e Africa. In termini di fatturato, il Nord America ha dominato il mercato nel 2024 e si prevede che manterrà la sua posizione dominante nel mercato durante il periodo di previsione. Gli Stati Uniti rappresentano una quota significativa del mercato degli allineatori trasparenti, con un numero considerevole di procedure eseguite ogni anno. Secondo lo studio "Dentistry and Oral Health Care" pubblicato sulla rivista Biores Scientia nel 2023, negli Stati Uniti quasi il 30% delle persone presenta un'occlusione normale e la prevalenza della malocclusione di Classe I si attesta tra il 50 e il 55%. La crescente prevalenza della malocclusione sta alimentando la domanda di allineatori trasparenti grazie alla loro estetica, comfort e praticità rispetto ai tradizionali apparecchi metallici. Gli allineatori trasparenti sono praticamente invisibili e rimovibili, il che li rende un'opzione più attraente per adulti e adolescenti che desiderano raddrizzare i denti senza la visibilità e gli inconvenienti dell'ortodonzia tradizionale. Inoltre, offrono la comodità di un minor numero di visite in studio rispetto agli apparecchi tradizionali, che richiedono regolazioni regolari. L'implementazione di iniziative strategiche come il lancio di nuovi prodotti, l'approvazione di nuovi prodotti e le collaborazioni alimentano la crescita del mercato. Nel maggio 2024, OrthoFX ha lanciato una nuova generazione di polimeri trasparenti avanzati per allineatori, i NiTime Clear Aligners. Si tratta del primo e unico sistema di allineatori trasparenti progettato specificamente per tempi di utilizzo più brevi, approvato dalla Food and Drug Administration (FDA) statunitense 510(k) ed è disponibile a livello nazionale per i medici che trattano tutte le classi di malocclusioni dentali.
Approfondimenti regionali sul mercato degli allineatori trasparenti
Le tendenze e i fattori regionali che influenzano il mercato degli allineatori trasparenti durante il periodo di previsione sono stati ampiamente spiegati dagli analisti di Insight Partners. Questa sezione illustra anche i segmenti e la geografia del mercato degli allineatori trasparenti in Nord America, Europa, Asia-Pacifico, Medio Oriente e Africa, e Sud e Centro America.

- Ottieni i dati specifici regionali per il mercato degli allineatori trasparenti
Ambito del rapporto sul mercato degli allineatori trasparenti
| Attributo del report | Dettagli |
|---|---|
| Dimensioni del mercato nel 2024 | 6.600,00 milioni di dollari USA |
| Dimensioni del mercato entro il 2031 | 21.755,94 milioni di dollari USA |
| CAGR globale (2025-2031) | 18,8% |
| Dati storici | 2021-2023 |
| Periodo di previsione | 2025-2031 |
| Segmenti coperti | Per tipo
|
| Regioni e paesi coperti | America del Nord
|
| Leader di mercato e profili aziendali chiave |
|
Densità degli operatori del mercato degli allineatori trasparenti: comprendere il suo impatto sulle dinamiche aziendali
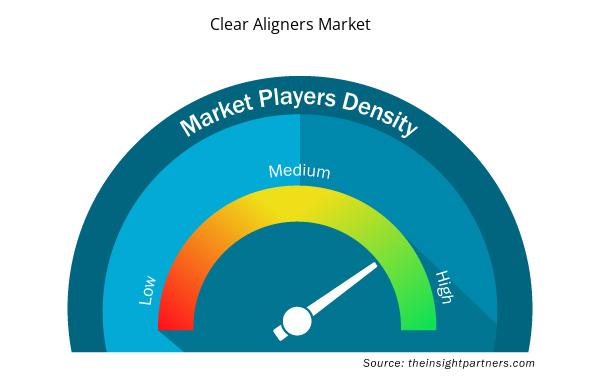
Il mercato degli allineatori trasparenti è in rapida crescita, trainato dalla crescente domanda degli utenti finali, dovuta a fattori quali l'evoluzione delle preferenze dei consumatori, i progressi tecnologici e una maggiore consapevolezza dei benefici del prodotto. Con l'aumento della domanda, le aziende stanno ampliando la propria offerta, innovando per soddisfare le esigenze dei consumatori e sfruttando le tendenze emergenti, alimentando ulteriormente la crescita del mercato.
La densità degli operatori di mercato si riferisce alla distribuzione delle imprese che operano in un determinato mercato o settore. Indica quanti concorrenti (operatori di mercato) sono presenti in un determinato spazio di mercato in relazione alle sue dimensioni o al suo valore totale.
Le principali aziende che operano nel mercato degli allineatori trasparenti sono:
- Align Technology Inc.
- Dentsply Sirona
- Danaher
- Istituto Straumann AG
- 3M
- Henry Schein Inc.
Disclaimer : le aziende elencate sopra non sono classificate secondo alcun ordine particolare.

- Ottieni una panoramica dei principali attori del mercato degli allineatori trasparenti
Notizie e sviluppi recenti sul mercato degli allineatori trasparenti
Il mercato degli allineatori trasparenti viene valutato raccogliendo dati qualitativi e quantitativi a seguito di ricerche primarie e secondarie, che includono importanti pubblicazioni aziendali, dati di associazioni e database. Di seguito sono riportati alcuni dei principali sviluppi osservati nel mercato degli allineatori trasparenti:
- Henry Schein UK ha lanciato Smilers e Smilers Expert, soluzioni di allineatori gemelli rivolte a odontoiatri generici e ortodontisti. Secondo Henry Schein, i prodotti offrono un trattamento personalizzabile per le malocclusioni, consentendo agli odontoiatri di offrire cure ortodontiche di alta qualità. (Fonte Henry Schein UK, febbraio 2025)
- Align Technology, Inc. ha annunciato di aver ottenuto il marchio CE in Europa, ai sensi del Regolamento sui Dispositivi Medici (MDR 2017/745), per il sistema di espansione palatale Invisalign di Align. Il sistema di espansione palatale Invisalign ha completato la registrazione presso l'MHRA per il Regno Unito e i territori d'oltremare. (Fonte: Align Technology, Inc., comunicato stampa, novembre 2024)
Copertura e risultati del rapporto sul mercato degli allineatori trasparenti
Il rapporto "Dimensioni e previsioni del mercato degli allineatori trasparenti (2021-2031)" fornisce un'analisi dettagliata del mercato che copre le seguenti aree:
- Dimensioni e previsioni del mercato degli allineatori trasparenti a livello globale, regionale e nazionale per tutti i principali segmenti di mercato coperti dall'ambito
- Tendenze del mercato degli allineatori trasparenti, nonché dinamiche di mercato come fattori trainanti, limitazioni e opportunità chiave
- Analisi PEST e SWOT dettagliate
- Analisi del mercato degli allineatori trasparenti che copre le principali tendenze del mercato, il quadro globale e regionale, i principali attori, le normative e i recenti sviluppi del mercato
- Analisi del panorama industriale e della concorrenza che copre la concentrazione del mercato, l'analisi della mappa termica, i principali attori e gli sviluppi recenti per il mercato degli allineatori trasparenti
- Profili aziendali dettagliati
- Analisi storica (2 anni), anno base, previsione (7 anni) con CAGR
- Analisi PEST e SWOT
- Valore/volume delle dimensioni del mercato - Globale, regionale, nazionale
- Industria e panorama competitivo
- Set di dati Excel


Report Coverage
Revenue forecast, Company Analysis, Industry landscape, Growth factors, and Trends

Segment Covered
This text is related
to segments covered.

Regional Scope
North America, Europe, Asia Pacific, Middle East & Africa, South & Central America

Country Scope
This text is related
to country scope.
Domande frequenti
North America dominated the market in 2024.
The rising incidence of dental disorders and increasing prevalence of malocclusions among children are significant factors fueling the market growth.
The clear aligners market value is expected to reach US$ 21,755.94 million by 2031.
The growing digitization of CAD/CAM technology is likely to emerge as a new growth trend in the market in the coming years.
Align Technology Inc., Dentsply Sirona, Danaher, Institut Straumann AG, 3M, Henry Schein Inc., TP Orthodontics Inc., DynaFlex, Great Lakes Dental Technologies, and SCHEU DENTAL GmbH are among the key players operating in the market.
The market is expected to register a CAGR of 18.8% during 2024–2031.
Trends and growth analysis reports related to Life Sciences : READ MORE..
The List of Companies - Clear Aligners Market
- Align Technology Inc.
- Dentsply Sirona
- Danaher
- Institut Straumann AG
- 3M
- Henry Schein Inc.
- TP Orthodontics Inc.
- DynaFlex
- Great Lakes Dental Technologies
- SCHEU DENTAL GmbH
The Insight Partners performs research in 4 major stages: Data Collection & Secondary Research, Primary Research, Data Analysis and Data Triangulation & Final Review.
- Data Collection and Secondary Research:
As a market research and consulting firm operating from a decade, we have published and advised several client across the globe. First step for any study will start with an assessment of currently available data and insights from existing reports. Further, historical and current market information is collected from Investor Presentations, Annual Reports, SEC Filings, etc., and other information related to company’s performance and market positioning are gathered from Paid Databases (Factiva, Hoovers, and Reuters) and various other publications available in public domain.
Several associations trade associates, technical forums, institutes, societies and organization are accessed to gain technical as well as market related insights through their publications such as research papers, blogs and press releases related to the studies are referred to get cues about the market. Further, white papers, journals, magazines, and other news articles published in last 3 years are scrutinized and analyzed to understand the current market trends.
- Primary Research:
The primarily interview analysis comprise of data obtained from industry participants interview and answers to survey questions gathered by in-house primary team.
For primary research, interviews are conducted with industry experts/CEOs/Marketing Managers/VPs/Subject Matter Experts from both demand and supply side to get a 360-degree view of the market. The primary team conducts several interviews based on the complexity of the markets to understand the various market trends and dynamics which makes research more credible and precise.
A typical research interview fulfils the following functions:
- Provides first-hand information on the market size, market trends, growth trends, competitive landscape, and outlook
- Validates and strengthens in-house secondary research findings
- Develops the analysis team’s expertise and market understanding
Primary research involves email interactions and telephone interviews for each market, category, segment, and sub-segment across geographies. The participants who typically take part in such a process include, but are not limited to:
- Industry participants: VPs, business development managers, market intelligence managers and national sales managers
- Outside experts: Valuation experts, research analysts and key opinion leaders specializing in the electronics and semiconductor industry.
Below is the breakup of our primary respondents by company, designation, and region:

Once we receive the confirmation from primary research sources or primary respondents, we finalize the base year market estimation and forecast the data as per the macroeconomic and microeconomic factors assessed during data collection.
- Data Analysis:
Once data is validated through both secondary as well as primary respondents, we finalize the market estimations by hypothesis formulation and factor analysis at regional and country level.
- Macro-Economic Factor Analysis:
We analyse macroeconomic indicators such the gross domestic product (GDP), increase in the demand for goods and services across industries, technological advancement, regional economic growth, governmental policies, the influence of COVID-19, PEST analysis, and other aspects. This analysis aids in setting benchmarks for various nations/regions and approximating market splits. Additionally, the general trend of the aforementioned components aid in determining the market's development possibilities.
- Country Level Data:
Various factors that are especially aligned to the country are taken into account to determine the market size for a certain area and country, including the presence of vendors, such as headquarters and offices, the country's GDP, demand patterns, and industry growth. To comprehend the market dynamics for the nation, a number of growth variables, inhibitors, application areas, and current market trends are researched. The aforementioned elements aid in determining the country's overall market's growth potential.
- Company Profile:
The “Table of Contents” is formulated by listing and analyzing more than 25 - 30 companies operating in the market ecosystem across geographies. However, we profile only 10 companies as a standard practice in our syndicate reports. These 10 companies comprise leading, emerging, and regional players. Nonetheless, our analysis is not restricted to the 10 listed companies, we also analyze other companies present in the market to develop a holistic view and understand the prevailing trends. The “Company Profiles” section in the report covers key facts, business description, products & services, financial information, SWOT analysis, and key developments. The financial information presented is extracted from the annual reports and official documents of the publicly listed companies. Upon collecting the information for the sections of respective companies, we verify them via various primary sources and then compile the data in respective company profiles. The company level information helps us in deriving the base number as well as in forecasting the market size.
- Developing Base Number:
Aggregation of sales statistics (2020-2022) and macro-economic factor, and other secondary and primary research insights are utilized to arrive at base number and related market shares for 2022. The data gaps are identified in this step and relevant market data is analyzed, collected from paid primary interviews or databases. On finalizing the base year market size, forecasts are developed on the basis of macro-economic, industry and market growth factors and company level analysis.
- Data Triangulation and Final Review:
The market findings and base year market size calculations are validated from supply as well as demand side. Demand side validations are based on macro-economic factor analysis and benchmarks for respective regions and countries. In case of supply side validations, revenues of major companies are estimated (in case not available) based on industry benchmark, approximate number of employees, product portfolio, and primary interviews revenues are gathered. Further revenue from target product/service segment is assessed to avoid overshooting of market statistics. In case of heavy deviations between supply and demand side values, all thes steps are repeated to achieve synchronization.
We follow an iterative model, wherein we share our research findings with Subject Matter Experts (SME’s) and Key Opinion Leaders (KOLs) until consensus view of the market is not formulated – this model negates any drastic deviation in the opinions of experts. Only validated and universally acceptable research findings are quoted in our reports.
We have important check points that we use to validate our research findings – which we call – data triangulation, where we validate the information, we generate from secondary sources with primary interviews and then we re-validate with our internal data bases and Subject matter experts. This comprehensive model enables us to deliver high quality, reliable data in shortest possible time.

 Ottieni un campione gratuito per questo repot