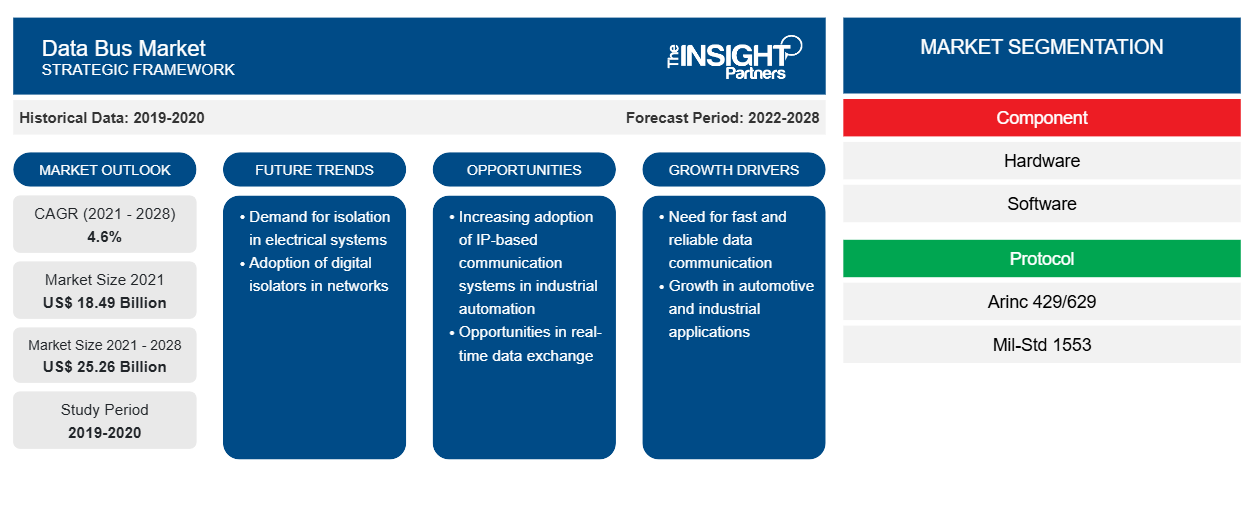
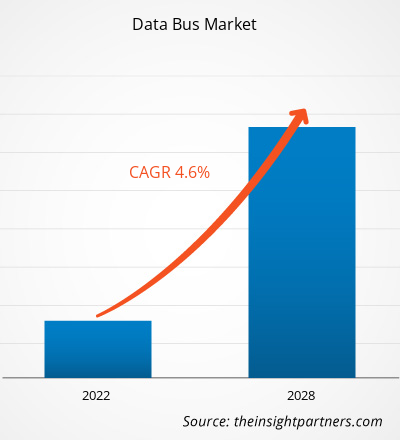
Si prevede che il mercato dei bus dati crescerà da 18.488,9 milioni di dollari nel 2021 a 25.258,0 milioni di dollari entro il 2028; si stima che crescerà a un CAGR del 4,6% nel periodo 2021-2028.
Il termine "bus dati" si riferisce a un percorso interno costruito per la trasmissione dati tra processori o memoria. Nel corso degli anni, numerosi tipi di bus dati si sono evoluti per adattarsi a vari dispositivi hardware come unità di archiviazione dati e processori. Si sono evoluti diversi tipi di sistemi di bus dati in personal computer e altri hardware. I sistemi di bus dati sono utilizzati in varie applicazioni, tra cui applicazioni marine, automobilistiche, di aviazione commerciale e militari. La continua modernizzazione degli aerei militari può ridurre le possibilità di incidenti derivanti da errori introdotti dai piloti, migliorare le capacità di missione e aumentare la comprensione delle circostanze. La crescita del mercato dei bus dati è attribuita all'aumento degli ordini di autovetture, all'aumento del numero di consegne di aeromobili, all'aggiornamento dei programmi navali e aviotrasportati e alla necessità di ridurre le specifiche di scambio. La durata media di un bus dati varia da 35 a 45 anni e, dopo tale periodo, i sistemi necessitano di un aggiornamento. La lunga durata ostacola la crescita del mercato dei bus dati poiché riduce le possibilità di sostituire i sistemi attualmente in uso con quelli nuovi.
Personalizza questo report in base alle tue esigenze
Riceverai la personalizzazione gratuita di qualsiasi report, comprese parti di questo report, o analisi a livello nazionale, pacchetto dati Excel, oltre a usufruire di grandi offerte e sconti per start-up e università
- Scopri le principali tendenze di mercato in questo rapporto.Questo campione GRATUITO includerà analisi di dati che spaziano dalle tendenze di mercato alle stime e alle previsioni.
Impatto della pandemia di COVID-19 sul mercato dei bus dati
L'epidemia di COVID-19 ha avuto un impatto significativo sul mondo e continua a sconvolgere diversi paesi. Fino allo scoppio del COVID-19, l'industria aerospaziale stava sperimentando una crescita sostanziale in termini di produzione, nonostante gli enormi arretrati dei produttori di aeromobili. L'industria aeronautica globale ha assistito a un aumento significativo del numero di passeggeri e a un aumento degli acquisti di aeromobili.
Sfortunatamente, l'epidemia di COVID-19 ha decimato la domanda di aeromobili a livello globale, il che ha riflesso volumi di ordini significativamente inferiori tra i produttori di aeromobili, il che ha comportato un numero inferiore di produzioni. Il calo dei volumi di produzione ha influenzato negativamente le attività di vari produttori di componenti e le tecnologie associate. Pertanto, le attività degli operatori del mercato Data Bus sono state gravemente colpite dalla destabilizzazione nella produzione di aeromobili.
Secondo l'Electronic Components Industry Association (ECIA), l'emergere del COVID-19 ha evidenziato ritardi nei rilasci di prodotti, interruzioni negli eventi della catena di fornitura e altre attività industriali. Diversi produttori hanno temporaneamente interrotto le unità di produzione, a causa della minore domanda di prodotti a seguito di misure di blocco e risorse di produzione limitate. Inoltre, i produttori di vari prodotti elettronici e semiconduttori, compresi i cavi dati, hanno riscontrato un ritardo sostanziale nei tempi di consegna, il che ha indebolito la catena di fornitura. Ciò ha avuto un impatto negativo sul mercato dei bus dati.
Durante la pandemia, l'intero mercato dei bus dati si è fermato con risorse minime per prevedere il futuro. Diverse unità di produzione negli Stati Uniti, in Francia, in Russia e in Cina sono state temporaneamente fermate per rispettare le regole governative in materia di lockdown e distanziamento fisico. I produttori di aeromobili hanno assistito a una riduzione del fatturato del mercato dell'aviazione generale del 14-15%. Ciò ha comportato un calo del fatturato del mercato dei bus dati.
Approfondimenti sul mercato dei bus dati
Modernizzazione in corso nell'aviazione militare
L'aumento della spesa militare nelle economie emergenti sta guidando gli investimenti nella modernizzazione delle attrezzature esistenti negli aeromobili obsoleti. A causa di problemi tecnici con varie costruzioni e problemi con la propulsione, la connessione e altri sistemi, c'è una crescente domanda di aeromobili militari tecnologicamente superiori per sostituire gli aeromobili militari convenzionali. Per affrontare il numero in continuo aumento di minacce e requisiti di missione completamente nuovi. Le compagnie aeree completamente connesse, a terra e in aria, possono utilizzare dati in tempo reale per migliorare le operazioni in cabina di pilotaggio, ridurre le tempistiche future e migliorare l'esperienza del cliente. Pertanto, molti produttori di aeromobili hanno aggiornato i loro aeromobili per includere capacità di rete che forniscono connettività in volo, il che ha spinto la domanda di bus dati. L'espansione del settore aerospaziale e militare è ulteriormente probabile che stimoli la crescita del mercato globale nei prossimi anni. L'adozione di protocolli FlexRay e tattiche di crescita organiche e inorganiche nell'aviazione militare dovrebbe stimolare la crescita del mercato globale dei bus dati. L'espansione del mercato globale dei bus dati è ulteriormente guidata da aeromobili commerciali e militari. Anche la necessità di integrazione di sistemi di commutazione Ethernet full-duplex, sistemi di monitoraggio, sistemi di cabina di pilotaggio, sistemi di controllo del volo, sistemi di navigazione, sistemi di dati aerei, sistemi di comunicazione e sistemi di manutenzione centrale in singoli sistemi avionici modulari sta guidando il mercato dei bus dati.
Approfondimenti di mercato basati sui componenti
In base al componente, il Data Bus Market è segmentato in hardware e software. Il segmento hardware comprende inoltre cavi e connettori , assemblaggi/terminatori, accoppiatori di bus dati, schede/schede di interfaccia e altri.
Approfondimenti di mercato basati su protocolli
In base al protocollo, il Data Bus Market è segmentato come Arinc 429/629, Mil-Std 1553 e altri. Il protocollo è il linguaggio utilizzato su un bus dati aeronautico. I protocolli sono un insieme di regole e norme formali che regolano lo scambio di dati tra sistemi. Il protocollo specifica la trasmissione e la ricezione di dati su un bus. Sono inoltre regolati dal protocollo e dai suoi componenti di accompagnamento la prevenzione delle collisioni dei dati, l'integrità e la velocità del bus. Gli standard elettrici e fisici sono definiti tramite protocolli di basso livello. La formattazione dei dati, inclusa la sintassi e il formato dei messaggi, è gestita da protocolli di alto livello.
Gli operatori che operano nel Data Bus Market adottano strategie come fusioni, acquisizioni e iniziative di mercato per mantenere le loro posizioni sul mercato. Di seguito sono elencati alcuni sviluppi da parte degli operatori chiave:
- Nel 2021, Astronics Corporation ha annunciato il lancio di nuovi modelli di protocollo per la sua famiglia Ballard ME1000 di schede di interfaccia avioniche mPCIe per applicazioni aerospaziali integrate. I nuovi modelli forniscono capacità di interfacciamento per i protocolli databus ARINC 429 e ARINC 717 e si uniscono ai modelli per MIL-STD-1553 rilasciati in precedenza.
Approfondimenti regionali sul mercato dei bus dati
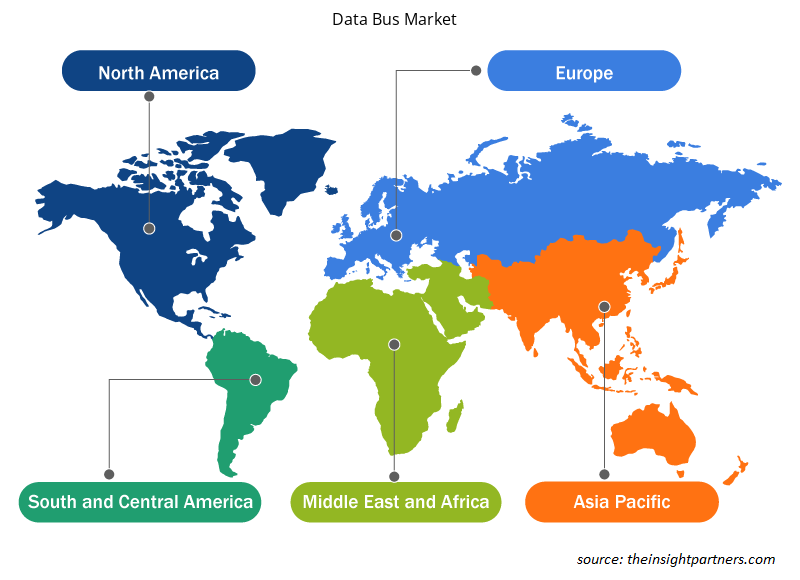
Le tendenze regionali e i fattori che influenzano il Data Bus Market durante il periodo di previsione sono stati ampiamente spiegati dagli analisti di Insight Partners. Questa sezione discute anche i segmenti e la geografia del Data Bus Market in Nord America, Europa, Asia Pacifico, Medio Oriente e Africa, e Sud e Centro America.

- Ottieni i dati specifici regionali per il mercato dei bus dati
Ambito del rapporto di mercato del bus dati
| Attributo del report | Dettagli |
|---|---|
| Dimensioni del mercato nel 2021 | 18,49 miliardi di dollari USA |
| Dimensioni del mercato entro il 2028 | 25,26 miliardi di dollari USA |
| CAGR globale (2021 - 2028) | 4,6% |
| Dati storici | 2019-2020 |
| Periodo di previsione | 2022-2028 |
| Segmenti coperti | Per componente
|
| Regioni e Paesi coperti | America del Nord
|
| Leader di mercato e profili aziendali chiave |
|
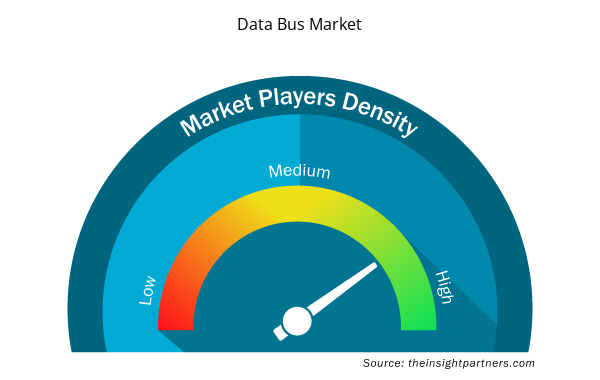
Densità degli attori del mercato: comprendere il suo impatto sulle dinamiche aziendali
Il mercato del Data Bus Market sta crescendo rapidamente, spinto dalla crescente domanda degli utenti finali dovuta a fattori quali l'evoluzione delle preferenze dei consumatori, i progressi tecnologici e una maggiore consapevolezza dei vantaggi del prodotto. Con l'aumento della domanda, le aziende stanno ampliando le loro offerte, innovando per soddisfare le esigenze dei consumatori e capitalizzando sulle tendenze emergenti, il che alimenta ulteriormente la crescita del mercato.
La densità degli operatori di mercato si riferisce alla distribuzione di aziende o società che operano in un particolare mercato o settore. Indica quanti concorrenti (operatori di mercato) sono presenti in un dato spazio di mercato in relazione alle sue dimensioni o al valore di mercato totale.
Le principali aziende che operano nel mercato dei bus dati sono:
- Società Astronica
- Azienda produttrice di componenti per auto
- Azienda aerospaziale Collins
- Società di dispositivi dati
- Prodotti di bus dati Corporation
Disclaimer : le aziende elencate sopra non sono classificate secondo un ordine particolare.

- Ottieni una panoramica dei principali attori del mercato Data Bus
Il mercato dei bus dati è stato segmentato e analizzato in base a componente, protocollo e applicazione. In base al componente, il mercato dei bus dati è ulteriormente segmentato in hardware e software. In termini di protocollo, il mercato dei bus dati è segmentato in ARINC 429/629, MIL–STD-1553 e altri. In base all'applicazione, il mercato dei bus dati è ulteriormente segmentato in automotive, marine, aviazione commerciale e aviazione militare.
Astronics Corporation, Collins Aerospace, Fujikura Ltd., HUBER+SUHNER, Nexans, TE Connectivity Corporation, Amphenol Ltd., Data Device Corporation, Data Bus Corporation e OCC sono i principali attori del mercato dei bus dati presi in considerazione per lo studio di ricerca. Inoltre, diversi altri importanti attori del mercato dei bus dati sono stati studiati e analizzati in questo rapporto di ricerca per ottenere una visione olistica del mercato globale dei bus dati e del suo ecosistema.
- Analisi storica (2 anni), anno base, previsione (7 anni) con CAGR
- Analisi PEST e SWOT
- Valore/volume delle dimensioni del mercato - Globale, regionale, nazionale
- Industria e panorama competitivo
- Set di dati Excel


Report Coverage
Revenue forecast, Company Analysis, Industry landscape, Growth factors, and Trends

Segment Covered
This text is related
to segments covered.

Regional Scope
North America, Europe, Asia Pacific, Middle East & Africa, South & Central America

Country Scope
This text is related
to country scope.
Domande frequenti
On the onboard bus, there is an upsurge in traffic. Remote terminals expect improved services from the onboard bus as they become more "intelligent." They expect to access the bus on demand to transfer data packets. Many current software architectures are built around messaging capabilities, in which programs communicate via variable-length messages generated asynchronously. Because of the growing "intelligence" of remote terminals, their expectations for more complete communication services, and the necessity to support increasingly sophisticated, multi-bus designs, higher-level protocols are being used more frequently on the onboard bus. This, in turn, may increase traffic volume, particularly asynchronous traffic, but it also emphasizes the necessity for the onboard bus to provide asymmetric medium access service. While asynchronous packet traffic on spacecraft buses has been steadily increasing, the number of basic sensors and actuators that must be serviced through the bus has remained constant. In reality, there is strong evidence that such low-cost gadgets are increasing. The MIL-STD-1553B command and control bus is the most frequent aboard a spacecraft, and the additions in ECSS-E-ST-50-13C cover it for future European space use. However, as processing power grows and sub-systems become more complex, there is a growing demand for data networks that meet MIL-STD-1553B requirements while also being compatible with the miniaturized low-power devices they connect. Pin counts, connector sizes, and harness bulk can all be reduced in this way. The awareness that the building block method demands standardization above the basic bus protocols goes hand in hand with the requirement to improve connectivity. Future data system innovations include, among other things, the adoption of the CAN bus as a complement to MIL-STD-1553B, the creation and usage of higher-layer protocols, and the standardization of digital sensor buses as the most efficient means to decrease harness and integration costs.
North America is expected to hold the largest share of the Data Bus Market in the coming years as it includes a few of the world's fastest growing and leading economies. The North American Data Bus Market is segmented into the US, Canada, and Mexico. The growth of the Data Bus Market in North America can be attributed to the flourishing electric vehicles (EV) industry, in line with the increasing number of environmental regulations and green initiatives.
Based on Protocol, the Data Bus Market is segmented as Arinc 429/629, Mil-Std 1553, and others. The protocol is the language that is utilized on an aviation data bus. Protocols are a set of formal rules and norms that regulate data exchange between systems. The protocol specifies the transmission and receipt of data on a bus. Also governed by protocol and its accompanying components are data collision prevention, integrity, and bus speed. The electrical and physical standards are defined via low-level protocols. Data formatting, including message syntax and format, is dealt with by high-level protocols. The Mil-Std 1553 segment led the Data Bus Market with a market share of 47.5% in 2020. It is expected to account for 47.8% of the total market in 2028.
The hardware segment led the Data Bus Market with a market share of 65.9% in 2020. It is expected to account for 62.2% of the total market in 2028. The hardware segment for data bus further comprises of cables and connectors, assemblies/terminators, data bus couplers, interface cards/boards, and others.
The data bus systems are used in various applications, including marine, automotive, commercial aviation, and military applications. The continuous modernization of military aircraft can decrease the possibilities of mishaps resulting due to errors introduced by pilots, enhance mission capacities, and increase comprehension of circumstances. The growth of the Data Bus Market is attributed to the increase in passenger car orders, rise in the number of aircraft deliveries, upgrading of naval and airborne programs, and a need to decrease swap specifications. The average life of a data bus ranges from 35 to 45 years, and after that, the systems need an upgrade. The long life hampers the growth of the Data Bus Market as it reduces the chances of replacing the systems that are currently in use with the new ones.
The demand for new military aircraft is increasing as countries attempt to update their fleets and expand their capabilities, especially in Asia-Pacific. The Australian Army received the first two of four new Boeing CH-47F Chinook transport helicopters in July 2021. The contract is worth USD 441 million and would add 14 CH-47F heavy-lift helicopters to the Army's fleet. The third and fourth helicopters are expected to arrive in mid-2022. The Royal Australian Air Force (RAAF) has placed another order for 2 P-8As, bringing the total number of P-8As under contract to 14. The P-8As are land-based antisubmarine and anti-surface ship planes built for intelligence, surveillance, and reconnaissance missions. Further, Indian government authorized the proposal for procuring 56 C295 transport aircraft from Airbus Defence and Space, Spain, in September 2021; Airbus Defence and Space, Spain has been awarded a contract for Rs 22,000 crore for the acquisition of the C 295MW cargo aircraft. 14 of the planes will be produced in Spain, with the remainder 40 being built in India as part of a joint venture between Airbus and Tata Group. In the last five years, China has added numerous new military aircraft to its inventory. As a result of these purchases, the demand for data bus is increasing in Asia Pacific as most new aircraft units are built upon data bus protocols.
Trends and growth analysis reports related to Electronics and Semiconductor : READ MORE..
The List of Companies - Data Bus Market
- Astronics Corporation
- Amphenol Ltd.
- Collins Aerospace
- Data Device Corporation
- Data Bus Products Corporation
- Fujikura Ltd.
- HUBER+SUHNER
- Nexans
- TE Connectivity
- OCC
The Insight Partners performs research in 4 major stages: Data Collection & Secondary Research, Primary Research, Data Analysis and Data Triangulation & Final Review.
- Data Collection and Secondary Research:
As a market research and consulting firm operating from a decade, we have published and advised several client across the globe. First step for any study will start with an assessment of currently available data and insights from existing reports. Further, historical and current market information is collected from Investor Presentations, Annual Reports, SEC Filings, etc., and other information related to company’s performance and market positioning are gathered from Paid Databases (Factiva, Hoovers, and Reuters) and various other publications available in public domain.
Several associations trade associates, technical forums, institutes, societies and organization are accessed to gain technical as well as market related insights through their publications such as research papers, blogs and press releases related to the studies are referred to get cues about the market. Further, white papers, journals, magazines, and other news articles published in last 3 years are scrutinized and analyzed to understand the current market trends.
- Primary Research:
The primarily interview analysis comprise of data obtained from industry participants interview and answers to survey questions gathered by in-house primary team.
For primary research, interviews are conducted with industry experts/CEOs/Marketing Managers/VPs/Subject Matter Experts from both demand and supply side to get a 360-degree view of the market. The primary team conducts several interviews based on the complexity of the markets to understand the various market trends and dynamics which makes research more credible and precise.
A typical research interview fulfils the following functions:
- Provides first-hand information on the market size, market trends, growth trends, competitive landscape, and outlook
- Validates and strengthens in-house secondary research findings
- Develops the analysis team’s expertise and market understanding
Primary research involves email interactions and telephone interviews for each market, category, segment, and sub-segment across geographies. The participants who typically take part in such a process include, but are not limited to:
- Industry participants: VPs, business development managers, market intelligence managers and national sales managers
- Outside experts: Valuation experts, research analysts and key opinion leaders specializing in the electronics and semiconductor industry.
Below is the breakup of our primary respondents by company, designation, and region:

Once we receive the confirmation from primary research sources or primary respondents, we finalize the base year market estimation and forecast the data as per the macroeconomic and microeconomic factors assessed during data collection.
- Data Analysis:
Once data is validated through both secondary as well as primary respondents, we finalize the market estimations by hypothesis formulation and factor analysis at regional and country level.
- Macro-Economic Factor Analysis:
We analyse macroeconomic indicators such the gross domestic product (GDP), increase in the demand for goods and services across industries, technological advancement, regional economic growth, governmental policies, the influence of COVID-19, PEST analysis, and other aspects. This analysis aids in setting benchmarks for various nations/regions and approximating market splits. Additionally, the general trend of the aforementioned components aid in determining the market's development possibilities.
- Country Level Data:
Various factors that are especially aligned to the country are taken into account to determine the market size for a certain area and country, including the presence of vendors, such as headquarters and offices, the country's GDP, demand patterns, and industry growth. To comprehend the market dynamics for the nation, a number of growth variables, inhibitors, application areas, and current market trends are researched. The aforementioned elements aid in determining the country's overall market's growth potential.
- Company Profile:
The “Table of Contents” is formulated by listing and analyzing more than 25 - 30 companies operating in the market ecosystem across geographies. However, we profile only 10 companies as a standard practice in our syndicate reports. These 10 companies comprise leading, emerging, and regional players. Nonetheless, our analysis is not restricted to the 10 listed companies, we also analyze other companies present in the market to develop a holistic view and understand the prevailing trends. The “Company Profiles” section in the report covers key facts, business description, products & services, financial information, SWOT analysis, and key developments. The financial information presented is extracted from the annual reports and official documents of the publicly listed companies. Upon collecting the information for the sections of respective companies, we verify them via various primary sources and then compile the data in respective company profiles. The company level information helps us in deriving the base number as well as in forecasting the market size.
- Developing Base Number:
Aggregation of sales statistics (2020-2022) and macro-economic factor, and other secondary and primary research insights are utilized to arrive at base number and related market shares for 2022. The data gaps are identified in this step and relevant market data is analyzed, collected from paid primary interviews or databases. On finalizing the base year market size, forecasts are developed on the basis of macro-economic, industry and market growth factors and company level analysis.
- Data Triangulation and Final Review:
The market findings and base year market size calculations are validated from supply as well as demand side. Demand side validations are based on macro-economic factor analysis and benchmarks for respective regions and countries. In case of supply side validations, revenues of major companies are estimated (in case not available) based on industry benchmark, approximate number of employees, product portfolio, and primary interviews revenues are gathered. Further revenue from target product/service segment is assessed to avoid overshooting of market statistics. In case of heavy deviations between supply and demand side values, all thes steps are repeated to achieve synchronization.
We follow an iterative model, wherein we share our research findings with Subject Matter Experts (SME’s) and Key Opinion Leaders (KOLs) until consensus view of the market is not formulated – this model negates any drastic deviation in the opinions of experts. Only validated and universally acceptable research findings are quoted in our reports.
We have important check points that we use to validate our research findings – which we call – data triangulation, where we validate the information, we generate from secondary sources with primary interviews and then we re-validate with our internal data bases and Subject matter experts. This comprehensive model enables us to deliver high quality, reliable data in shortest possible time.


 Ottieni un campione gratuito per questo repot