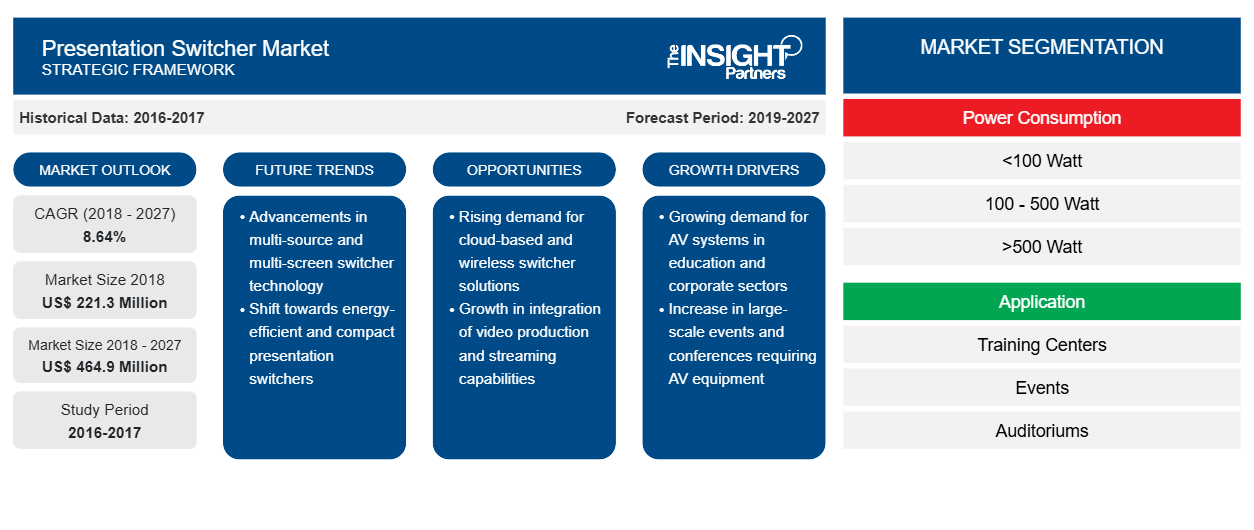
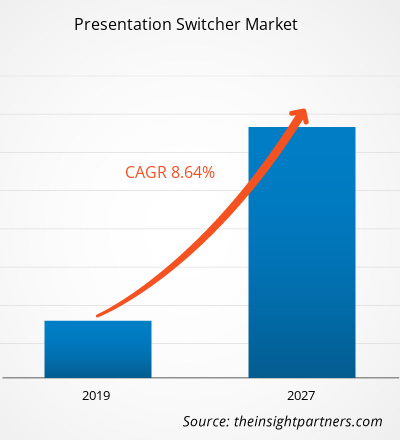
Nel 2018 il mercato dei commutatori di presentazione valeva 221,3 milioni di dollari USA; si prevede che crescerà a un CAGR dell'8,64% durante il periodo di previsione, per raggiungere i 464,9 milioni di dollari USA entro il 2027.
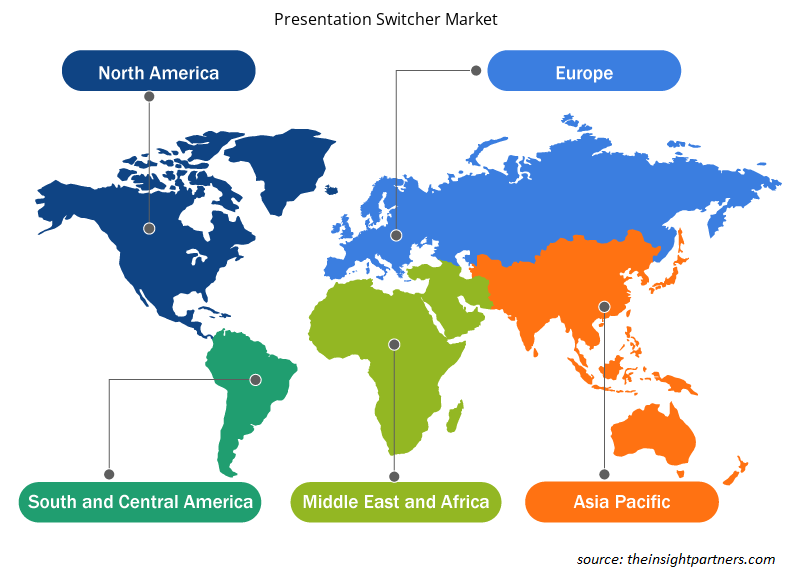
L'Asia Pacifica contribuisce con la quota più alta di questo mercato, seguita dall'Europa e poi dal Nord America. L'Asia Pacifica guida il mercato dei commutatori di presentazione, a causa della crescita del settore degli eventi nella regione APAC, i venditori sono alla ricerca di attrezzature appropriate per i loro programmi di eventi. Oggigiorno, con i crescenti investimenti nei centri di formazione, eventi, stadi e arene e lo sviluppo di tecnologia e dati, le aziende sono fortemente concentrate sull'adozione di un commutatore di presentazione per fornire effetti audio e video avanzati. Inoltre, si stima che l'APAC guadagnerà una quota significativa di fatturato nel mercato totale come risultato di un'economia in crescita e di iniziative di digitalizzazione in aumento nella regione.
Personalizza questo report in base alle tue esigenze
Riceverai la personalizzazione gratuita di qualsiasi report, comprese parti di questo report, o analisi a livello nazionale, pacchetto dati Excel, oltre a usufruire di grandi offerte e sconti per start-up e università
Mercato dei commutatori di presentazione: approfondimenti strategici
- Scopri le principali tendenze di mercato in questo rapporto.Questo campione GRATUITO includerà analisi di dati che spaziano dalle tendenze di mercato alle stime e alle previsioni.
Approfondimenti di mercato
Il crescente numero di stadi e arene in tutto il mondo sta rafforzando la domanda di mercato per i commutatori di presentazione
Il numero di stadi sta aumentando a livello globale poiché l'industria sportiva sta accentuando in termini di numero di eventi. Il crescente numero di stadi e arene in tutto il mondo sta promuovendo il mercato degli switcher di presentazione poiché ogni stadio e arena sta cercando tecnologie di trasmissione efficienti. Gli switcher di presentazione offrono più ingressi e uscite tramite un singolo dispositivo. La trasmissione in diretta di eventi sportivi comporta la trasmissione a lungo raggio di segnali per un facile accesso a spettatori distanti e gli switcher di presentazione svolgono un ruolo importante nelle tecnologie di trasmissione convenzionali. Pertanto, l'aumento mondiale del numero di stadi e arene sta rafforzando il mercato degli switcher di presentazione.
La crescente consapevolezza relativa al commutatore di presentazione nei paesi in via di sviluppo offre un'opportunità prospera al mercato del commutatore di presentazione
Il mercato dei commutatori di presentazione è maturato nei paesi sviluppati del Nord America, Europa e Asia-Pacifico. Tuttavia, diversi paesi in via di sviluppo nell'Asia-Pacifico, Medio Oriente, Africa e Sud America stanno acquisendo consapevolezza in relazione alla tecnologia dei commutatori di presentazione. Questo fattore è un'opportunità chiave per i player del mercato dei commutatori di presentazione di espandere la loro presenza globale e migliorare i loro ricavi annuali anno dopo anno.
Informazioni sul consumo energetico
Il mercato globale degli switcher di presentazione in base al consumo energetico è suddiviso in <100 Watt, 100-500 Watt e >500 Watt. Si stima che il segmento <100 Watt dominerà il mercato degli switcher di presentazione nel 2018, mentre l'implementazione 101-500 Watt sta crescendo al CAGR più elevato. Si prevede che la domanda di switcher di presentazione con consumo energetico di 100-500 Watt salirà vertiginosamente nei prossimi anni a causa della crescente necessità di switcher di presentazione negli stadi e nelle arene. Diversi paesi stanno investendo ingenti somme nell'espansione degli stadi sportivi, il che dovrebbe catalizzare la domanda di switcher di presentazione da 100-500 Watt.
Approfondimenti sulle applicazioni
Il mercato globale dei commutatori di presentazione per applicazione è segmentato in centri di formazione, eventi, auditorium, stadi e arene, musei e planetari e altri. Si prevede che il segmento dei centri di formazione dominerà il mercato dei commutatori di presentazione per tutto il periodo di previsione. I centri che coinvolgono la formazione in aula includono VCR (ad esempio, videoregistratori a cassette), PC legacy basati su VGA (ad esempio, basati su array di grafica video), PC dotati di HDMI (ad esempio, dotati di interfaccia multimediale ad alta definizione), iPad e lavagne interattive, che devono essere integrati a un prezzo basso. Inoltre, le sale conferenze sono costruite per soddisfare un'ampia varietà di relatori in tutto il mondo.
Si prevede che la crescita delle attività di ricerca e sviluppo da parte dei venditori di commutatori di presentazione per l'introduzione di tecnologie future contribuirà anche al mercato globale dei commutatori di presentazione nei prossimi anni. Di seguito sono elencati alcuni degli sviluppi recenti:
2019: Atlona ha iniziato a spedire il commutatore di presentazione a matrice 6×2 come parte delle nuove offerte strategiche della sua serie Omega in rapida crescita.
2018: Analog Way ha annunciato il suo nuovo accordo di distribuzione con LANG BARANDAY AG per la Svizzera.
2017: Presentation Switchers Inc. ha rilasciato PS105, il primo della sua serie AV+IoT di commutatori di presentazione digitali compatti destinati alla collaborazione e ai piccoli spazi delle sale conferenze.
Informazioni regionali sul mercato di Presentation Switcher
Le tendenze regionali e i fattori che influenzano il mercato dei Presentation Switcher durante il periodo di previsione sono stati ampiamente spiegati dagli analisti di Insight Partners. Questa sezione discute anche i segmenti e la geografia del mercato dei Presentation Switcher in Nord America, Europa, Asia Pacifico, Medio Oriente e Africa e America meridionale e centrale.
- Ottieni i dati specifici regionali per il mercato dei commutatori di presentazione
Ambito del rapporto di mercato di Presentation Switcher
| Attributo del report | Dettagli |
|---|---|
| Dimensioni del mercato nel 2018 | 221,3 milioni di dollari USA |
| Dimensioni del mercato entro il 2027 | 464,9 milioni di dollari USA |
| CAGR globale (2018 - 2027) | 8,64% |
| Dati storici | 2016-2017 |
| Periodo di previsione | 2019-2027 |
| Segmenti coperti | Per consumo energetico
|
| Regioni e Paesi coperti | America del Nord
|
| Leader di mercato e profili aziendali chiave |
|
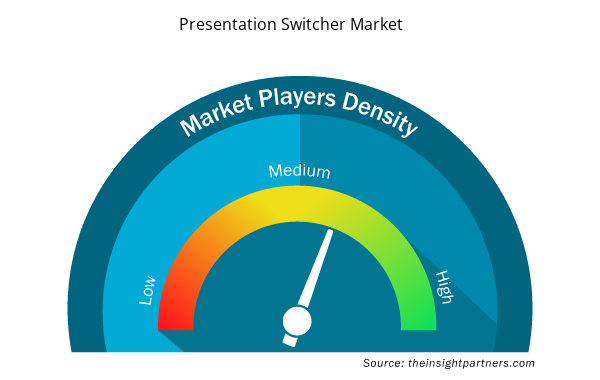
Densità degli attori del mercato: comprendere il suo impatto sulle dinamiche aziendali
Il mercato dei Presentation Switcher Market sta crescendo rapidamente, spinto dalla crescente domanda degli utenti finali dovuta a fattori quali l'evoluzione delle preferenze dei consumatori, i progressi tecnologici e una maggiore consapevolezza dei vantaggi del prodotto. Con l'aumento della domanda, le aziende stanno ampliando le loro offerte, innovando per soddisfare le esigenze dei consumatori e capitalizzando sulle tendenze emergenti, il che alimenta ulteriormente la crescita del mercato.
La densità degli operatori di mercato si riferisce alla distribuzione di aziende o società che operano in un particolare mercato o settore. Indica quanti concorrenti (operatori di mercato) sono presenti in un dato spazio di mercato in relazione alle sue dimensioni o al valore di mercato totale.
Le principali aziende che operano nel mercato dei Presentation Switcher sono:
- Atlona Inc. (Panduit)
- Modo analogico SAS
- Barco NV
- Crestron Electronics, Inc.
- Christie Digital Systems, Inc.
Disclaimer : le aziende elencate sopra non sono classificate secondo un ordine particolare.
- Ottieni la panoramica dei principali attori del mercato Presentation Switcher
GLOBAL PRESENTATION SWITCHER – SEGMENTAZIONE DEL MERCATO
Per consumo energetico
- <100 Watt
- 100 – 500 Watt
- >500 Watt
Per applicazione
- Centro di formazione
- Eventi
- Auditorium
- Stadi e arene
- Musei e Planetari
- Altri
Per Geografia
America del Nord
- NOI
- Canada
- Messico
Europa
- Francia
- Germania
- Regno Unito
- Italia
- Russia
- Resto d'Europa
Asia Pacifico (APAC)
- Australia
- Cina
- India
- Giappone
- Corea del Sud
- Resto dell'APAC
Medio Oriente e Africa (MEA)
- Arabia Saudita
- Sudafrica
- Emirati Arabi Uniti
- Resto del MEA
America del Sud (SAM)
- Brasile
- Resto del SAM
Profili aziendali
- Atlona Inc. (Panduit)
- Modo analogico SAS
- Barco NV
- Crestron Electronics, Inc.
- Christie Digital Systems, Inc.
- Società anonima CYP (UK) Ltd.
- Società a responsabilità limitata
- Industrie internazionali Harman
- LogicaAV
- Commutatori di presentazione, Inc.
Altri attori del mercato della catena del valore:
Kramer Electronics Ltd., Extron, ATEN, DVIGear, Inc. e Black Box Corporation sono alcuni degli altri attori del mercato della filiera che non sono descritti nel rapporto, ma che possono essere inclusi su richiesta.
- Analisi storica (2 anni), anno base, previsione (7 anni) con CAGR
- Analisi PEST e SWOT
- Valore/volume delle dimensioni del mercato - Globale, regionale, nazionale
- Industria e panorama competitivo
- Set di dati Excel

Report Coverage
Revenue forecast, Company Analysis, Industry landscape, Growth factors, and Trends

Segment Covered
This text is related
to segments covered.

Regional Scope
North America, Europe, Asia Pacific, Middle East & Africa, South & Central America

Country Scope
This text is related
to country scope.
Domande frequenti
The presentation switchers consuming <100 Watt are the most attractive presentation switchers across end-used worldwide. The <100 Watt presentation switchers are used in larger spaces, including training centers, events, auditoriums, stadium and arenas, and museums and planetariums. The demand for less power consumption appliances is strongly growing among the end-users, and owing to this, the demand for <100 Watt presentation switchers is expected to remain high throughout the forecast period.
The awareness related to presentation switcher has matured in developed countries and in a few developing nations. However, the consciousness about the benefits of presentation switcher is growing among various other developing countries including, Australia, Singapore, Malaysia, Thailand, Taiwan, UAE, Qatar, Saudi Arabia, South Africa, and Brazil, which is expected to catalyze the market revenue size of presentation switcher market in the future.
Asia-Pacific is the fastest-growing region in various technologies. The region witnessed significant growth in the commercial sector and the industrial sector. The growth in the sectors mentioned above is playing a crucial role in propelling the presentation switcher market.
Continuous rise in the number of auditoriums and training centers in different countries in Asia-Pacific has positively impacted on the growth of the presentation switcher market, and increase in live events, and construction or up-gradation of stadiums across the region is expected to create lucrative business opportunities for presentation switcher market players.
Trends and growth analysis reports related to Electronics and Semiconductor : READ MORE..
The List of Companies
- Atlona Inc. (Panduit)
- Analog Way SAS
- Barco NV
- Crestron Electronics, Inc.
- Christie Digital Systems, Inc.
- CYP (UK) Ltd.
- FSR, Inc.
- Harman International Industries
- LogicAV
- Presentation Switchers, Inc.
The Insight Partners performs research in 4 major stages: Data Collection & Secondary Research, Primary Research, Data Analysis and Data Triangulation & Final Review.
- Data Collection and Secondary Research:
As a market research and consulting firm operating from a decade, we have published and advised several client across the globe. First step for any study will start with an assessment of currently available data and insights from existing reports. Further, historical and current market information is collected from Investor Presentations, Annual Reports, SEC Filings, etc., and other information related to company’s performance and market positioning are gathered from Paid Databases (Factiva, Hoovers, and Reuters) and various other publications available in public domain.
Several associations trade associates, technical forums, institutes, societies and organization are accessed to gain technical as well as market related insights through their publications such as research papers, blogs and press releases related to the studies are referred to get cues about the market. Further, white papers, journals, magazines, and other news articles published in last 3 years are scrutinized and analyzed to understand the current market trends.
- Primary Research:
The primarily interview analysis comprise of data obtained from industry participants interview and answers to survey questions gathered by in-house primary team.
For primary research, interviews are conducted with industry experts/CEOs/Marketing Managers/VPs/Subject Matter Experts from both demand and supply side to get a 360-degree view of the market. The primary team conducts several interviews based on the complexity of the markets to understand the various market trends and dynamics which makes research more credible and precise.
A typical research interview fulfils the following functions:
- Provides first-hand information on the market size, market trends, growth trends, competitive landscape, and outlook
- Validates and strengthens in-house secondary research findings
- Develops the analysis team’s expertise and market understanding
Primary research involves email interactions and telephone interviews for each market, category, segment, and sub-segment across geographies. The participants who typically take part in such a process include, but are not limited to:
- Industry participants: VPs, business development managers, market intelligence managers and national sales managers
- Outside experts: Valuation experts, research analysts and key opinion leaders specializing in the electronics and semiconductor industry.
Below is the breakup of our primary respondents by company, designation, and region:

Once we receive the confirmation from primary research sources or primary respondents, we finalize the base year market estimation and forecast the data as per the macroeconomic and microeconomic factors assessed during data collection.
- Data Analysis:
Once data is validated through both secondary as well as primary respondents, we finalize the market estimations by hypothesis formulation and factor analysis at regional and country level.
- Macro-Economic Factor Analysis:
We analyse macroeconomic indicators such the gross domestic product (GDP), increase in the demand for goods and services across industries, technological advancement, regional economic growth, governmental policies, the influence of COVID-19, PEST analysis, and other aspects. This analysis aids in setting benchmarks for various nations/regions and approximating market splits. Additionally, the general trend of the aforementioned components aid in determining the market's development possibilities.
- Country Level Data:
Various factors that are especially aligned to the country are taken into account to determine the market size for a certain area and country, including the presence of vendors, such as headquarters and offices, the country's GDP, demand patterns, and industry growth. To comprehend the market dynamics for the nation, a number of growth variables, inhibitors, application areas, and current market trends are researched. The aforementioned elements aid in determining the country's overall market's growth potential.
- Company Profile:
The “Table of Contents” is formulated by listing and analyzing more than 25 - 30 companies operating in the market ecosystem across geographies. However, we profile only 10 companies as a standard practice in our syndicate reports. These 10 companies comprise leading, emerging, and regional players. Nonetheless, our analysis is not restricted to the 10 listed companies, we also analyze other companies present in the market to develop a holistic view and understand the prevailing trends. The “Company Profiles” section in the report covers key facts, business description, products & services, financial information, SWOT analysis, and key developments. The financial information presented is extracted from the annual reports and official documents of the publicly listed companies. Upon collecting the information for the sections of respective companies, we verify them via various primary sources and then compile the data in respective company profiles. The company level information helps us in deriving the base number as well as in forecasting the market size.
- Developing Base Number:
Aggregation of sales statistics (2020-2022) and macro-economic factor, and other secondary and primary research insights are utilized to arrive at base number and related market shares for 2022. The data gaps are identified in this step and relevant market data is analyzed, collected from paid primary interviews or databases. On finalizing the base year market size, forecasts are developed on the basis of macro-economic, industry and market growth factors and company level analysis.
- Data Triangulation and Final Review:
The market findings and base year market size calculations are validated from supply as well as demand side. Demand side validations are based on macro-economic factor analysis and benchmarks for respective regions and countries. In case of supply side validations, revenues of major companies are estimated (in case not available) based on industry benchmark, approximate number of employees, product portfolio, and primary interviews revenues are gathered. Further revenue from target product/service segment is assessed to avoid overshooting of market statistics. In case of heavy deviations between supply and demand side values, all thes steps are repeated to achieve synchronization.
We follow an iterative model, wherein we share our research findings with Subject Matter Experts (SME’s) and Key Opinion Leaders (KOLs) until consensus view of the market is not formulated – this model negates any drastic deviation in the opinions of experts. Only validated and universally acceptable research findings are quoted in our reports.
We have important check points that we use to validate our research findings – which we call – data triangulation, where we validate the information, we generate from secondary sources with primary interviews and then we re-validate with our internal data bases and Subject matter experts. This comprehensive model enables us to deliver high quality, reliable data in shortest possible time.
 Ottieni un campione gratuito per questo repot