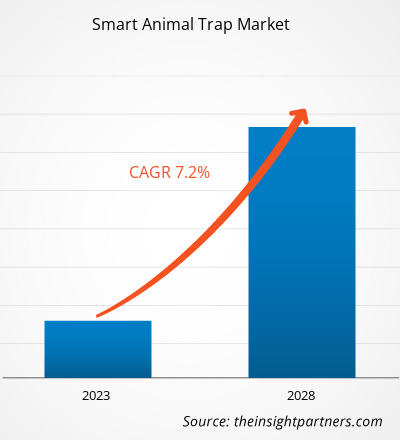
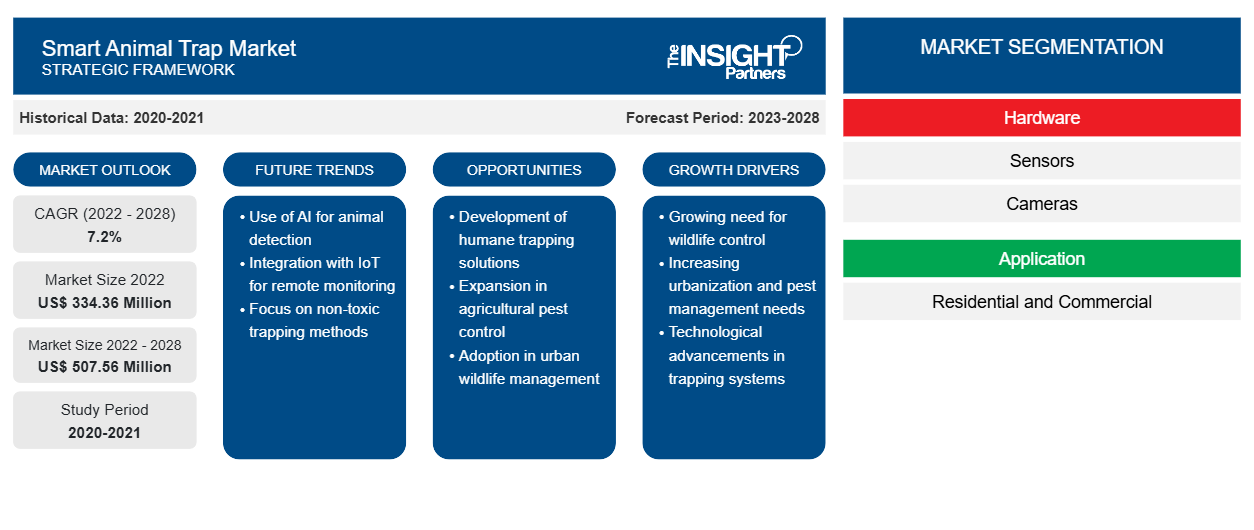
Si prevede che il mercato delle trappole intelligenti per animali crescerà da 334,36 milioni di dollari nel 2022 a 507,56 milioni di dollari entro il 2028. Si stima che crescerà a un CAGR del 7,2% dal 2022 al 2028.
Cinghiali, cervi, procioni e altri animali possono distruggere i raccolti e tali danni causati dalla fauna selvatica demotivano gli agricoltori. Le trappole intelligenti per animali sono pensate per consentire agli utenti finali di catturare animali da remoto per vari motivi, come cibo, commercio di pellicce, caccia, controllo dei parassiti e gestione della fauna selvatica. I sensori incorporati in questi sistemi consentono loro di rilevare la cattura di un animale pericoloso. I sistemi quindi avvisano gli amministratori distanti tramite GPS e connessione wireless. Lo stato di tutte le trappole installate in una regione può essere tracciato e mostrato su una mappa e gli indirizzi e-mail registrati possono essere informati di tale stato. La tecnologia consente ai cacciatori di recarsi direttamente nei siti in cui sono stati catturati animali pericolosi.
Inoltre, in conformità con le direttive UE Habitat e Uccelli, i paesi dell'UE hanno imposto rigide regole per la conservazione dei principali luoghi di riproduzione e riposo per molte specie, in particolare quelle rare e minacciate, all'interno della rete Natura 2000. Hanno anche creato aree per la protezione fisica di singoli esemplari nei 27 stati membri dell'UE. L'UE stabilisce anche linee guida per la cura degli animali e collabora con altre nazioni per prevenire il commercio illegale di fauna selvatica in tutto il mondo. Pertanto, è diventato necessario per i custodi della fauna selvatica monitorare adeguatamente questi animali, rafforzando la domanda di trappole intelligenti per animali in Europa.
L'Europa ha 504 parchi nazionali. Con 48 parchi per un totale di 141.200 km2, la Russia ha il numero più alto di parchi nazionali nella regione. La Russia è seguita da Finlandia, Svezia, Norvegia, Turchia e Francia con rispettivamente 40, 30, 47, 43 e 30 parchi nazionali. Inoltre, la Francia ha la seconda più grande area totale coperta da parchi nazionali. I 10 parchi nazionali in Francia occupano 60.728 km2 di superficie. I parchi nazionali preservano il 9,5% della superficie totale della Francia, che è seconda solo all'Islanda (12,1%) in termini di percentuale. Con aree così vaste, questi custodi dei parchi devono tenere d'occhio la salute degli animali per tenere il passo con il crescente numero di turisti, favorendo la crescita del mercato delle trappole intelligenti per animali .
Personalizza questo report in base alle tue esigenze
Riceverai la personalizzazione gratuita di qualsiasi report, comprese parti di questo report, o analisi a livello nazionale, pacchetto dati Excel, oltre a usufruire di grandi offerte e sconti per start-up e università
-
Scopri le principali tendenze di mercato in questo rapporto.Questo campione GRATUITO includerà analisi di dati che spaziano dalle tendenze di mercato alle stime e alle previsioni.
- Mercato delle trappole intelligenti per animali
Impatto della pandemia di COVID-19 sul mercato delle trappole intelligenti per animali
India, Cina e Giappone hanno molte strutture elettroniche e utenti finali del mercato delle trappole intelligenti per animali. Alla fine del 2021, nonostante l'aumento dei casi di COVID-19, questi paesi hanno allentato le norme di contenimento. Con l'aumento dei casi di COVID-19 in Cina, alcune fabbriche erano ancora operative ma non riuscivano a soddisfare la domanda. Secondo l'Organizzazione per la cooperazione e lo sviluppo economico (OCSE), la pandemia ha colpito gravemente paesi come India, Australia, Cina e Giappone. L'India è stato il paese più colpito dalla pandemia in questa regione. Le limitazioni imposte dai governi per controllare la diffusione del COVID-19 durante le fasi iniziali della crisi hanno influenzato il processo di produzione in questi paesi a causa della forza lavoro limitata, che ha ostacolato la crescita del mercato delle trappole intelligenti per animali nel 2020.OECD), the pandemic severely affected countries such as India, Australia, China, and Japan. India was the worst-hit country by the pandemic in this region. Limitations imposed by governments to control the spread of COVID-19 during the initial time stages of the crisis affected the production process in these countries due to the limited workforce, which hampered the smart animal trap market growth in 2020.
Approfondimenti di mercato - Mercato delle trappole intelligenti per animali
Il Nord America deteneva la quota maggiore del mercato delle trappole intelligenti per animali. La crescente domanda di animali da allevamento, la rapida adozione di animali domestici con un reddito disponibile in crescita, l'aumento dei prodotti per la cura degli animali domestici e la crescente prevalenza di malattie animali sono i fattori che supportano l'espansione del mercato delle trappole intelligenti per animali in questa regione. Negli ultimi anni si è registrato un aumento significativo delle adozioni di animali domestici, soprattutto dopo lo scoppio del COVID-19 in Canada. Il modello nordamericano di conservazione della fauna selvatica si basa su sette principi fondamentali che supportano l'idea che la fauna selvatica sia un bene pubblico e un diritto di nascita delle persone e che le specie selvatiche debbano essere gestite in modo che le loro popolazioni siano sostenute per sempre. Tali robuste comunità di fauna selvatica sono i principali generatori di domanda di trappole intelligenti per animali in tutta la regione.
Il Recovering America's Wildlife Act, chiamato anche RAWA, è stato uno degli investimenti più importanti dei governi mondiali nella conservazione della fauna selvatica. Il disegno di legge da 1,397 miliardi di dollari finanzierà iniziative regionali e nazionali per assistere la fauna selvatica in difficoltà e impedirne l'estinzione. Aiuterà anche nel recupero di specie già in via di estinzione. In conformità a ciò, le aziende in tutta la nazione stanno offrendo un'ampia selezione di trappole intelligenti per animali. Ad esempio, TrapSmar utilizza la tecnologia di comunicazione GPS all'avanguardia per offrire una soluzione semplice, compassionevole e pratica per monitorare le trappole per la fauna selvatica da remoto. I suoi tre canali di comunicazione offrono copertura quasi ovunque nel mondo.RAWA, was one of the global governments' most important investments in wildlife conservation. The US$1.397 billion bill would finance regional and national initiatives to assist wildlife in need and stop wildlife from going extinct. It will also assist in the recovery of already endangered species. In accordance with this, businesses all around the nation are offering a wide selection of intelligent animal traps. For instance, TrapSmar uses cutting-edge GPS communication technology to offer a simple, compassionate, and practical solution to monitor wildlife traps remotely. Its three communication channels offer coverage almost anywhere in the world.
Approfondimenti regionali sul mercato delle trappole intelligenti per animali
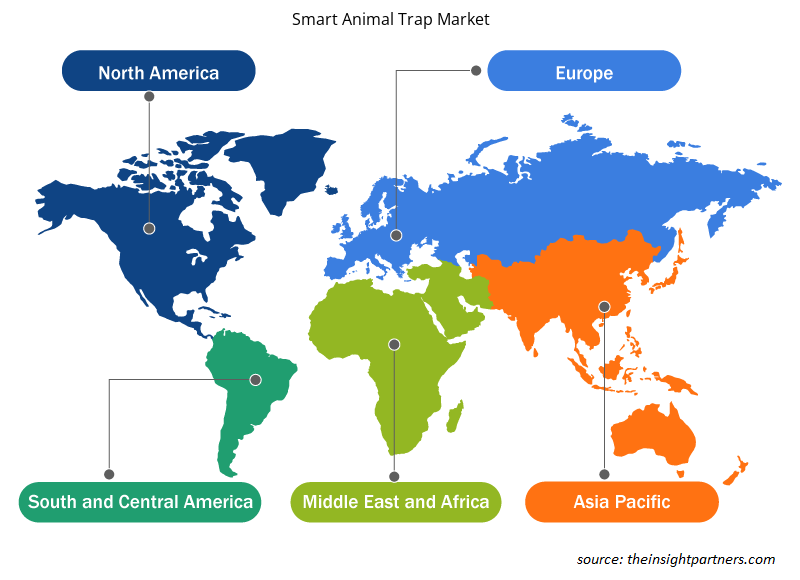
Le tendenze regionali e i fattori che influenzano il mercato delle trappole intelligenti per animali durante il periodo di previsione sono stati ampiamente spiegati dagli analisti di Insight Partners. Questa sezione discute anche i segmenti e la geografia del mercato delle trappole intelligenti per animali in Nord America, Europa, Asia Pacifico, Medio Oriente e Africa e Sud e Centro America.

- Ottieni i dati specifici regionali per il mercato delle trappole intelligenti per animali
Ambito del rapporto di mercato sulle trappole intelligenti per animali
| Attributo del report | Dettagli |
|---|---|
| Dimensioni del mercato nel 2022 | 334,36 milioni di dollari USA |
| Dimensioni del mercato entro il 2028 | 507,56 milioni di dollari USA |
| CAGR globale (2022 - 2028) | 7,2% |
| Dati storici | 2020-2021 |
| Periodo di previsione | 2023-2028 |
| Segmenti coperti |
Per Hardware
|
| Regioni e Paesi coperti |
America del Nord
|
| Leader di mercato e profili aziendali chiave |
|
Densità dei player del mercato delle trappole intelligenti per animali: comprendere il suo impatto sulle dinamiche aziendali
Il mercato delle trappole intelligenti per animali sta crescendo rapidamente, spinto dalla crescente domanda degli utenti finali dovuta a fattori quali l'evoluzione delle preferenze dei consumatori, i progressi tecnologici e una maggiore consapevolezza dei vantaggi del prodotto. Con l'aumento della domanda, le aziende stanno ampliando le loro offerte, innovando per soddisfare le esigenze dei consumatori e capitalizzando sulle tendenze emergenti, il che alimenta ulteriormente la crescita del mercato.
La densità degli operatori di mercato si riferisce alla distribuzione di aziende o società che operano in un particolare mercato o settore. Indica quanti concorrenti (operatori di mercato) sono presenti in un dato spazio di mercato in relazione alle sue dimensioni o al valore di mercato totale.
Le principali aziende che operano nel mercato delle trappole intelligenti per animali sono:
- Trappolatore
- AlertHouse ApS (polizia di Mink)
- Responsabile della revisione
- Mescolatore selvaggio
- Falco del cielo
Disclaimer : le aziende elencate sopra non sono classificate secondo un ordine particolare.

- Ottieni la panoramica dei principali attori del mercato delle trappole intelligenti per animali
Approfondimenti basati sui componenti
In base al componente, il report di mercato delle trappole intelligenti per animali è suddiviso in hardware, software e servizi. Le trappole intelligenti per animali sono costituite da componenti hardware costituiti da vari sensori e tracker. Il software funge da collegamento tra l'hardware e l'utente finale, fornendo un'interfaccia utente per interagire con l'hardware. I servizi sono interamente basati sui requisiti dell'utente e sulla configurazione hardware e software dei fornitori di servizi.
Le aziende profilate nello studio di mercato delle trappole intelligenti per animali sono Alert House ApS, CatchAlive ApS, Encounter Solutions Ltd., Econode Ltd. e Wildlife Dominion Management LLC. (HogEye), PestSense Pty Ltd Animal Trap Solutions, Skyhawk, TrapSmart tm LLP., uWatch Ltd., Fallenmelder TRAPMASTER, TFK Handels GmbH, WildMelder, Triotos e BOARMASTER. Oltre a questi 14 attori, durante lo studio di mercato delle trappole intelligenti per animali sono state analizzate anche numerose importanti aziende globali e regionali, attori emergenti, disruptor del mercato e attori di nicchia.
Gli operatori del mercato delle trappole intelligenti per animali stanno adottando in larga parte la strategia delle iniziative di mercato che prevede l'espansione della presenza in tutto il mondo e la soddisfazione dell'aumento della domanda dei clienti. Gli operatori del mercato delle trappole intelligenti per animali si stanno concentrando principalmente sui miglioramenti di prodotti e servizi integrando funzionalità e tecnologie avanzate nelle loro offerte.
- Skyhawk parteciperà alla conferenza estiva GPCA presso The Cloister a Sea Island, GA, dall'11 al 14 luglio 2022. L'azienda ha partecipato alla Texas Pest Control Expo, tenutasi presso il Fort Worth Convention Center, Texas, dal 21 al 23 giugno 2022.
- Analisi storica (2 anni), anno base, previsione (7 anni) con CAGR
- Analisi PEST e SWOT
- Valore/volume delle dimensioni del mercato - Globale, Regionale, Nazionale
- Industria e panorama competitivo
- Set di dati Excel
Report recenti
Rapporti correlati
Testimonianze
Motivo dell'acquisto
- Processo decisionale informato
- Comprensione delle dinamiche di mercato
- Analisi competitiva
- Analisi dei clienti
- Previsioni di mercato
- Mitigazione del rischio
- Pianificazione strategica
- Giustificazione degli investimenti
- Identificazione dei mercati emergenti
- Miglioramento delle strategie di marketing
- Aumento dell'efficienza operativa
- Allineamento alle tendenze normative


 Ottieni un campione gratuito per - Mercato delle trappole intelligenti per animali