Smart Commute Market to garner US$ 22,261.76 Mn by 2028 and is segmented by Product, Type and Application.
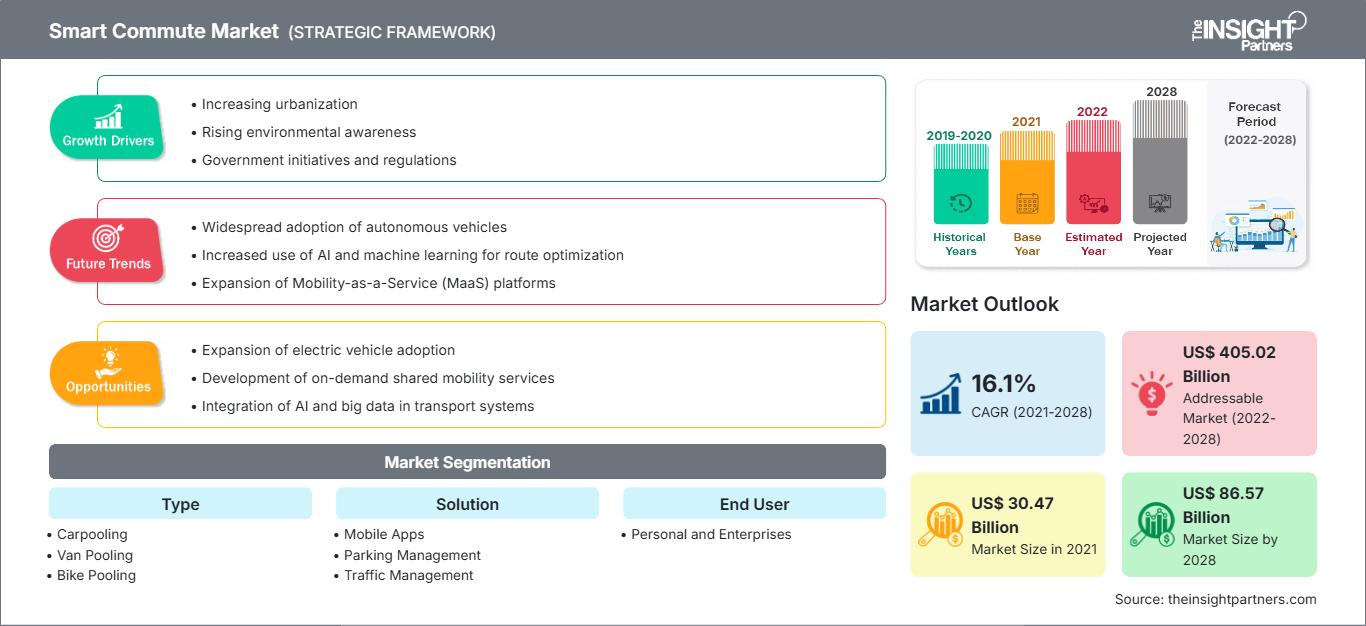
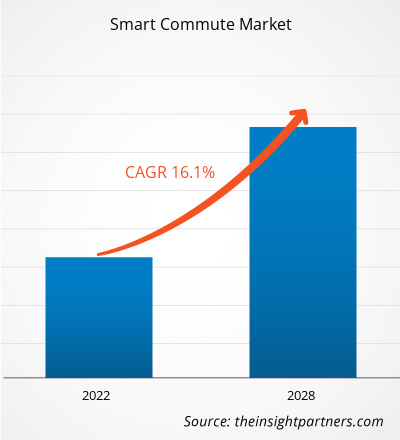
Si prevede che il mercato dei pendolari intelligenti crescerà da 30.469,49 milioni di dollari nel 2021 a 86.568,73 milioni di dollari entro il 2028; si stima che crescerà ad un CAGR del 16,1% dal 2021 al 2028.
Per pendolarismo intelligente si intende viaggiare regolarmente tramite carpooling, vanpooling, bicicletta, ciclisti o prendendo la metropolitana. Le aziende di trasporto pubblico, i governi e altre parti interessate hanno sviluppato una strategia completa che considera i viaggi intelligenti e li condivide con il pubblico per costruire trasporti più potenti nelle regioni metropolitane. Il pendolarismo intelligente ha un impatto positivo sull’ambiente diminuendo la congestione del traffico e riducendo le emissioni di gas serra.
Carpooling, bike sharing , vanpooling e altre opzioni di pendolarismo rispettose dell'ambiente sono disponibili attraverso i servizi di pendolarismo intelligente. Fornisce agli impiegati un'opzione di trasporto per scegliere un percorso più efficace che riduce la congestione del traffico e le spese di trasporto. Uno dei fattori che stimolano la crescita del mercato dei pendolari intelligenti è il crescente numero di abitanti delle città, che porta ad un aumento dei tassi generazionali. I servizi di trasporto condiviso hanno acquisito un’accettabilità universale e vengono incoraggiati dai governi e dagli enti ambientali poiché aiutano a ridurre le emissioni. Permette un minor numero di automobili private, il che dovrebbe alimentare la crescita del mercato dei pendolari intelligenti nei prossimi anni.
In Nord America, la necessità di spostamenti intelligenti è stata alimentata da una crescente preferenza per i servizi di car pooling tra i pendolari d’ufficio, che allevierebbero la congestione del traffico e preverrebbero danni ambientali. Inoltre, l’aumento dell’industria del turismo, i progressi tecnologici e le politiche governative favorevoli sono altri fattori che guidano la crescita del mercato dei pendolari intelligenti in Nord America . In Europa, si prevede che l’aumento del trend della mobilità come servizio e l’aumento della base di utenti dei servizi di ride-sharing creeranno opportunità redditizie per gli operatori del mercato.
In Europa, a causa delle crescenti preoccupazioni sul riscaldamento globale, sulla congestione stradale e sulla dipendenza dall’energia straniera, i pendolari intelligenti stanno diventando sempre più popolari. La pratica di imporre tariffe di pedaggio sulle automobili con un solo occupante, imposta nel 2012, ha comportato un enorme aumento dell’uso degli spostamenti intelligenti da parte dei consumatori europei.
Personalizza la ricerca in base alle tue esigenze
Possiamo ottimizzare e personalizzare l'analisi e l'ambito che non sono soddisfatti dalle nostre offerte standard. Questa flessibilità ti aiuterà a ottenere le informazioni esatte necessarie per la pianificazione aziendale e il processo decisionale.
Mercato degli spostamenti intelligenti: approfondimenti strategici
CAGR (2021 - 2028)16,1%- Dimensione del mercato nel 2021:
30,47 miliardi di dollari - Dimensione del mercato nel 2028:
86,57 miliardi di dollari
Dinamiche di mercato
- XXXXXXX
- XXXXXXX
- XXXXXXX
- XXXXXXX
- XXXXXXX
- XXXXXXX
- XXXXXXX
- XXXXXXX
- XXXXXXX
Giocatori chiave
- BlaBlaCar
- PendolarismoSmart
- Imprese Holdings Inc
- ePoolers Technologies Pvt. Ltd
- Golden Concord Holdings Limited
- Pendolarismo intelligente di Oakland
- Giro veloce
- Transhelp Technologies Pvt Ltd
- Uber Technologies Inc.
Panoramica regionale
- Nord America
- Europa
- Asia-Pacifico
- America meridionale e centrale
- Medio Oriente e Africa
Segmentazione del mercato
- Car pooling
- Raggruppamento di furgoni
- Pool di biciclette
- Metro
- Altri
- App mobili
- Gestione dei parcheggi
- Gestione del traffico
- Altri
- Personale e Imprese
- Il PDF di esempio mostra la struttura del contenuto e la natura delle informazioni con analisi qualitative e quantitative.
:
Impatto della pandemia COVID-19 sul mercato Pendolarismo intelligente
L’epidemia di Covid-19 ha avuto un impatto significativo sul settore dei trasporti. La domanda di servizi di car pooling e vanpooling si è ridotta a livello globale nel 2020 a causa del COVID-19. Il mercato mondiale degli spostamenti intelligenti ha registrato un notevole calo nella generazione di ricavi nel 2020 rispetto al 2019, in parte a causa dei lockdown e della riluttanza dei clienti a utilizzare i servizi di ride-sharing anche dopo la revoca delle normative. Le aziende di ride sharing cercano sempre di mantenere la fiducia di conducenti e passeggeri in termini di sicurezza e igiene.
Approfondimenti di mercato: mercato degli spostamenti intelligenti
Tendenza crescente della mobilità come servizio
Le persone che non possono acquistare un'auto possono viaggiare senza problemi attraverso i servizi di mobilità. Secondo il Bureau of Transportation Statistics, il costo medio di possesso e gestione di un veicolo è di circa 8.858 dollari, ipotizzando 15.000 chilometri di guida all’anno. La mobilità come servizio riduce questi costi per l’utente massimizzando l’uso di servizi di trasporto come il car pooling e il ride-hailing. Riduce inoltre la congestione del traffico e le emissioni complessive delle automobili nelle città. Di conseguenza, il car pooling e il ride-hailing abilitati digitalmente gestiscono in modo efficiente le richieste di trasporto e forniscono un’alternativa conveniente ed ecologica alla proprietà privata dell’automobile. Inoltre, secondo le statistiche, il 55% della popolazione mondiale vive attualmente nelle città e le stime suggeriscono che entro il 2050, circa il 68% della popolazione vivrà nelle città. Il rapido ritmo dell’urbanizzazione sta già portando alla congestione del traffico. Il concetto di mobilità come servizio (MaaS) può essere una scelta migliore per ridurre la congestione del traffico facendo un maggiore uso delle infrastrutture di trasporto pubbliche e private esistenti. Si prevede che l’urgente richiesta di soluzioni efficaci per gestire il traffico nelle città intelligenti in modo più veloce, meno costoso e più conveniente alimenterà la crescita del mercato MaaS entro il 2028. Pertanto, si prevede che la tendenza crescente della mobilità come servizio (MaaS) alimenterà la crescita del mercato globale degli spostamenti intelligenti.
Approfondimenti sul mercato degli spostamenti intelligenti basati sulla tipologia
In base alla tipologia, il mercato del pendolarismo intelligente è segmentato in carpooling, vanpooling, bike pooling, metropolitana e altri. Si prevede che il segmento del car pooling deterrà una quota significativa nel mercato globale dei pendolari intelligenti e si prevede che crescerà al CAGR più elevato. Il pendolarismo intelligente è definito come viaggiare regolarmente da un punto a un altro tramite carpooling, vanpooling, bicicletta, ciclisti o prendendo la metropolitana.
Approfondimenti sul mercato degli spostamenti intelligenti basati su soluzioni
In base alla soluzione, il mercato del pendolarismo intelligente è segmentato in app mobili, gestione dei parcheggi , gestione del traffico e altro. Si prevede che il segmento delle app mobili deterrà una quota significativa nel mercato globale degli spostamenti intelligenti e si prevede che crescerà al CAGR più elevato. Vi è un crescente utilizzo di applicazioni mobili nella modalità di viaggio in automobile per ridurre i tempi di viaggio, i costi e le emissioni dei veicoli.
Approfondimenti sul mercato del pendolarismo intelligente basato sull'utente finale
In base all’utente finale, il mercato del pendolarismo intelligente è biforcato in personale e aziendale. Si prevede che il segmento delle imprese deterrà una quota significativa nel mercato globale dei pendolari intelligenti e si prevede che crescerà a un CAGR più elevato.
Ambito del rapporto sul mercato Smart Commute
Attributo del rapporto | Dettagli |
---|---|
Dimensioni del mercato nel 2021 | 30,47 miliardi di dollari |
Dimensioni del mercato entro il 2028 | 86,57 miliardi di dollari |
CAGR globale (2021-2028) | 16,1% |
Dati storici | 2019-2020 |
Periodo di previsione | 2022-2028 |
Segmenti coperti | Per tipo
|
Regioni e paesi coperti | Nord America
|
Leader di mercato e profili aziendali chiave |
|
- Il PDF di esempio mostra la struttura del contenuto e la natura delle informazioni con analisi qualitative e quantitative.
Gli operatori che operano nel mercato dei pendolari intelligenti si concentrano principalmente sullo sviluppo di prodotti avanzati ed efficienti.
- Nel gennaio 2022, Tummoc, un'azienda di mobilità multimodale, intende espandere le operazioni in altre dieci città entro il 2022, tra cui Delhi e Mumbai.
- Nell'aprile 2021, un'azienda di mobilità con sede in città ha creato una piattaforma app che integra per la prima volta i percorsi con i prezzi, combinando autobus, metropolitana, Uber, Yulu e altre scelte dell'ultimo miglio.
Profilo aziendale
:
- BlaBlaCar
- PendolarismoSmart
- Imprese Holdings Inc
- ePoolers Technologies Pvt. Ltd
- Golden Concord Holdings Limited
- Pendolarismo intelligente di Oakland
- Giro veloce
- Transhelp Technologies Pvt Ltd
- Uber Technologies Inc.
- Pendolarismo intelligente
Smart Commute Market Report Scope
Report Attribute | Details |
---|---|
Market size in | US$ 30.47 Billion |
Market Size by | US$ 86.57 Billion |
Global CAGR | 16.1% |
Historical Data | 2019-2020 |
Forecast period | 2022-2028 |
Segments Covered |
By Tipologia
|
Regions and Countries Covered |
Nord America
|
Market leaders and key company profiles |
|
Report Coverage
Revenue forecast, Company Analysis, Industry landscape, Growth factors, and Trends
Segment Covered
This text is related
to segments covered.
Regional Scope
North America, Europe, Asia Pacific, Middle East & Africa, South & Central America
Country Scope
This text is related
to country scope.
Frequently Asked Questions
Based on type, the global Smart Commute market is segmented into carpooling, van pooling, bike pooling, metro, and others. The Smart Commute market was dominated by the carpooling segment in 2020.
North America dominated the Smart Commute market in 2020 with a share of 43.9%. Asia Pacific is expected to grow at a fastest CAGR accounting for 40.0% share by 2028, followed by Europe.
The major companies in Smart Commute market are Enterprise Holdings, Inc.; BlaBlaCar; CommuteSmart; ePoolers Technologies Pvt. Ltd.; Smart Commute; Oakland Smart Commute; Quick Ride; Tummoc (Transhelp Technologies Pvt. Ltd.); Uber Technologies, Inc.; and GCL Smart Commute Co., Ltd.
The major end user in Smart Commute includes personal, and enterprises. In terms of market share, the market was dominated by the enterprises segment in 2020.
IoT devices can be used to make daily commutes more enjoyable. These technologies also help reduce overall transport costs while being environmentally beneficial. The best IoT option for the last-mile journey could be connected bicycles. Citizens have already begun to benefit from combined bike-sharing possibilities provided by market players. Users may keep track of bike availability, usage, and trip details. The only stumbling block for linked bike-sharing programs is integrating them into today's traffic. Governments must ensure that designated bike lanes exist to maintain a smooth traffic flow. In some areas, connected electric scooters are also available for rent. Some firms even offer complimentary helmets to electric scooter riders for a minimal shipping fee. By providing alternate commute options, these businesses contribute to a better future for our world. Apps for taxi commuting are already widespread among today's youth. Rather than driving their car, many commuters use taxi services such as Uber and Lyft. This is a more cost-effective and environmentally responsible solution than single-user rides. These businesses have access to a wealth of data that may be monitored and studied to improve cab-sharing services. Unlike most public transit, they can function similarly to public transportation, but they can provide a comprehensive commute option.
The key element driving the expansion of smart commutes is a rapid increase in the adoption of carpool and bike pool services among regular office commuters. Prominent market players such as Uber and Ola offer convenient pick-up and drop-off services, attracting consumers to use ride-sharing services. Furthermore, services such as short-distance travel, intercity ride-sharing, bus-sharing, bike-sharing, and auto-sharing are available, which stimulates the expansion of smart commute demand. Many prominent Indian corporations proactively push employees to use carpool and bike pool services. Organizations with large workforces, such as Infosys, Capgemini, Cognizant, HCL, Amazon, Flipkart, Siemens, L&T, Biocon, and HDFC Bank, as well as several smaller businesses, are launching awareness campaigns and digital platforms to help employees better plan their commutes. Moreover, organizations are rewarding top carpoolers to keep employees engaged and motivated to reduce carbon emissions and traffic jams across cities. New York, Seoul, and Shanghai are among the top 10 cities with the highest carbon footprint. Governments and businesses are encouraging carpooling to commute in cities to reduce emissions. Countries have established specific targets for reducing carbon footprints by 2030 as part of the Paris climate agreement. In Delhi, India, the government implemented an odd-even strategy to control traffic density and reduce carbon emissions in the city.
The List of Companies - Smart Commute Market
- BlaBlaCar
- CommuteSmart
- Enterprise Holdings Inc
- ePoolers Technologies Pvt. Ltd
- Golden Concord Holdings Limited
- Oakland Smart Commute
- Quick Ride
- Transhelp Technologies Pvt Ltd
- Uber Technologies Inc.
- Smart Commute
The Insight Partners performs research in 4 major stages: Data Collection & Secondary Research, Primary Research, Data Analysis and Data Triangulation & Final Review.
- Data Collection and Secondary Research:
As a market research and consulting firm operating from a decade, we have published and advised several client across the globe. First step for any study will start with an assessment of currently available data and insights from existing reports. Further, historical and current market information is collected from Investor Presentations, Annual Reports, SEC Filings, etc., and other information related to company’s performance and market positioning are gathered from Paid Databases (Factiva, Hoovers, and Reuters) and various other publications available in public domain.
Several associations trade associates, technical forums, institutes, societies and organization are accessed to gain technical as well as market related insights through their publications such as research papers, blogs and press releases related to the studies are referred to get cues about the market. Further, white papers, journals, magazines, and other news articles published in last 3 years are scrutinized and analyzed to understand the current market trends.
- Primary Research:
The primarily interview analysis comprise of data obtained from industry participants interview and answers to survey questions gathered by in-house primary team.
For primary research, interviews are conducted with industry experts/CEOs/Marketing Managers/VPs/Subject Matter Experts from both demand and supply side to get a 360-degree view of the market. The primary team conducts several interviews based on the complexity of the markets to understand the various market trends and dynamics which makes research more credible and precise.
A typical research interview fulfils the following functions:
- Provides first-hand information on the market size, market trends, growth trends, competitive landscape, and outlook
- Validates and strengthens in-house secondary research findings
- Develops the analysis team’s expertise and market understanding
Primary research involves email interactions and telephone interviews for each market, category, segment, and sub-segment across geographies. The participants who typically take part in such a process include, but are not limited to:
- Industry participants: VPs, business development managers, market intelligence managers and national sales managers
- Outside experts: Valuation experts, research analysts and key opinion leaders specializing in the electronics and semiconductor industry.
Below is the breakup of our primary respondents by company, designation, and region:
Once we receive the confirmation from primary research sources or primary respondents, we finalize the base year market estimation and forecast the data as per the macroeconomic and microeconomic factors assessed during data collection.
- Data Analysis:
Once data is validated through both secondary as well as primary respondents, we finalize the market estimations by hypothesis formulation and factor analysis at regional and country level.
- Macro-Economic Factor Analysis:
We analyse macroeconomic indicators such the gross domestic product (GDP), increase in the demand for goods and services across industries, technological advancement, regional economic growth, governmental policies, the influence of COVID-19, PEST analysis, and other aspects. This analysis aids in setting benchmarks for various nations/regions and approximating market splits. Additionally, the general trend of the aforementioned components aid in determining the market's development possibilities.
- Country Level Data:
Various factors that are especially aligned to the country are taken into account to determine the market size for a certain area and country, including the presence of vendors, such as headquarters and offices, the country's GDP, demand patterns, and industry growth. To comprehend the market dynamics for the nation, a number of growth variables, inhibitors, application areas, and current market trends are researched. The aforementioned elements aid in determining the country's overall market's growth potential.
- Company Profile:
The “Table of Contents” is formulated by listing and analyzing more than 25 - 30 companies operating in the market ecosystem across geographies. However, we profile only 10 companies as a standard practice in our syndicate reports. These 10 companies comprise leading, emerging, and regional players. Nonetheless, our analysis is not restricted to the 10 listed companies, we also analyze other companies present in the market to develop a holistic view and understand the prevailing trends. The “Company Profiles” section in the report covers key facts, business description, products & services, financial information, SWOT analysis, and key developments. The financial information presented is extracted from the annual reports and official documents of the publicly listed companies. Upon collecting the information for the sections of respective companies, we verify them via various primary sources and then compile the data in respective company profiles. The company level information helps us in deriving the base number as well as in forecasting the market size.
- Developing Base Number:
Aggregation of sales statistics (2020-2022) and macro-economic factor, and other secondary and primary research insights are utilized to arrive at base number and related market shares for 2022. The data gaps are identified in this step and relevant market data is analyzed, collected from paid primary interviews or databases. On finalizing the base year market size, forecasts are developed on the basis of macro-economic, industry and market growth factors and company level analysis.
- Data Triangulation and Final Review:
The market findings and base year market size calculations are validated from supply as well as demand side. Demand side validations are based on macro-economic factor analysis and benchmarks for respective regions and countries. In case of supply side validations, revenues of major companies are estimated (in case not available) based on industry benchmark, approximate number of employees, product portfolio, and primary interviews revenues are gathered. Further revenue from target product/service segment is assessed to avoid overshooting of market statistics. In case of heavy deviations between supply and demand side values, all thes steps are repeated to achieve synchronization.
We follow an iterative model, wherein we share our research findings with Subject Matter Experts (SME’s) and Key Opinion Leaders (KOLs) until consensus view of the market is not formulated – this model negates any drastic deviation in the opinions of experts. Only validated and universally acceptable research findings are quoted in our reports.
We have important check points that we use to validate our research findings – which we call – data triangulation, where we validate the information, we generate from secondary sources with primary interviews and then we re-validate with our internal data bases and Subject matter experts. This comprehensive model enables us to deliver high quality, reliable data in shortest possible time.