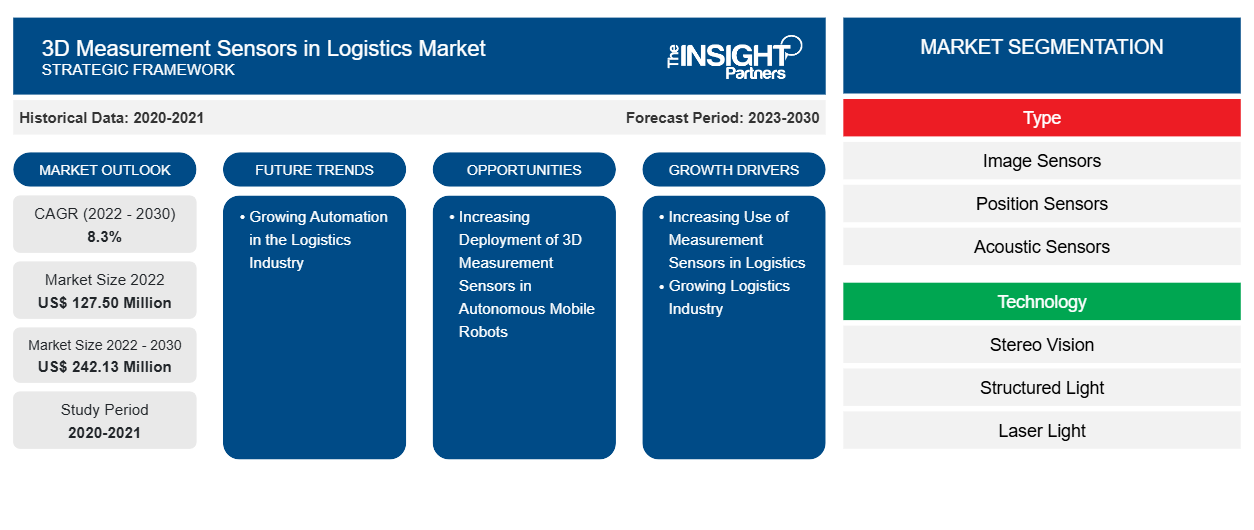
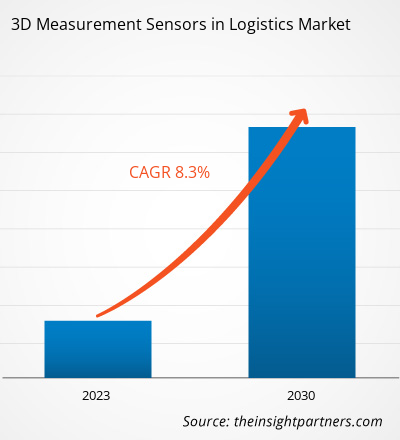
[調査レポート] 物流における3D測定センサーの市場規模は、2022年の1億2,750万米ドルから2030年には2億4,213万米ドルに成長すると予想されており、予測期間中に8.3%のCAGRを記録すると推定されています。
アナリストの視点:
3D画像センサー、3D位置センサー、3D深度センサーは、倉庫内の商品の動きを追跡するのに役立つため、世界中の物流業界で需要が高まっています。さらに、これらのセンサーは、企業がボトルネックを特定し、ニーズに応じて倉庫レイアウトを最適化するのにも役立ち、物流市場における3D測定センサーの成長を促進します。また、eコマース業界の成長に伴い、物流部門は驚異的な成長を遂げています。この成長により、マシンビジョン、資産追跡、データキャプチャスキャン、オブジェクトの寸法測定を通じてリアルタイムデータを提供することで、運用効率をさらに高めるための自動化の必要性が高まっています。さらに、ロボットが周囲の状況をより認識するのに役立つため、ロボット工学における3D測定センサーの使用が増加しており、倉庫内でのピックアンドグラブ操作を効率的に実行できるため、物流市場における3D測定センサーの成長の機会が生まれています。
市場概要:
3D 測定センサーは、電子的に情報を取得し、このデータを使用して人間、デバイス、および世界間のインターフェイスを改善するために使用されます。これらのセンサーは、近赤外光の反射、写真、幾何学的原理、および高度なコンピューティング パワーを使用して、機械が人や物体に関する詳細を取得できるようにし、さらに意味のある情報に処理できる 3D センシング テクノロジーで動作します。3D センサーは、倉庫や物流業務で効率を高めるために使用されているため、需要が大幅に増加しています。倉庫では、センサーは製品の損傷やその他の不適合をより効果的に監視するのに役立つため、注文の履行に使用され、物流市場における 3D 測定センサーの成長を促進しています。
要件に合わせてレポートをカスタマイズする
このレポートの一部、国レベルの分析、Excelデータパックなど、あらゆるレポートを無料でカスタマイズできます。また、スタートアップや大学向けのお得なオファーや割引もご利用いただけます。
物流市場における3D計測センサー:
- このレポートの主要な市場動向を入手してください。この無料サンプルには、市場動向から見積もりや予測に至るまでのデータ分析が含まれます。
市場の推進要因:
物流における計測センサーの利用増加 物流市場における3D計測センサー
画像センサー、位置センサー、音響センサーなどの測定センサーの使用が増えたことで、いくつかの物流業務が簡素化されました。画像センサーは、物流配送システムでのターゲット認識に使用され、配送プロセスを効率的に管理します。位置センサーは、あらゆる材質や表面特性の物体の位置を検出するために使用されます。位置センサーは、物体の移動に関するデータを信号に変換し、位置のフィードバックを提供するのに役立ちます。在庫レベルの監視、在庫エラーの削減、保管スペースの最適化など、さまざまな物流および倉庫管理業務は、測定センサーの助けを借りて簡単に実行できます。倉庫内の商品の移動を追跡する以外に、これらのセンサーは企業がボトルネックを特定し、倉庫レイアウトを最適化するのにも役立ちます。さらに、測定センサーを使用して緊急事態の現場でデータを収集し、物流業務の分析を容易にすることができます。このデータは、新しい業務の計画と準備をさらに改善するのに役立ちます。リアルタイムの情報により、状況認識が向上し、人工知能または最適化アルゴリズムに基づく自動意思決定サポートの入力として使用することもできます。そのため、配送センターや倉庫の効率を高めるために測定センサーの使用が増え、物流市場における 3D 測定センサーの成長が促進されています。
セグメント分析:
技術に基づいて、物流市場における 3D 測定センサーは次のように分類されます。
- ステレオビジョン
- 構造化光
- レーザー光
- その他
構造化光セグメントは、2022年に物流市場における3D測定センサーの最大のシェアを占めました。構造化光技術は、物流における3D測定機能を強化し、正確な容積分析、寸法検査、仕分け最適化、積荷計画、品質管理を可能にします。また、物流における物体の正確な寸法検査も可能になります。したがって、構造化光の需要の高まりは、予測期間中に物流市場における3D測定センサーの成長をさらに後押しするでしょう。
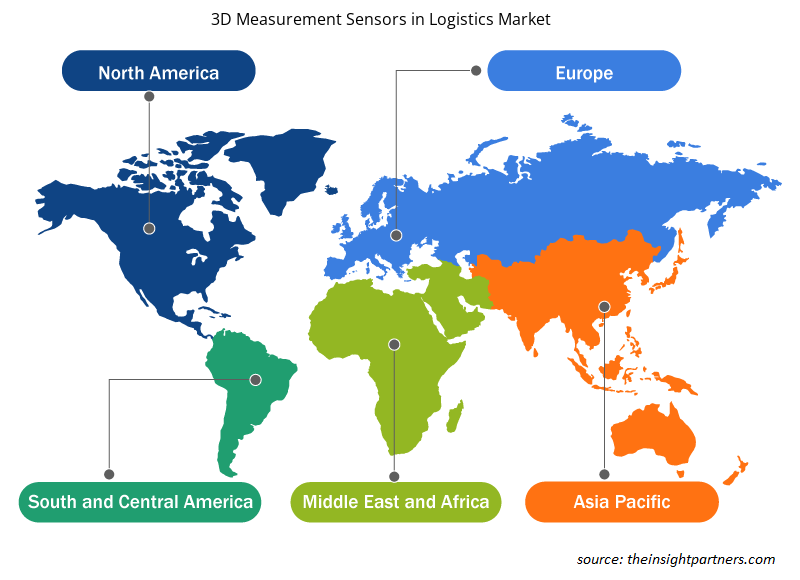
地域分析:
物流における3D測定センサーの市場規模は、北米、ヨーロッパ、アジア太平洋(APAC)、中東およびアフリカ(MEA)、南米(SAM)の5つの主要地域に大まかに区分されています。北米は2022年に物流における3D測定センサーの市場シェアで最大となり、ヨーロッパとAPACがそれに続きました。APACは、2022年から2030年にかけて、物流における3D測定センサー市場で最高のCAGRを記録すると予想されています。
北米では、技術革新により、物流市場における 3D 測定センサーの成長機会がもたらされると予測されています。この地域のさまざまな物流会社は、生産性を向上させるために倉庫を自動化しています。これにより、3D カメラやロボットなど、さまざまな倉庫自動化ソリューションの需要が高まり、北米の物流市場における 3D 測定センサーの成長が促進されています。さらに、この地域では電子商取引業界が驚異的な成長を遂げており、物流業界での自動化の採用が増加し、物流市場における 3D 測定センサーの成長を後押ししています。
主要プレーヤー分析:
Micro-Epsilon Messtechnik GmbH & Co KG、Infineon Technologies AG、Sony Semiconductor Solutions Corp、Cognex Corp、ifm Electronic GmbH、Intel Corp、LMI Technologies Inc、Keyence Corp、OMRON Corp、およびSick AGは、レポートで取り上げられている物流3D測定センサー市場の主要プレーヤーの一部です。プレーヤーの中で、Micro-Epsilon Messtechnik GmbH & Co KGとInfineon Technologies AGは、提供される多様な製品ポートフォリオにより、物流3D測定センサー市場の上位2社です。
物流市場における3D測定センサーの地域別分析
予測期間を通じて物流市場における 3D 測定センサーに影響を与える地域的な傾向と要因は、Insight Partners のアナリストによって徹底的に説明されています。このセクションでは、北米、ヨーロッパ、アジア太平洋、中東、アフリカ、南米、中米にわたる物流市場における 3D 測定センサーのセグメントと地理についても説明します。
- 物流市場における3D測定センサーの地域別データを入手
物流市場における3D測定センサーレポートの範囲
| レポート属性 | 詳細 |
|---|---|
| 2022年の市場規模 | 1億2,750万米ドル |
| 2030年までの市場規模 | 2億4,213万米ドル |
| 世界のCAGR(2022年 - 2030年) | 8.3% |
| 履歴データ | 2020-2021 |
| 予測期間 | 2023-2030 |
| 対象セグメント | タイプ別
|
| 対象地域と国 | 北米
|
| 市場リーダーと主要企業プロフィール |
|
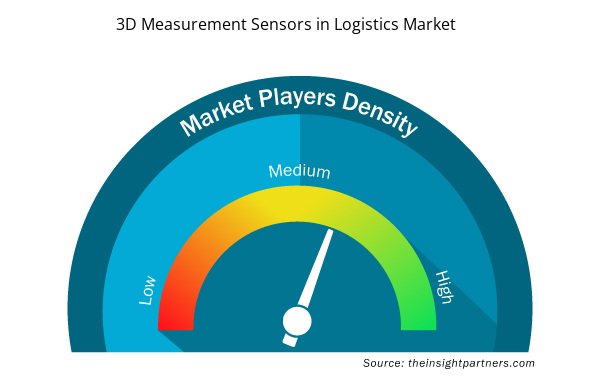
物流における 3D 測定センサー市場のプレーヤー密度: ビジネス ダイナミクスへの影響を理解する
物流市場における 3D 測定センサー市場は、消費者の嗜好の変化、技術の進歩、製品の利点に対する認識の高まりなどの要因により、エンドユーザーの需要が高まり、急速に成長しています。需要が高まるにつれて、企業は提供を拡大し、消費者のニーズを満たすために革新し、新たなトレンドを活用し、市場の成長をさらに促進しています。
市場プレーヤー密度とは、特定の市場または業界内で活動している企業または会社の分布を指します。これは、特定の市場スペースに、その市場規模または総市場価値に対してどれだけの競合相手 (市場プレーヤー) が存在するかを示します。
物流市場における3D測定センサーで事業を展開している主要企業は次のとおりです。
- Micro-Epsilon Messtechnik GmbH & Co KG
- インフィニオンテクノロジーズAG
- ソニーセミコンダクタソリューションズ株式会社
- コグネックス株式会社
- ifmエレクトロニック株式会社
免責事項:上記の企業は、特定の順序でランク付けされていません。
- 物流市場における3D測定センサーのトップキープレーヤーの概要を入手
最近の動向:
物流市場における 3D 測定センサーの企業では、合併や買収などの無機的および有機的な戦略が積極的に採用されています。最近の主要な市場動向をいくつか以下に示します。
- 2021 年、Micro-Epsilon は 3D スナップショット センサー SurfaceCONTROL 3D 3200 を開発しました。これは、マット表面の正確な形状、形状、表面測定に最適です。このセンサーは、自動化されたインライン品質検査用に開発されました。
- 2020年、Infineon Technologies AGはCypress Semiconductor Corporationの買収を完了しました。この買収により、現実世界とデジタル世界を結び付け、デジタル化を推進するための業界で最も包括的なポートフォリオを顧客に提供できるようになります。
- オムロン株式会社は2020年、組み込み用3D TOFセンサーモジュール「B5Lシリーズ」を9月1日より日本で、10月1日より世界で販売すると発表しました。B5Lシリーズは独自の光学設計技術を活用し、太陽光下でも広範囲にわたる3次元距離情報を安定して計測します。
- 2019年、SICKグループは、合弁会社の所有者であるSchädler一族から発行済み株式の50%を譲渡することで、チリの合弁会社SICK SpAの買収を完了しました。この買収により、SICKはSICK SpAの単独所有者となり、南米市場での地位を強化しました。
- SICK AGは2019年に中国に新たな生産拠点を開設し、個々の顧客向けの現地製品の製造とシステム構築に注力します。この拡張により、同社はより強化された自動化ソリューションを顧客に提供できるようになります。
- 過去2年間の分析、基準年、CAGRによる予測(7年間)
- PEST分析とSWOT分析
- 市場規模価値/数量 - 世界、地域、国
- 業界と競争環境
- Excel データセット

Report Coverage
Revenue forecast, Company Analysis, Industry landscape, Growth factors, and Trends

Segment Covered
This text is related
to segments covered.

Regional Scope
North America, Europe, Asia Pacific, Middle East & Africa, South & Central America

Country Scope
This text is related
to country scope.
よくある質問
1. Increasing Use of Measurement Sensors in Logistics
2. Growth of Logistics Industry
3D measurement sensors in logistics market accounted for US$ 127.50 Million in the year 2022 and is expected to grow at a CAGR of 8.3% during the forecast period, to account for US$ 242.13 Million in the year 2030.
Growing Automation in Logistics Industry
Asia Pacific is anticipated to grow with the highest CAGR over the forecast period.
The 3D measurement sensors in logistics market are expected to reach US$ 242.13 Million in the year 2030.
The key players holding majority shares in the 3D measurement sensors in logistics market include Micro-Epsilon Messtechnik GmbH & Co KG, Infineon Technologies AG, Sony Semiconductor Solutions Corp, Cognex Corp., and ifm Electronic GmbH.
Trends and growth analysis reports related to Electronics and Semiconductor : READ MORE..
The List of Companies - 3D Measurement Sensors in Logistics Market
- Micro-Epsilon Messtechnik GmbH & Co KG
- Infineon Technologies AG
- Sony Semiconductor Solutions Corp
- Cognex Corp
- ifm Electronic GmbH
- Intel Corp
- LMI Technologies Inc
- Keyence Corp
- OMRON Corp
- Sick AG
The Insight Partners performs research in 4 major stages: Data Collection & Secondary Research, Primary Research, Data Analysis and Data Triangulation & Final Review.
- Data Collection and Secondary Research:
As a market research and consulting firm operating from a decade, we have published and advised several client across the globe. First step for any study will start with an assessment of currently available data and insights from existing reports. Further, historical and current market information is collected from Investor Presentations, Annual Reports, SEC Filings, etc., and other information related to company’s performance and market positioning are gathered from Paid Databases (Factiva, Hoovers, and Reuters) and various other publications available in public domain.
Several associations trade associates, technical forums, institutes, societies and organization are accessed to gain technical as well as market related insights through their publications such as research papers, blogs and press releases related to the studies are referred to get cues about the market. Further, white papers, journals, magazines, and other news articles published in last 3 years are scrutinized and analyzed to understand the current market trends.
- Primary Research:
The primarily interview analysis comprise of data obtained from industry participants interview and answers to survey questions gathered by in-house primary team.
For primary research, interviews are conducted with industry experts/CEOs/Marketing Managers/VPs/Subject Matter Experts from both demand and supply side to get a 360-degree view of the market. The primary team conducts several interviews based on the complexity of the markets to understand the various market trends and dynamics which makes research more credible and precise.
A typical research interview fulfils the following functions:
- Provides first-hand information on the market size, market trends, growth trends, competitive landscape, and outlook
- Validates and strengthens in-house secondary research findings
- Develops the analysis team’s expertise and market understanding
Primary research involves email interactions and telephone interviews for each market, category, segment, and sub-segment across geographies. The participants who typically take part in such a process include, but are not limited to:
- Industry participants: VPs, business development managers, market intelligence managers and national sales managers
- Outside experts: Valuation experts, research analysts and key opinion leaders specializing in the electronics and semiconductor industry.
Below is the breakup of our primary respondents by company, designation, and region:

Once we receive the confirmation from primary research sources or primary respondents, we finalize the base year market estimation and forecast the data as per the macroeconomic and microeconomic factors assessed during data collection.
- Data Analysis:
Once data is validated through both secondary as well as primary respondents, we finalize the market estimations by hypothesis formulation and factor analysis at regional and country level.
- Macro-Economic Factor Analysis:
We analyse macroeconomic indicators such the gross domestic product (GDP), increase in the demand for goods and services across industries, technological advancement, regional economic growth, governmental policies, the influence of COVID-19, PEST analysis, and other aspects. This analysis aids in setting benchmarks for various nations/regions and approximating market splits. Additionally, the general trend of the aforementioned components aid in determining the market's development possibilities.
- Country Level Data:
Various factors that are especially aligned to the country are taken into account to determine the market size for a certain area and country, including the presence of vendors, such as headquarters and offices, the country's GDP, demand patterns, and industry growth. To comprehend the market dynamics for the nation, a number of growth variables, inhibitors, application areas, and current market trends are researched. The aforementioned elements aid in determining the country's overall market's growth potential.
- Company Profile:
The “Table of Contents” is formulated by listing and analyzing more than 25 - 30 companies operating in the market ecosystem across geographies. However, we profile only 10 companies as a standard practice in our syndicate reports. These 10 companies comprise leading, emerging, and regional players. Nonetheless, our analysis is not restricted to the 10 listed companies, we also analyze other companies present in the market to develop a holistic view and understand the prevailing trends. The “Company Profiles” section in the report covers key facts, business description, products & services, financial information, SWOT analysis, and key developments. The financial information presented is extracted from the annual reports and official documents of the publicly listed companies. Upon collecting the information for the sections of respective companies, we verify them via various primary sources and then compile the data in respective company profiles. The company level information helps us in deriving the base number as well as in forecasting the market size.
- Developing Base Number:
Aggregation of sales statistics (2020-2022) and macro-economic factor, and other secondary and primary research insights are utilized to arrive at base number and related market shares for 2022. The data gaps are identified in this step and relevant market data is analyzed, collected from paid primary interviews or databases. On finalizing the base year market size, forecasts are developed on the basis of macro-economic, industry and market growth factors and company level analysis.
- Data Triangulation and Final Review:
The market findings and base year market size calculations are validated from supply as well as demand side. Demand side validations are based on macro-economic factor analysis and benchmarks for respective regions and countries. In case of supply side validations, revenues of major companies are estimated (in case not available) based on industry benchmark, approximate number of employees, product portfolio, and primary interviews revenues are gathered. Further revenue from target product/service segment is assessed to avoid overshooting of market statistics. In case of heavy deviations between supply and demand side values, all thes steps are repeated to achieve synchronization.
We follow an iterative model, wherein we share our research findings with Subject Matter Experts (SME’s) and Key Opinion Leaders (KOLs) until consensus view of the market is not formulated – this model negates any drastic deviation in the opinions of experts. Only validated and universally acceptable research findings are quoted in our reports.
We have important check points that we use to validate our research findings – which we call – data triangulation, where we validate the information, we generate from secondary sources with primary interviews and then we re-validate with our internal data bases and Subject matter experts. This comprehensive model enables us to deliver high quality, reliable data in shortest possible time.
 このレポートの無料サンプルを入手する