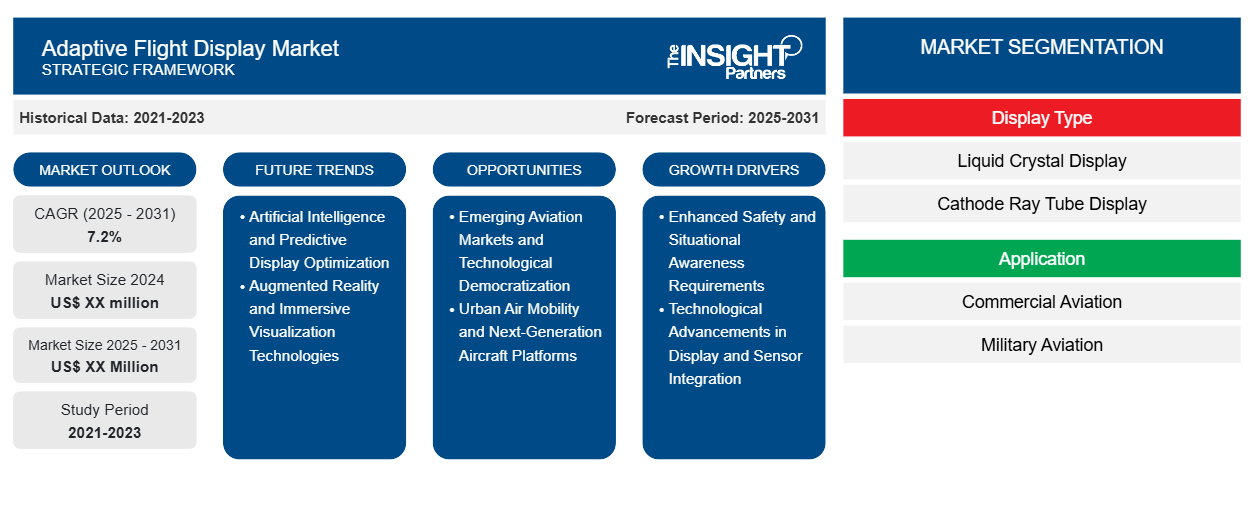
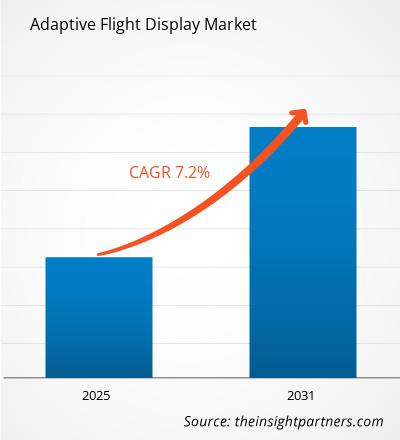
アダプティブ フライト ディスプレイ市場は、2023 年から 2031 年にかけて 7.2% の CAGR を記録し、市場規模は 2023 年の XX 百万米ドルから 2031 年には XX 百万米ドルに拡大すると予想されています。
レポートは、ディスプレイタイプ(液晶ディスプレイ、ブラウン管ディスプレイ)別にセグメント化されています。レポートではさらに、アプリケーション(商用航空、軍用航空)に基づいた分析を提示しています。グローバル分析は、地域レベルと主要国別にさらに細分化されています。レポートでは、上記の分析とセグメントについて、USD での価値を提供しています。
報告書の目的
The Insight Partners によるアダプティブ フライト ディスプレイ市場レポートは、現在の状況と将来の成長、主な推進要因、課題、機会を説明することを目的としています。これにより、次のようなさまざまなビジネス関係者に洞察が提供されます。
- テクノロジープロバイダー/メーカー: 進化する市場の動向を理解し、潜在的な成長機会を把握することで、情報に基づいた戦略的意思決定が可能になります。
- 投資家: 市場の成長率、市場の財務予測、バリュー チェーン全体に存在する機会に関する包括的な傾向分析を実施します。
- 規制機関: 市場の濫用を最小限に抑え、投資家の信用と信頼を維持し、市場の完全性と安定性を維持することを目的として、市場における政策と警察活動を規制します。
アダプティブフライトディスプレイ市場のセグメンテーション
表示タイプ
- 液晶ディスプレイ
- ブラウン管ディスプレイ
応用
- 商業航空
- 軍用航空
要件に合わせてレポートをカスタマイズする
このレポートの一部、国レベルの分析、Excelデータパックなど、あらゆるレポートを無料でカスタマイズできます。また、スタートアップや大学向けのお得なオファーや割引もご利用いただけます。
アダプティブフライトディスプレイ市場:戦略的洞察
- このレポートの主要な市場動向を入手してください。この無料サンプルには、市場動向から見積もりや予測に至るまでのデータ分析が含まれます。
アダプティブフライトディスプレイ市場の成長要因
- 安全性と状況認識の強化要件: 高度なパイロット状況認識に対する需要の高まりが、アダプティブ フライト ディスプレイ市場の成長を根本的に推進しています。現代の航空環境では、複雑な飛行パラメータをリアルタイムで動的に調整できる、ますます高度な情報表示テクノロジが必要です。商業航空および軍事航空部門では、認知作業負荷を軽減し、パイロット エラーを最小限に抑え、直感的で状況認識型の情報視覚化を提供し、重要な飛行操作や厳しい環境条件下での意思決定を迅速化するディスプレイ テクノロジを優先しています。
- ディスプレイとセンサーの統合における技術の進歩: ディスプレイ技術、センサーの統合、計算能力の急速な進歩により、アダプティブ フライト ディスプレイ市場が前進しています。新しい技術により、現在の飛行状況、ミッション パラメータ、潜在的なリスク シナリオに基づいて視覚情報を自動的に再構成できる、より高度で応答性の高いディスプレイ システムが実現しています。高解像度のグラフィックス、予測アルゴリズム、シームレスなセンサー データ統合を特徴とする高度なディスプレイ技術により、よりインテリジェントで応答性の高いコックピット情報管理システムが実現しています。
アダプティブフライトディスプレイ市場の将来動向
- 人工知能と予測的ディスプレイ最適化: 適応型フライト ディスプレイ市場の顕著なトレンドは、人工知能の統合が進み、よりインテリジェントでコンテキスト認識型のディスプレイ インターフェイスが作られていることです。AI 搭載システムにより、パイロットの好みを学習し、情報ニーズを予測し、重要なフライト情報を動的に優先順位付けできるディスプレイが実現しています。機械学習アルゴリズムにより、フライト ディスプレイは静的な情報パネルから、潜在的な問題を予測し、情報の表示を最適化し、全体的なフライトの安全性を強化できるインテリジェントで適応的な環境へと変化しています。
- 拡張現実と没入型視覚化技術: アダプティブ フライト ディスプレイ市場では、拡張現実と没入型視覚化技術への大きなトレンドが生まれています。メーカーは、重要な飛行情報をフロントガラスに直接重ねて表示するディスプレイ システムを開発しており、パイロットが主要な飛行経路から注意をそらすことなく、シームレスで直感的な情報表示を実現しています。このトレンドにより、複雑な飛行データを現実世界の視覚環境に統合する高度なヘッドアップ ディスプレイやヘルメット マウント システムの開発が促進されています。
アダプティブフライトディスプレイの市場機会
- 新興航空市場と技術の民主化: 航空市場の発展と技術へのアクセス性の向上により、アダプティブ フライト ディスプレイ技術に大きなチャンスが生まれています。新興経済国で成長を続ける商業航空部門は、安全性と運用効率を高める高度なコックピット技術を求めています。高度なディスプレイ技術のコストが下がったことで、さまざまな航空機タイプや運用領域でより広範囲に採用できるようになり、メーカーが市場範囲を拡大する機会が生まれています。
- 都市型航空モビリティと次世代航空機プラットフォーム: 都市型航空モビリティの新たなエコシステムと次世代航空機プラットフォームの開発は、アダプティブ フライト ディスプレイ市場の拡大にとって大きなチャンスとなります。電動垂直離着陸 (eVTOL) 車両、自律型航空機、革新的な航空機設計には、複雑な運用パラメータを管理できる高度で適応性の高いディスプレイ技術が必要です。これらの新たなプラットフォームには、新しい航空輸送モードをサポートできる、より直感的で応答性に優れ、状況に応じたディスプレイ システムが必要です。
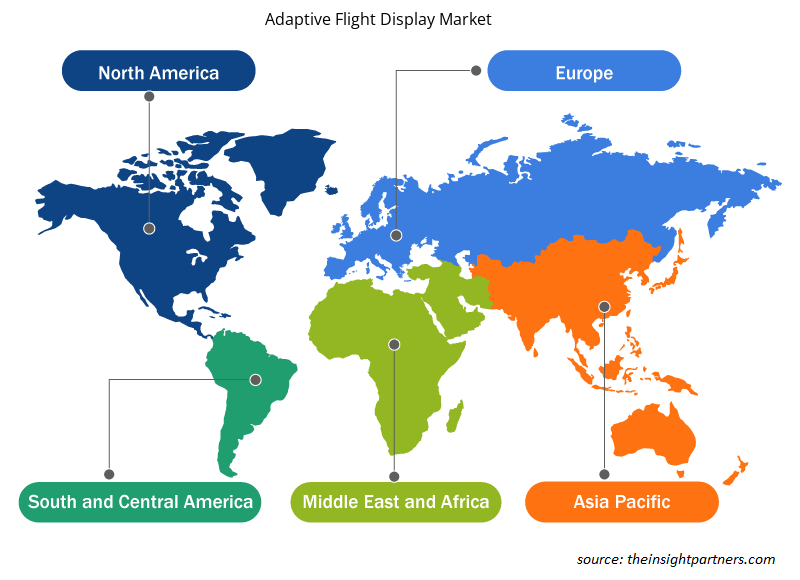
アダプティブ フライト ディスプレイ市場の地域別分析
予測期間を通じてアダプティブ フライト ディスプレイ市場に影響を与える地域的な傾向と要因は、Insight Partners のアナリストによって徹底的に説明されています。このセクションでは、北米、ヨーロッパ、アジア太平洋、中東およびアフリカ、南米および中米にわたるアダプティブ フライト ディスプレイ市場のセグメントと地理についても説明します。
- アダプティブフライトディスプレイ市場の地域別データを入手
アダプティブフライトディスプレイ市場レポートの範囲
| レポート属性 | 詳細 |
|---|---|
| 2023年の市場規模 | XX百万米ドル |
| 2031年までの市場規模 | XX百万米ドル |
| 世界のCAGR(2023年~2031年) | 7.2% |
| 履歴データ | 2021-2022 |
| 予測期間 | 2024-2031 |
| 対象セグメント | ディスプレイタイプ別
|
| 対象地域と国 | 北米
|
| 市場リーダーと主要企業プロフィール |
|
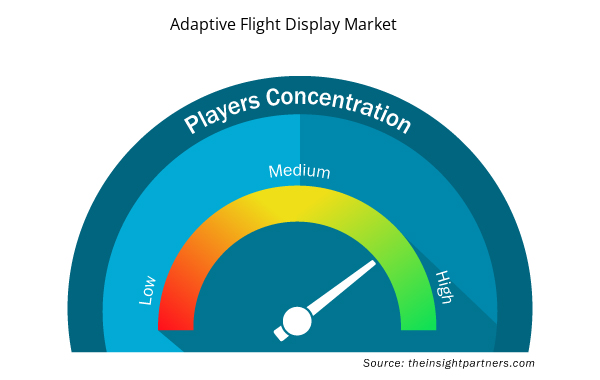
アダプティブフライトディスプレイ市場のプレーヤー密度:ビジネスダイナミクスへの影響を理解する
アダプティブ フライト ディスプレイ市場は、消費者の嗜好の変化、技術の進歩、製品の利点に対する認識の高まりなどの要因により、エンド ユーザーの需要が高まり、急速に成長しています。需要が高まるにつれて、企業は提供内容を拡大し、消費者のニーズを満たすために革新を起こし、新たなトレンドを活用し、市場の成長をさらに促進しています。
市場プレーヤー密度とは、特定の市場または業界内で活動している企業または会社の分布を指します。これは、特定の市場スペースに、その規模または総市場価値と比較して、どれだけの競合相手 (市場プレーヤー) が存在するかを示します。
アダプティブフライトディスプレイ市場で事業を展開している主要企業は次のとおりです。
- エアバスSAS
- アスペンアビオニクス社
- コリンズエアロスペース
- ダイノン・アビオニクス
- ガーミン株式会社
免責事項:上記の企業は、特定の順序でランク付けされていません。
- アダプティブフライトディスプレイ市場のトップキープレーヤーの概要を入手
主なセールスポイント
- 包括的なカバレッジ: レポートでは、アダプティブ フライト ディスプレイ市場の製品、サービス、タイプ、エンド ユーザーの分析を包括的にカバーし、全体的な展望を提供します。
- 専門家による分析: レポートは、業界の専門家とアナリストの深い理解に基づいてまとめられています。
- 最新情報: このレポートは、最新の情報とデータの傾向を網羅しているため、ビジネスの関連性を保証します。
- カスタマイズ オプション: このレポートは、特定のクライアント要件に対応し、ビジネス戦略に適切に適合するようにカスタマイズできます。
したがって、アダプティブ フライト ディスプレイ市場に関する調査レポートは、業界のシナリオと成長の見通しを解読して理解する道の先導役となる可能性があります。いくつかの正当な懸念があるかもしれませんが、このレポートの全体的な利点は欠点を上回る傾向があります。
- 過去2年間の分析、基準年、CAGRによる予測(7年間)
- PEST分析とSWOT分析
- 市場規模価値/数量 - 世界、地域、国
- 業界と競争環境
- Excel データセット

Report Coverage
Revenue forecast, Company Analysis, Industry landscape, Growth factors, and Trends

Segment Covered
This text is related
to segments covered.

Regional Scope
North America, Europe, Asia Pacific, Middle East & Africa, South & Central America

Country Scope
This text is related
to country scope.
よくある質問
Some of the customization options available based on the request are an additional 3-5 company profiles and country-specific analysis of 3-5 countries of your choice. Customizations are to be requested/discussed before making final order confirmation, as our team would review the same and check the feasibility.
The report can be delivered in PDF/PPT format; we can also share excel dataset based on the request.
The leading players operating in the Adaptive Flight Display Market include Airbus S.A.S., Aspen Avionics, Inc., Collins Aerospace, Dynon Avionics, Garmin Ltd., L3Harris Technologies, Inc., Meggitt PLC, Sandel Avionics, Inc., Thales Group, Universal Avionics Systems Corporation
The Adaptive Flight Display Market is estimated to witness a CAGR of 7.2% from 2023 to 2031
Shift Towards Modular Display Solutions and Emphasis on User-Centric Design are the key future trends of the Adaptive Flight Display Market
The major factors driving the Adaptive Flight Display Market are: Continuous Development of Display Technologies and Rising Demand for Higher Situational Awareness of Pilots
Trends and growth analysis reports related to Aerospace and Defense : READ MORE..
1. Airbus S.A.S.
2. Aspen Avionics, Inc.
3. Collins Aerospace
4. Dynon Avionics
5. Garmin Ltd.
6. L3Harris Technologies, Inc.
7. Meggitt PLC
8. Sandel Avionics, Inc.
9. Thales Group
10. Universal Avionics Systems Corporation
The Insight Partners performs research in 4 major stages: Data Collection & Secondary Research, Primary Research, Data Analysis and Data Triangulation & Final Review.
- Data Collection and Secondary Research:
As a market research and consulting firm operating from a decade, we have published and advised several client across the globe. First step for any study will start with an assessment of currently available data and insights from existing reports. Further, historical and current market information is collected from Investor Presentations, Annual Reports, SEC Filings, etc., and other information related to company’s performance and market positioning are gathered from Paid Databases (Factiva, Hoovers, and Reuters) and various other publications available in public domain.
Several associations trade associates, technical forums, institutes, societies and organization are accessed to gain technical as well as market related insights through their publications such as research papers, blogs and press releases related to the studies are referred to get cues about the market. Further, white papers, journals, magazines, and other news articles published in last 3 years are scrutinized and analyzed to understand the current market trends.
- Primary Research:
The primarily interview analysis comprise of data obtained from industry participants interview and answers to survey questions gathered by in-house primary team.
For primary research, interviews are conducted with industry experts/CEOs/Marketing Managers/VPs/Subject Matter Experts from both demand and supply side to get a 360-degree view of the market. The primary team conducts several interviews based on the complexity of the markets to understand the various market trends and dynamics which makes research more credible and precise.
A typical research interview fulfils the following functions:
- Provides first-hand information on the market size, market trends, growth trends, competitive landscape, and outlook
- Validates and strengthens in-house secondary research findings
- Develops the analysis team’s expertise and market understanding
Primary research involves email interactions and telephone interviews for each market, category, segment, and sub-segment across geographies. The participants who typically take part in such a process include, but are not limited to:
- Industry participants: VPs, business development managers, market intelligence managers and national sales managers
- Outside experts: Valuation experts, research analysts and key opinion leaders specializing in the electronics and semiconductor industry.
Below is the breakup of our primary respondents by company, designation, and region:

Once we receive the confirmation from primary research sources or primary respondents, we finalize the base year market estimation and forecast the data as per the macroeconomic and microeconomic factors assessed during data collection.
- Data Analysis:
Once data is validated through both secondary as well as primary respondents, we finalize the market estimations by hypothesis formulation and factor analysis at regional and country level.
- Macro-Economic Factor Analysis:
We analyse macroeconomic indicators such the gross domestic product (GDP), increase in the demand for goods and services across industries, technological advancement, regional economic growth, governmental policies, the influence of COVID-19, PEST analysis, and other aspects. This analysis aids in setting benchmarks for various nations/regions and approximating market splits. Additionally, the general trend of the aforementioned components aid in determining the market's development possibilities.
- Country Level Data:
Various factors that are especially aligned to the country are taken into account to determine the market size for a certain area and country, including the presence of vendors, such as headquarters and offices, the country's GDP, demand patterns, and industry growth. To comprehend the market dynamics for the nation, a number of growth variables, inhibitors, application areas, and current market trends are researched. The aforementioned elements aid in determining the country's overall market's growth potential.
- Company Profile:
The “Table of Contents” is formulated by listing and analyzing more than 25 - 30 companies operating in the market ecosystem across geographies. However, we profile only 10 companies as a standard practice in our syndicate reports. These 10 companies comprise leading, emerging, and regional players. Nonetheless, our analysis is not restricted to the 10 listed companies, we also analyze other companies present in the market to develop a holistic view and understand the prevailing trends. The “Company Profiles” section in the report covers key facts, business description, products & services, financial information, SWOT analysis, and key developments. The financial information presented is extracted from the annual reports and official documents of the publicly listed companies. Upon collecting the information for the sections of respective companies, we verify them via various primary sources and then compile the data in respective company profiles. The company level information helps us in deriving the base number as well as in forecasting the market size.
- Developing Base Number:
Aggregation of sales statistics (2020-2022) and macro-economic factor, and other secondary and primary research insights are utilized to arrive at base number and related market shares for 2022. The data gaps are identified in this step and relevant market data is analyzed, collected from paid primary interviews or databases. On finalizing the base year market size, forecasts are developed on the basis of macro-economic, industry and market growth factors and company level analysis.
- Data Triangulation and Final Review:
The market findings and base year market size calculations are validated from supply as well as demand side. Demand side validations are based on macro-economic factor analysis and benchmarks for respective regions and countries. In case of supply side validations, revenues of major companies are estimated (in case not available) based on industry benchmark, approximate number of employees, product portfolio, and primary interviews revenues are gathered. Further revenue from target product/service segment is assessed to avoid overshooting of market statistics. In case of heavy deviations between supply and demand side values, all thes steps are repeated to achieve synchronization.
We follow an iterative model, wherein we share our research findings with Subject Matter Experts (SME’s) and Key Opinion Leaders (KOLs) until consensus view of the market is not formulated – this model negates any drastic deviation in the opinions of experts. Only validated and universally acceptable research findings are quoted in our reports.
We have important check points that we use to validate our research findings – which we call – data triangulation, where we validate the information, we generate from secondary sources with primary interviews and then we re-validate with our internal data bases and Subject matter experts. This comprehensive model enables us to deliver high quality, reliable data in shortest possible time.
 このレポートの無料サンプルを入手する